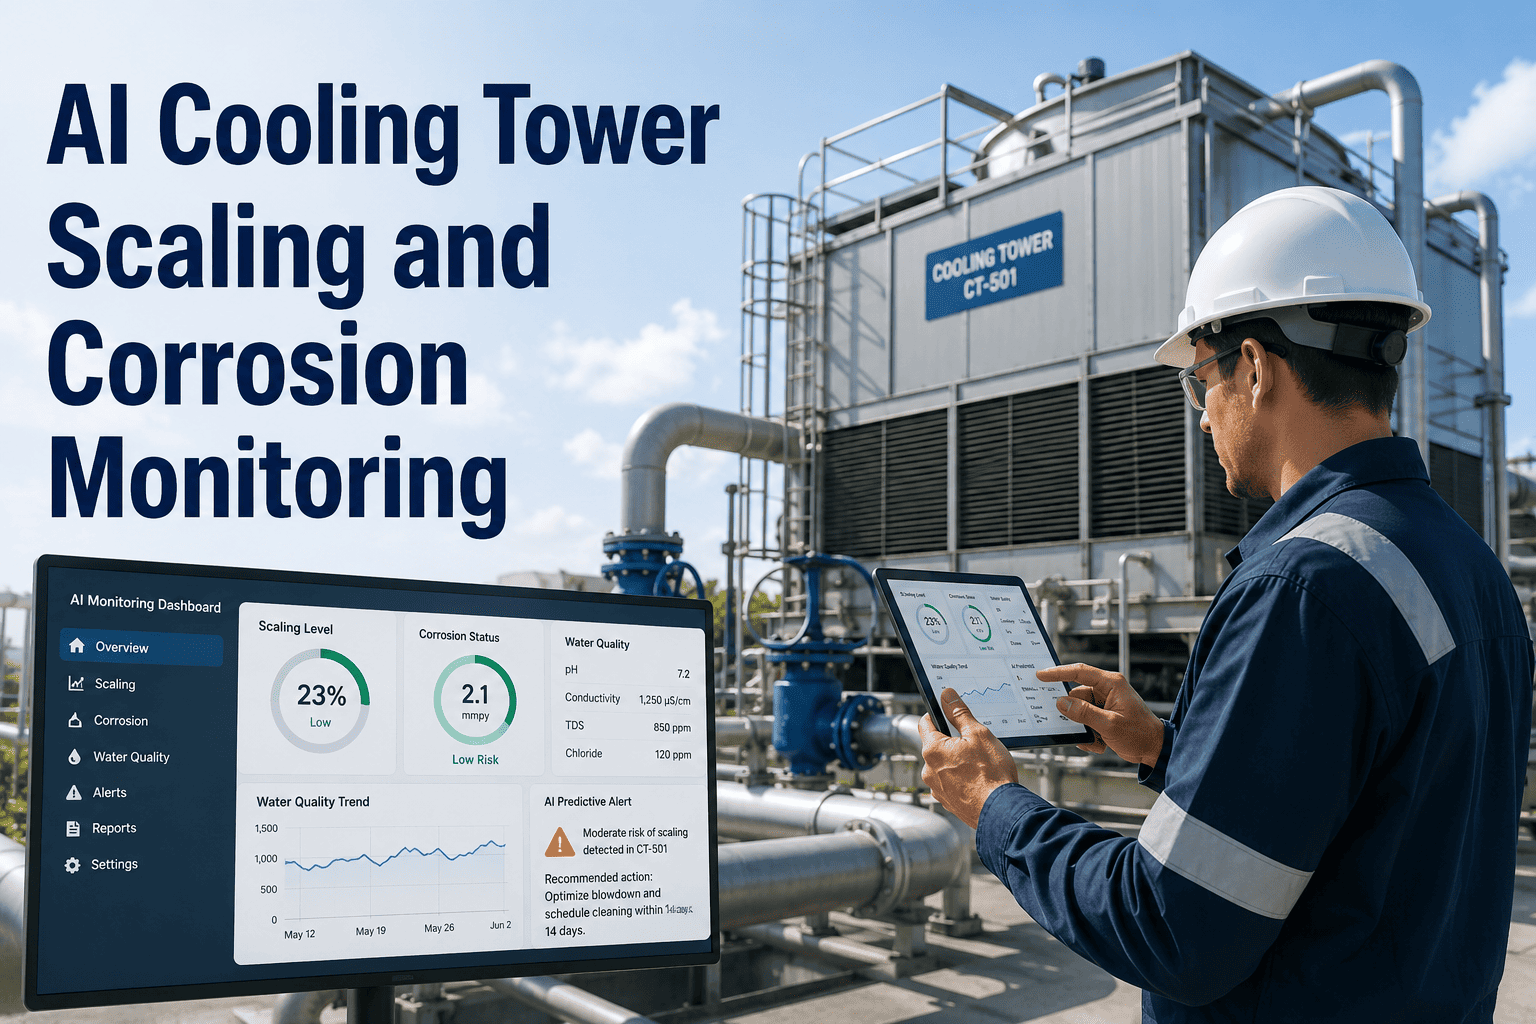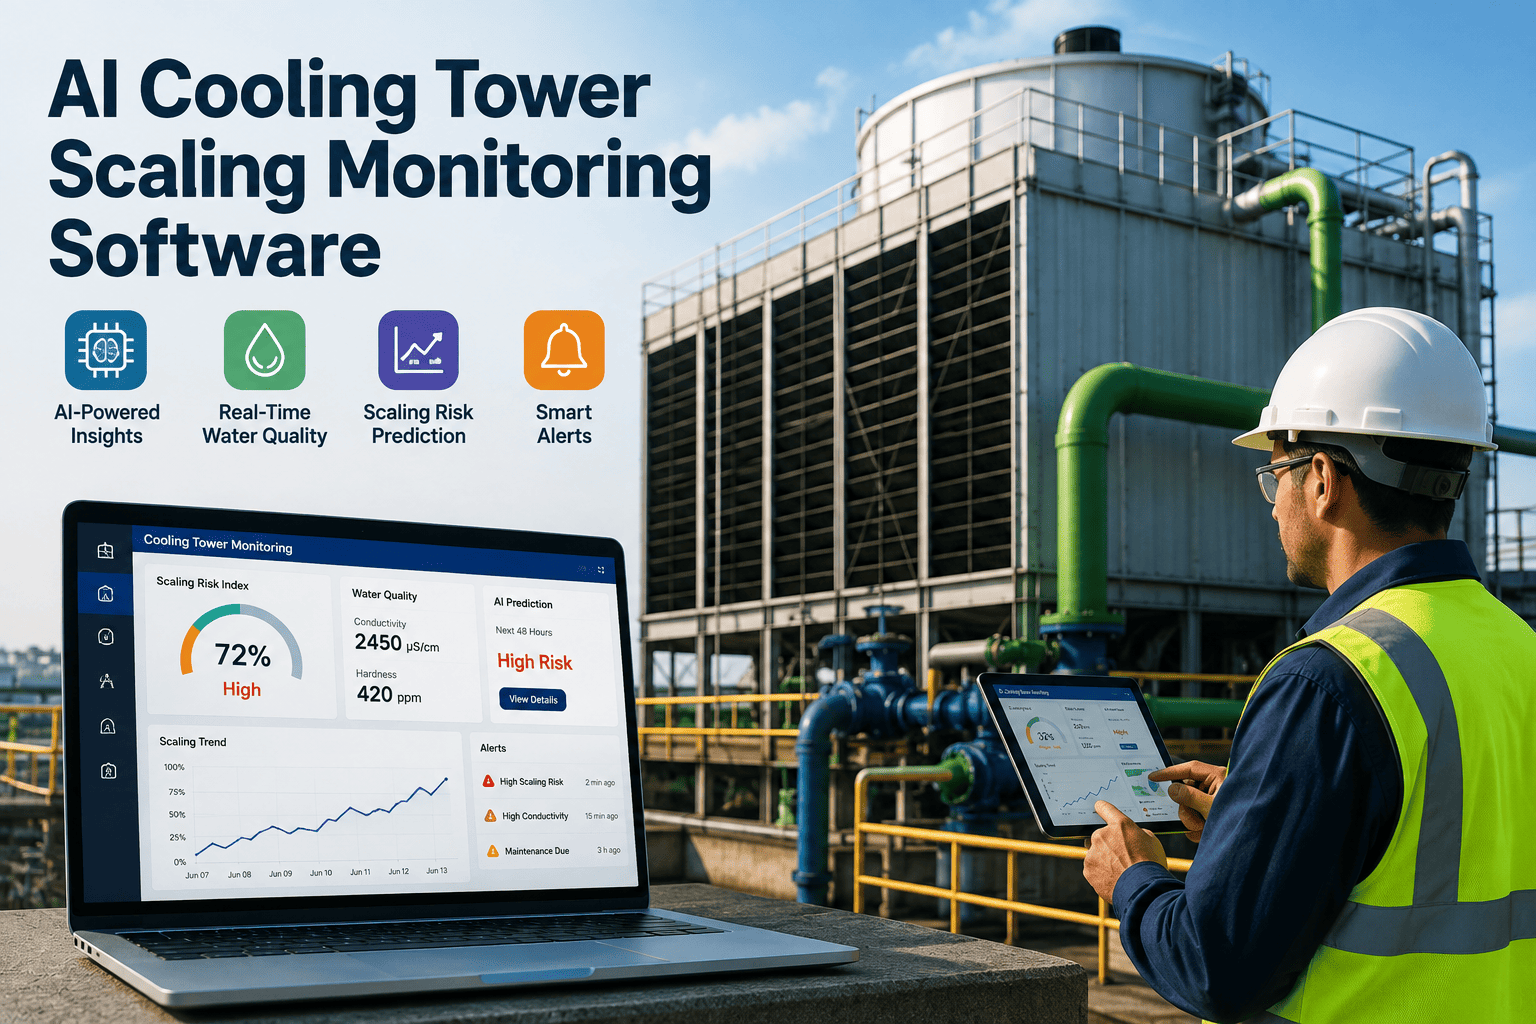
A cooling tower doesn't announce scaling with a warning light — it announces it three months later as a compressor working harder, a chiller pulling more amps, and a maintenance manager staring at an energy bill nobody can explain. By the time calcium carbonate is visible on a fill sheet, the heat transfer surface has already been losing efficiency for weeks. Conductivity meters catch some of it, but a single number checked once a shift cannot see a trend forming between readings — which is the exact gap OxMaint's AI cooling tower monitoring was built to close.
AI Monitoring · Cooling Tower Scaling · OxMaint
Scaling Doesn't Start On The Fill. It Starts As A Slow Drift In Numbers Nobody Was Watching Closely Enough.
OxMaint tracks conductivity, cycles of concentration, and approach temperature continuously, flags the drift while it is still a chemistry problem, and closes the loop with a work order before it becomes a fouled heat exchanger.
5–10
Cycles of concentration most cooling towers target for scale control, set by makeup water quality and treatment program
1 reading
Is all a manual shift log usually captures — not enough points to see a trend forming between checks
<300 µS
Makeup conductivity threshold below which scale itself can mask the very reading used to calculate cycles
Real-time
Frequency OxMaint checks conductivity, COC, and approach temperature against your tower's own baseline
The Scaling Curve
Every Cooling Tower Moves Through The Same Three Stages — Most Facilities Only Notice The Last One
Scale does not form overnight. It builds through a chemistry drift that is measurable weeks before anyone sees a white crust on the fill or feels a warm return line. The stage you catch it in decides whether the fix is a chemical dose or a tube-bundle cleaning.
Stable Chemistry
Cycles holding steady, conductivity tracking makeup ratio, approach temp flat
Drift Beginning
Conductivity climbing past target cycles, calcium and alkalinity trending up together
Active Scaling
Approach temperature rising, conductivity reading unreliable as scale consumes hardness
The Four Numbers That Actually Predict Scaling
A cooling tower generates dozens of data points a day. Four of them, watched together instead of separately, tell you almost everything about where the tower sits on the scaling curve.
01
Conductivity
The fastest available signal for dissolved solids in circulating water. Reliable day to day, but it can quietly understate a scaling problem once calcium and alkalinity start depositing instead of staying dissolved.
02
Cycles Of Concentration
Circulating conductivity divided by makeup conductivity. Run it too low and you waste water and chemical. Run it too high without tight control and scale risk climbs fast — the balance every treatment program is built around.
03
Approach Temperature
The gap between cold water leaving the tower and the ambient wet bulb. A creeping approach temperature is one of the earliest physical signs that a heat transfer surface is losing efficiency to fouling.
04
Blowdown & Makeup Volume
Logged automatically, these confirm whether the blowdown control is actually holding the target cycles it was set to — or whether the setpoint and the real tower chemistry have quietly drifted apart.
OxMaint · AI Cooling Tower Monitoring
Stop Reading One Number Off One Meter Once A Shift.
OxMaint pulls conductivity, cycles, approach temperature, and blowdown volume into one asset view, learns your tower's normal range, and raises a work order the moment the pattern — not just a single reading — says something is changing.
From Drifting Reading To Closed Work Order — How OxMaint Runs It
Stage 1
Sensor Or Manual Reading Lands In OxMaint
Conductivity, temperature, and flow feed in from IoT sensors or a technician's mobile entry — either path lands in the same asset record.
Stage 2
Reading Is Checked Against That Tower's Own Baseline
OxMaint compares the new value against this specific tower's historical range, not a generic industry number that ignores your makeup water.
Stage 3
Drift Across Multiple Parameters Gets Flagged
A single high conductivity reading might be noise. Conductivity, cycles, and approach temperature moving together is the pattern that actually predicts scale.
Stage 4
Work Order Generates Before Fill Is Visibly Fouled
The alert converts straight into a work order — dosing check, blowdown adjustment, or inspection — routed to the technician certified for that tower.
Stage 5
Every Reading And Action Logs To The Asset History
The full trend line — and every action taken on it — stays attached to the tower, ready for a water treatment review or a compliance audit.
Shift Log Versus OxMaint — What Changes On The Tower Deck
Monitoring Task
Manual Shift Log
OxMaint AI Monitoring
Conductivity checks
Once or twice a shift, easy to skip on a busy day
Continuous, with drift compared to the tower's own history
Cycles of concentration
Calculated by hand from a paper log, often days old
Calculated live from circulating and makeup conductivity
Approach temperature trend
Rarely tracked as a trend at all
Charted against ambient wet bulb, flagged on creep
Response to a scaling signal
Noticed after fill inspection shows visible deposits
Work order raised while the fix is still a chemistry adjustment
Audit-ready history
Loose paper logs, hard to reconstruct months later
Full trend line and every action logged to the asset
The OxMaint Outcome
What A Tower Looks Like Once Scaling Is Caught In Stage One
Weeks Earlier
Scaling flagged while it is still a dosing fix, not a tube-bundle cleaning
Fewer Blowdowns
Cycles held closer to target instead of over-corrected on guesswork
One Trend Line
Conductivity, cycles, and approach temp read together, not off separate sheets
14 Days
From free trial to live cooling tower monitoring on your own baseline data
Frequently Asked Questions
How does AI cooling tower monitoring actually catch scaling earlier than a shift log?
It compares conductivity, cycles of concentration, and approach temperature against that specific tower's own history rather than one reading in isolation, so a slow drift across all three shows up as a pattern weeks before a fill inspection would catch it visually. Start a free trial to see it against your own tower data.
What is cycles of concentration and why does it matter for scale control?
Cycles of concentration is the ratio of circulating water conductivity to makeup water conductivity, showing how concentrated dissolved solids have become. Most towers target roughly five to ten cycles depending on makeup water quality and treatment program, since running too high without tight control raises scale risk.
Can conductivity readings alone be misleading during active scaling?
Yes. Once calcium and alkalinity start depositing as scale instead of staying dissolved, conductivity can actually understate how concentrated the water has become, which is why OxMaint tracks it alongside cycles and approach temperature rather than as a standalone number.
Does OxMaint replace the water treatment specialist managing our dosing program?
No — OxMaint gives your team and your treatment specialist a continuous, shared view of the trend data so dosing decisions are based on live chemistry instead of a log sheet checked once a shift. Book a demo to see the shared view.
How long does it take to get a cooling tower live on OxMaint monitoring?
Most facilities are live within fourteen days of starting a trial, with sensor or manual reading intervals set against the tower's own baseline data from day one so alerts are meaningful immediately, not months later.
Live In 14 Days · No Implementation Fees
Catch The Drift Before It Becomes A Cleaning Job.
Conductivity, cycles of concentration, and approach temperature — watched together, against your own tower's baseline, with a work order raised the moment the pattern changes.