The hybrid workplace has permanently changed how buildings are used — but most facilities teams are still managing cleaning schedules, HVAC runtimes, and service levels based on pre-pandemic occupancy assumptions. In a world where desk occupancy fluctuates 40–90% day by day, the facilities team that operates on data rather than assumptions delivers better service at lower cost — and generates the analytics leadership needs to make real estate decisions.
P1 Critical · Analytics & Reporting · Article
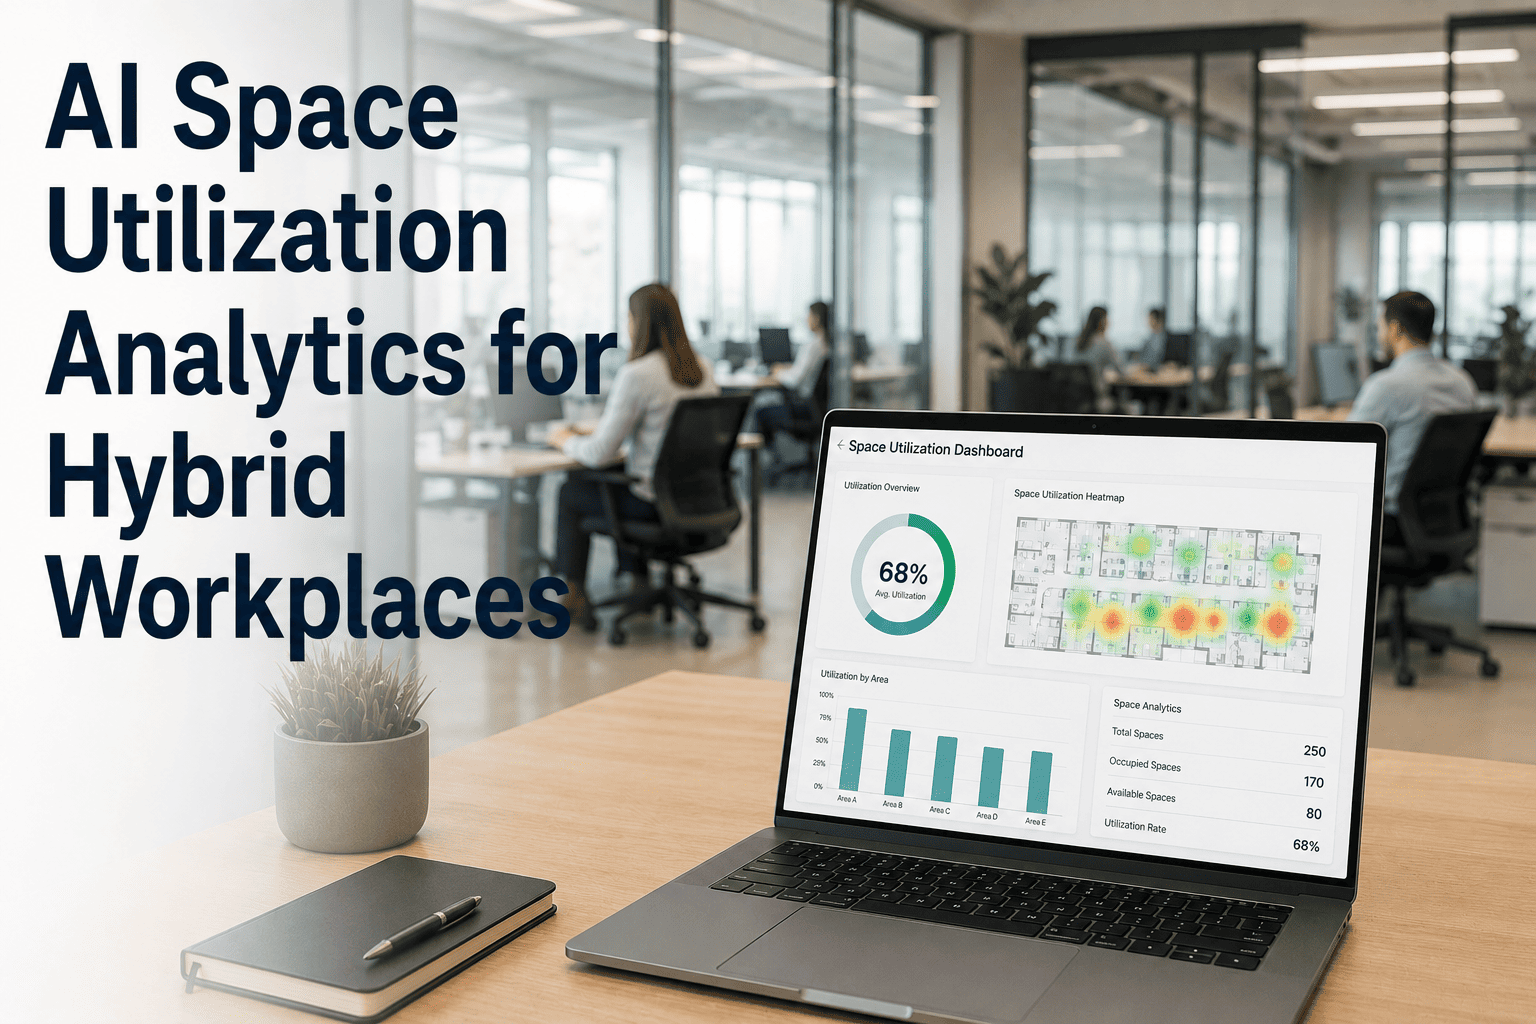
AI Space Utilization Analytics for Hybrid Workplaces
Use real occupancy data to optimize cleaning frequency, HVAC scheduling, and space planning — cutting operational costs by 20–30% while improving service quality where people actually are.
Before vs After: Managing Facilities on Assumptions vs Data
Without Occupancy Analytics
Fixed cleaning schedule regardless of actual use — restrooms cleaned at 10AM even if unused all morning
HVAC runs full building hours whether 20% or 90% occupied
Facility complaints drive maintenance priorities — loudest voice wins
Space planning relies on badge swipe data that misses actual desk or room usage
Real estate decisions made on perception, not utilization evidence
With AI Space Utilization Analytics
Cleaning triggered by occupancy thresholds — high-use zones get more attention, low-use zones less
HVAC zones activate 30 min before occupancy — off within 20 min of last person leaving
Maintenance prioritized by actual usage intensity — high-traffic floors serviced first
Real desk and room utilization data identifies consolidation and sublease opportunities
Portfolio decisions supported by 90-day utilization trending reports
The Operational Impact: What the Data Shows
Facilities that have deployed occupancy-linked operations management report measurable improvements across energy, labor, and tenant satisfaction in the first year. The figures below represent aggregate outcomes from commercial office facilities ranging from 50,000 to 500,000 sq ft operating hybrid work models.
| Operational Area |
Without Utilization Data |
With AI Analytics |
Typical Improvement |
| HVAC energy consumption |
Full schedule, all zones, all hours |
Demand-driven zonal control |
18 – 28% reduction |
| Cleaning labor hours |
Fixed route, fixed frequency |
Occupancy-triggered dispatch |
15 – 25% efficiency gain |
| Tenant satisfaction score |
Reactive — complaints-based |
Proactive high-traffic servicing |
22% average score increase |
| Restroom service SLA compliance |
60 – 70% (time-based) |
85 – 95% (usage-based) |
25 – 35% SLA improvement |
| Unutilized space identified |
Estimated — anecdotal |
Measured — floor-by-floor |
15 – 30% of portfolio |
OxMaint connects occupancy sensor data to work order scheduling — so cleaning, HVAC, and maintenance tasks are triggered by real usage, not fixed clocks. Book a demo to see the integration in action.
What AI Space Utilization Analytics Covers
Modern space utilization analytics platforms integrate multiple data sources to build a complete operational picture — from real-time occupancy counts to 90-day trend analysis for portfolio planning. Here is what each layer delivers and how it connects to facility management workflows.
Occupancy Sensors
Real-time desk, room, and zone headcount
Trigger cleaning dispatch, HVAC setpoint adjustment, security staffing
Badge Access Logs
Entry/exit timing, floor-level presence
Building-open / building-close automation, energy management
Meeting Room Booking
Booked vs actually used room-hours
Ghost booking identification, AV/HVAC pre-conditioning schedules
WiFi Connection Density
Floor-level occupancy proxy — no hardware install
Quick deployment for large portfolios without sensor investment
Energy Sub-Metering
Consumption per floor or zone vs occupancy
Energy intensity KPI, HVAC optimization validation, ESG reporting
The hybrid workplace has exposed a fundamental gap in how facilities teams operate: we were trained to manage buildings that were consistently occupied at 80–90% from 8 to 6. Now occupancy ranges from 15% on a Monday to 85% on a Wednesday and back to 30% on a Friday — in the same building, week after week. The facilities team that is still cleaning to a fixed Monday–Friday schedule and running HVAC on a 7AM–7PM timer is leaving 20–30% of their budget on the table. More importantly, they are cleaning empty floors while high-traffic areas are understaffed on peak days. OxMaint's occupancy-linked work order system solves this by turning sensor data into scheduled action — so your team responds to how the building is actually being used, not how you assumed it would be three years ago.
Frequently Asked Questions
What type of occupancy sensors work best for hybrid workplace analytics?
The choice of sensor depends on the granularity needed and privacy requirements. Passive infrared (PIR) sensors work well for room-level presence detection at low cost. Time-of-flight sensors provide anonymized headcount without image capture and are increasingly preferred in privacy-sensitive environments. For desk-level occupancy in open-plan floors, under-desk ultrasonic sensors are the current standard. For facilities not ready for new hardware investment, WiFi device counting via existing access point data provides a useful floor-level occupancy proxy with no additional installation.
OxMaint accepts occupancy data from all major sensor platforms via API.
Book a demo to review integration options for your building technology stack.
How does space utilization data support real estate portfolio decisions?
Utilization data answers the questions that badge swipe data and booking system reports cannot: which floors, wings, or buildings are consistently underused across the week and month, what is the actual peak headcount versus leased capacity for each space, and which meeting room configurations are used versus booked but abandoned. With 90-day trending data, real estate teams can identify consolidation candidates, negotiate lease renewals from an evidence base, and design space differently for future fit-outs.
OxMaint's analytics reporting module generates portfolio utilization summaries in formats ready for leadership review and real estate committee presentations.
How quickly can occupancy-linked maintenance scheduling be implemented?
For facilities with existing occupancy sensors or BMS integrations, OxMaint can be configured to receive occupancy triggers and generate linked maintenance work orders within 1–2 weeks. For facilities starting from scratch with occupancy sensor installation, the typical timeline is 4–8 weeks depending on building size and sensor type. The fastest path to benefit is often using existing WiFi data or access control logs as the occupancy proxy while planning a sensor deployment — this delivers most of the scheduling optimization immediately.
Book a 30-minute session to map the fastest implementation path for your specific building configuration.
Manage Your Hybrid Workplace on Data, Not Assumptions
OxMaint links occupancy analytics to maintenance scheduling — so cleaning, HVAC, and facility services respond to how your building is actually being used. Real efficiency for real hybrid work patterns.