Buildings account for nearly 40% of global carbon emissions — and most facility managers have no reliable way to measure their building's contribution in real time. Utility bills arrive monthly, maintenance activities go untracked from an emissions perspective, and ESG reports are assembled manually from disconnected data sources weeks before deadlines. OxMaint's Energy and ESG Reporting module changes that by connecting maintenance workflows, equipment performance data, and energy consumption into a single live carbon dashboard — giving facility teams the visibility to reduce emissions and the documentation to prove it.
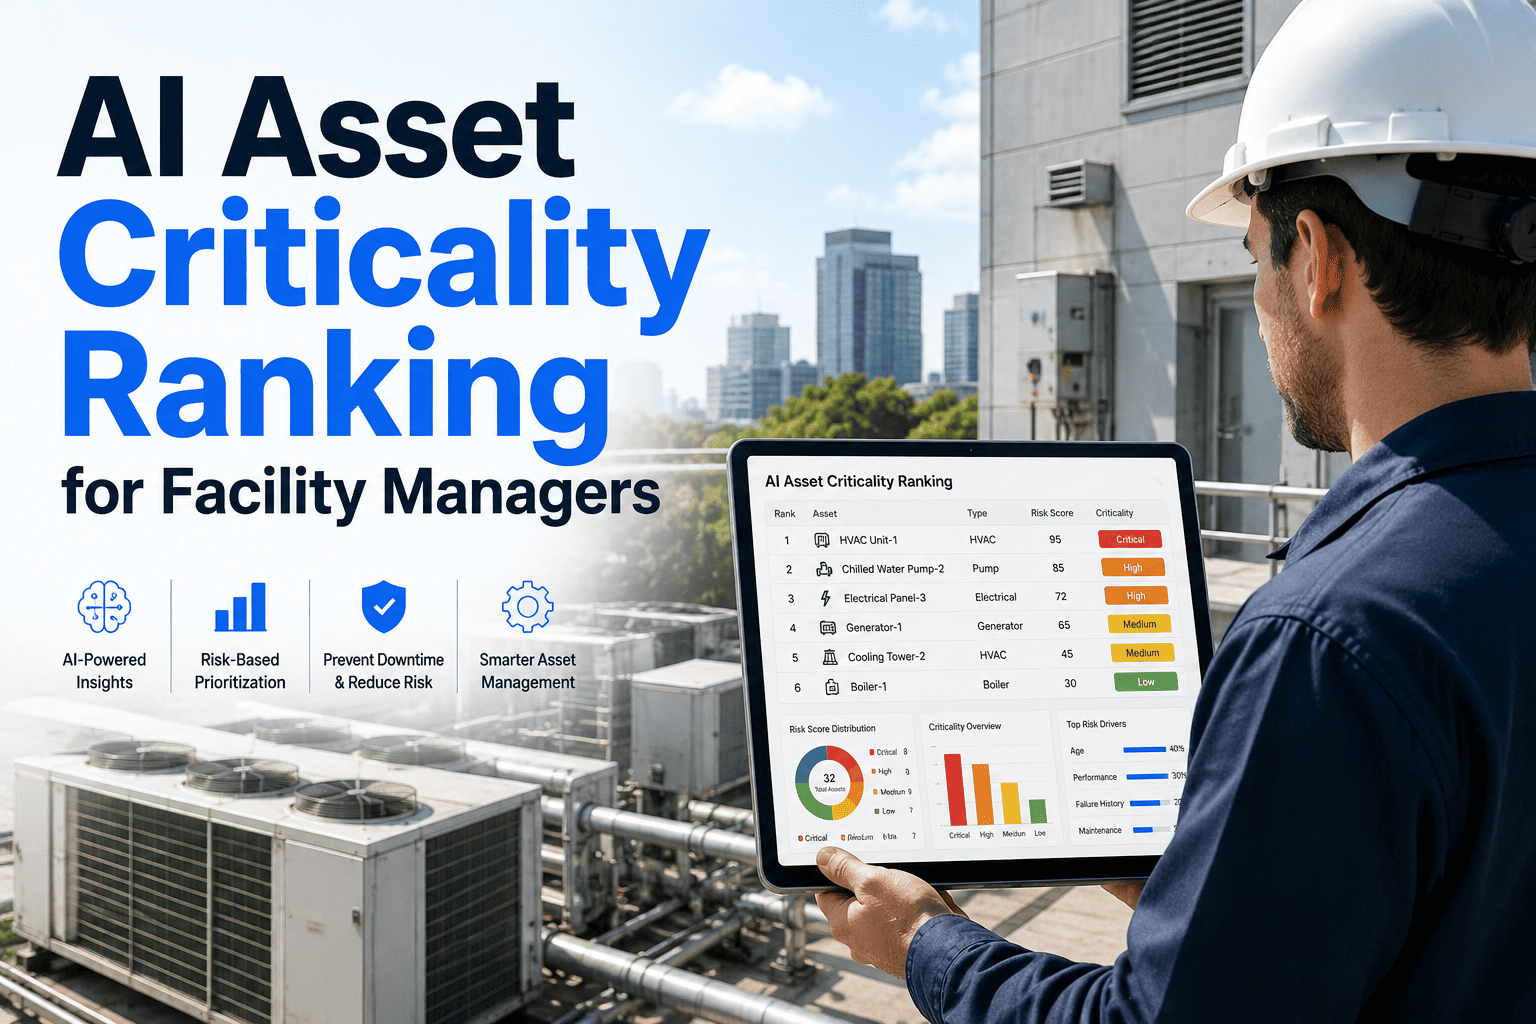
Carbon Emissions Tracking for Facility Management Teams
How forward-thinking facility teams are measuring Scope 1 and Scope 2 emissions from HVAC operations, maintenance activities, and asset performance — and turning that data into verified ESG reports.
Understanding Building Carbon Scope Boundaries
Facility carbon tracking must be structured around the three scope categories defined by the GHG Protocol — the global standard used by ISO 14064, ENERGY STAR, and corporate ESG frameworks. Most facility teams are responsible for Scope 1 and Scope 2 directly.
Natural gas combustion in boilers and HVAC systems, diesel generator fuel, refrigerant leaks from chiller and refrigeration systems, and on-site fleet vehicles used for maintenance operations.
Electricity purchased from the grid for lighting, HVAC, elevators, data systems, and building operations. Emissions factor depends on your regional grid's energy mix and is updated annually.
Contractor travel, embodied carbon in maintenance materials, waste generated from building operations, and tenant activities. Increasingly required under SEC and CSRD disclosure frameworks.
Where Facility Emissions Actually Come From
Understanding the emission breakdown by building system is the prerequisite for any credible reduction strategy. This distribution is based on ENERGY STAR and ASHRAE benchmarks for commercial buildings in temperate climates.
OxMaint automatically attributes carbon emissions to every maintenance activity, equipment runtime, and energy consumption event — generating Scope 1 and Scope 2 reports on demand, not on deadline.
How OxMaint Tracks Carbon Across Facility Operations
Carbon tracking in OxMaint is not a separate reporting module bolted onto maintenance — it is embedded into every work order, equipment record, and energy reading. Here is how the data flows from a maintenance event to a verified ESG output.
OxMaint connects to smart meters, BMS energy channels, and IoT submetering devices. Energy consumption is logged per asset in real time — not estimated at the building level. This granularity is required for credible Scope 2 asset-level accounting.
Every work order records the maintenance activity type, fuel or refrigerant consumed, and any materials used. Scope 1 events — boiler service, refrigerant top-up, generator testing — are automatically tagged and emission-calculated using current IPCC and EPA emission factors.
A chiller running 15% below optimal COP is not just an energy cost problem — it is an excess carbon problem. OxMaint flags equipment operating outside efficiency baselines and quantifies both the energy cost and the carbon penalty of deferred maintenance, building the business case for earlier intervention.
Reports in GHG Protocol, ISO 14064, and ENERGY STAR Portfolio Manager formats are generated in minutes — with full audit trails including timestamped work orders, technician signoff, and meter readings as supporting evidence. What once took 3–4 weeks of manual compilation is available on demand.
Carbon Reduction Potential by Maintenance Action
These are documented carbon reduction outcomes achievable through maintenance-driven interventions — not capital replacement. Each action below is schedulable as a PM work order in OxMaint.
| Maintenance Action | System Affected | Carbon Reduction Potential | Payback Period |
|---|---|---|---|
| Chiller tube cleaning and refrigerant optimization | HVAC cooling | 8–15% CO2e reduction | Under 3 months |
| Boiler tune-up — burner calibration and flue gas analysis | Heating | 5–12% CO2e reduction | 1–4 months |
| AHU filter and coil maintenance — restore design airflow | HVAC ventilation | 3–8% CO2e reduction | Immediate |
| Compressed air leak audit and repair | Compressed air | 20–30% system CO2e | Under 6 months |
| Building envelope inspection — seal air infiltration | HVAC load | 4–10% HVAC CO2e | 2–8 months |
| Generator PM — fuel efficiency optimization | Emergency power | 10–18% fuel CO2e | Under 2 months |
Expert Review
The most significant shift in facility sustainability management over the past three years is the recognition that maintenance quality is a carbon issue — not just a cost issue. A poorly maintained chiller consumes 18–25% more electricity per ton of cooling. That excess electricity consumption has a direct CO2 equivalent that belongs in Scope 2 disclosures. Similarly, a refrigerant leak that goes undetected for 60 days because there is no maintenance-triggered inspection schedule represents a Scope 1 emission event that was entirely preventable. What platforms like OxMaint make possible is the continuous link between maintenance execution quality and emission outcomes — something that is very difficult to achieve when ESG reporting is a separate annual exercise disconnected from day-to-day facility operations. Facility managers who understand this link are achieving genuine, verified emission reductions, not just reporting improvements.
Frequently Asked Questions
Your Building Is Emitting Carbon You Cannot Currently See
Every day without asset-level carbon tracking is a day where equipment inefficiency, refrigerant leaks, and deferred maintenance add unmeasured and unreported CO2 to your Scope 1 and Scope 2 accounts. OxMaint gives facility teams the real-time emissions visibility to reduce carbon and the audit-ready documentation to prove it. Book a demo and see your facility's carbon dashboard live.