Owners and asset managers ask the same question every budget season: are our operating costs in line with comparable Class A buildings? Benchmarking only works when costs are categorized consistently and normalized per square foot. This guide shows how to build a defensible maintenance cost benchmark, which metrics matter beyond a single number, and how a CMMS such as Oxmaint supplies the work order and asset data behind each figure.
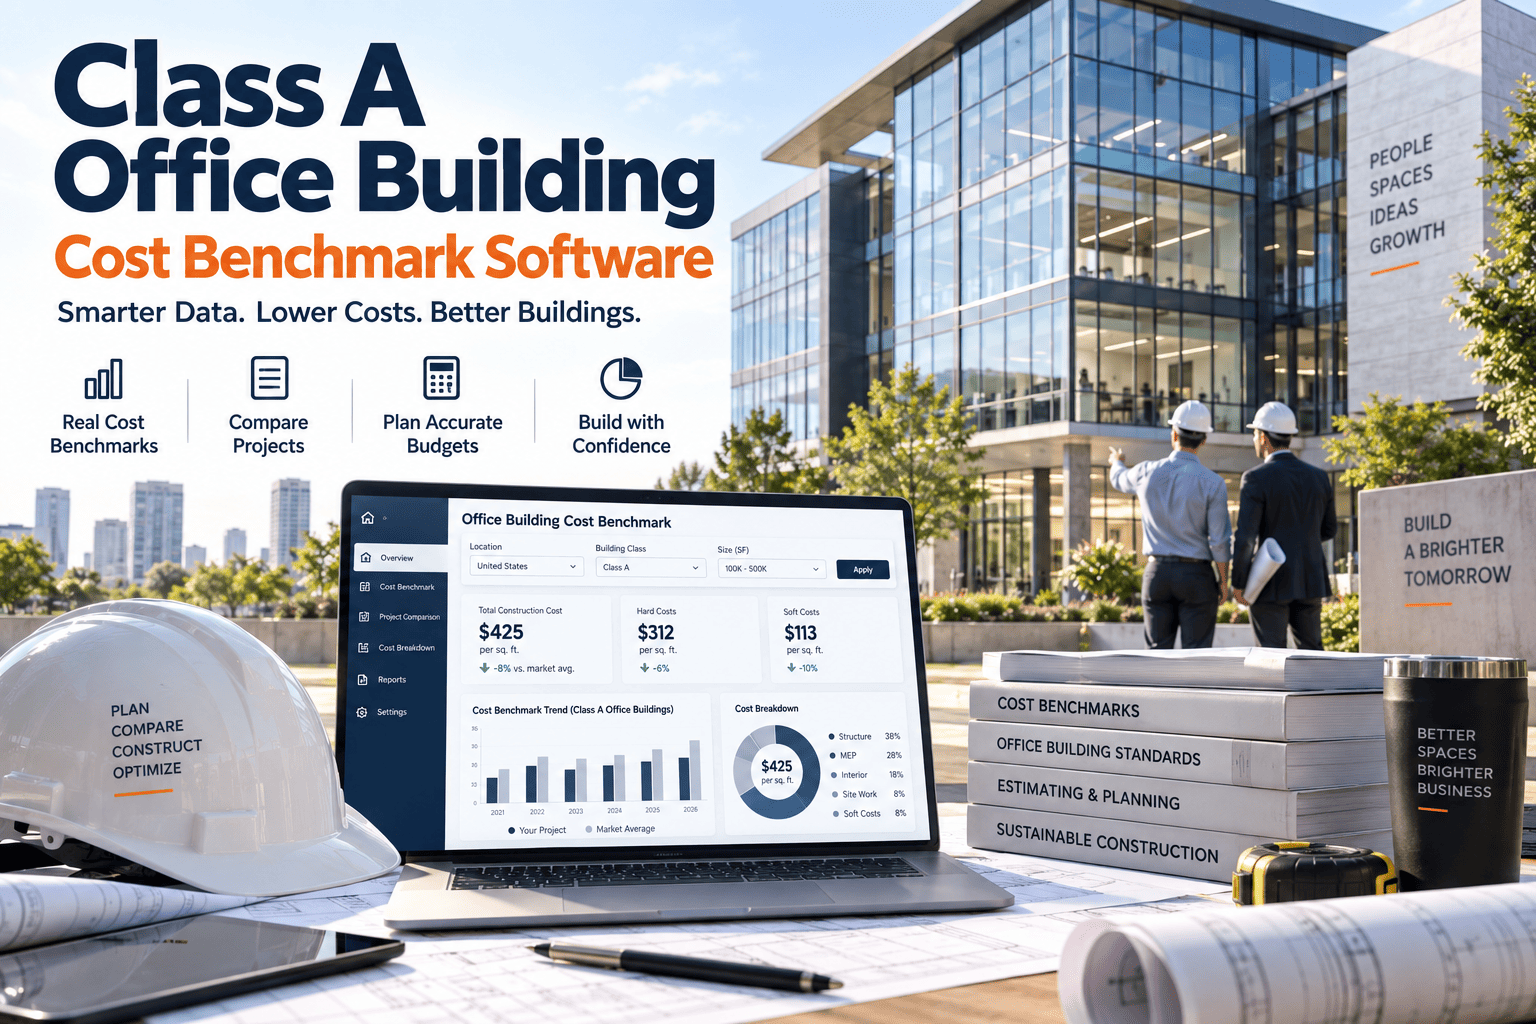
Class A Office Building Cost Benchmark Software: Turn Work Orders Into Cost per Square Foot
What Class A Means for Maintenance Cost
Building classes are market-relative. Class A generally describes the top tier of buildings in a given market, with strong locations, modern systems, quality finishes, and amenities that tenants expect to work every day.
The Cost per Square Foot Formula
The math is simple. The difficulty is agreeing on what goes into the numerator and which area goes into the denominator.
Rules that keep the number honest
- Choose one area basis, such as rentable area, and use it for every building you compare.
- Annualize partial years and state the period covered.
- Separate operating expense from capital projects so replacements do not distort repair costs.
- Decide whether janitorial, security, and utilities are in scope, and keep them consistent.
- Record who performed the work: in-house staff, service contractors, or emergency vendors.
Cost Categories to Track by System
Organizations such as BOMA publish standard office building income and expense categories through the BOMA Experience Exchange Report. Mapping your work orders to a similar category list makes comparison far easier.
| Category | What to capture | Where the data comes from |
|---|---|---|
| HVAC and central plant | Chillers, boilers, air handlers, controls, and filters | Asset records, PM work orders, contractor invoices |
| Elevators and escalators | Service contract, callbacks, and repairs | Contract records and corrective work orders |
| Electrical and lighting | Panels, generators, UPS, lamps, and emergency lighting | Inspection results and parts issued |
| Plumbing and water | Pumps, backflow devices, restrooms, and leaks | Reactive work orders and inspection logs |
| Fire and life safety | Alarm, sprinkler, extinguisher, and egress systems | Compliance schedules and test records |
| Building envelope and roofing | Facade, glazing, sealants, and roof repairs | Inspection findings and repair jobs |
| Tenant service requests | Hot and cold calls, lighting, and minor repairs | Request work orders with response and close times |
Get the Cost Data Behind Your Benchmark
Where Benchmark Data Comes From
| Source | Strength | Limitation |
|---|---|---|
| BOMA Experience Exchange Report | Detailed income and expense categories by building type and market | Depends on participation and consistent category mapping |
| Brokerage research reports | Market context and operating expense trends | Usually summarized, with less category detail |
| Your own portfolio | Same reporting rules and management practices | Reflects your habits, so outliers can go unnoticed |
| Lease and CAM audits | Shows what tenants actually pay and question | Focused on recoverable costs only |
Treat any published range as a reference point, not a target. Market, building age, and scope change what a good number looks like.
Normalize Before You Compare
Raw comparison
- Different area bases
- Capital work mixed with repairs
- Janitorial counted in one building only
- Half-year data compared with full-year data
Normalized comparison
- One agreed area basis
- Repairs separated from capital
- Same scope in every building
- Twelve-month periods for all
Adjustments to consider
- Building age and remaining life of major systems
- Occupancy and hours of operation
- Climate and utility rates
- Union labor or prevailing wage requirements
- Service contract structure compared with in-house staffing
- Amenities such as fitness centers or data rooms
Metrics Beyond Cost per Square Foot
A single cost figure hides how the money was spent. Pair it with operational metrics that explain the cause.
Why Costs Drift Upward
Rising maintenance cost per square foot is usually a chain reaction rather than a single event.
From Benchmark to Action in 90 Days
- Load assets and areas
- Map costs to categories
- Capture twelve months of history
- Compare against chosen sources
- Investigate largest variances
- Rank causes by cost impact
- Shift spend toward planned work
- Review contract scope and pricing
- Set targets and monthly reporting
Operating Expense Recovery and Tenant Questions
Lease structure affects which costs can be recovered. Full-service and triple-net leases treat maintenance costs differently, so review your lease terms with your advisors.
- Keep work order records that show what was done, where, and when.
- Separate common area costs from tenant-specific work.
- Maintain invoices and contractor scopes for reconciliation.
- Prepare a clear explanation for year-over-year variances.
How Oxmaint Supplies the Data
Building a Clean Asset and Area Register
Benchmarking falls apart when the building data is inconsistent. The register behind your work orders should let you filter cost by any dimension an owner might ask about.
- Store gross, rentable, and usable area for every building, with the measurement standard noted.
- Assign every asset to a building, floor, and system so costs roll up without manual sorting.
- Record installation date, expected life, and replacement value where known.
- Flag amenity spaces and tenant-specific areas so they can be included or excluded from comparisons.
- Keep contract assets, such as elevators and chillers under service agreements, linked to the vendor and contract term.
Reading a Variance Against Peers
A cost above or below a comparison group is a question, not a verdict. Use the table to decide which data to check first.
| Observation | Possible cause | Data to check |
|---|---|---|
| Cost above peers | Aging systems, high reactive share, or premium vendor pricing | Reactive ratio, repeat repairs, contract rates |
| Cost below peers | Deferred maintenance or lower service scope | PM completion, overdue tasks, asset condition |
| Sudden spike in one category | Major failure or a one-time project miscoded as repair | Largest work orders and invoices in the period |
| Rising trend over several years | Aging assets or growing tenant demand | Cost per asset age band, request volume |
| Wide gap between buildings | Different scope, staffing, or coding habits | Category mapping and area basis |
Planned Versus Reactive Maintenance Cost
Emergency work costs more per task because it involves overtime, expedited parts, premium vendor rates, and often secondary damage. Tracking the ratio explains a large part of any cost gap.
Reactive-heavy building
- Repairs arrive without warning
- Overtime and call-out fees rise
- Tenants notice comfort problems
- Budgets are hard to forecast
Planned-heavy building
- Work is scheduled around tenants
- Parts are ordered in advance
- Problems are found during inspections
- Spend is easier to predict
Reporting Cadence for Owners and Asset Managers
| Audience | Report focus | Suggested frequency |
|---|---|---|
| Chief engineer | Open work orders, overdue PMs, and parts shortages | Daily and weekly |
| Property manager | Tenant request performance and cost by category | Monthly |
| Asset manager | Cost per square foot, variances, and forecast | Monthly and quarterly |
| Owner or investor | Benchmark comparison, capital needs, and risk items | Quarterly and annually |
Energy and Sustainability Context
Maintenance and energy performance are closely linked, because poorly maintained HVAC and controls waste energy. Class A owners increasingly report both together.
- ENERGY STAR Portfolio Manager is widely used to track energy use intensity and scores.
- Some cities apply building performance standards, such as New York City's Local Law 97, that set limits on emissions for large buildings.
- Preventive tasks such as filter changes, coil cleaning, and control calibration help protect efficiency.
- Record energy-related work orders so savings and costs can be discussed together.
Linking the benchmark to capital planning
- Use repair history by asset to show when repair spend approaches replacement cost.
- Flag assets with repeated failures for the capital plan.
- Show owners the maintenance cost avoided by replacing systems at the right time.
Tenant Experience and Its Link to Maintenance Cost
Class A tenants judge a building by comfort, reliability, and response. Maintenance data helps show where service quality and cost are moving together or apart.
- Track how many requests relate to temperature, lighting, and elevators, since these are the most visible to occupants.
- Measure time to acknowledge and time to complete for each request category.
- Look for buildings where high request volume follows deferred preventive work.
- Share performance summaries with property management before lease renewal discussions.
Benchmarking Vendor Contracts and Rates
Contract spend is often the largest part of repairs and maintenance, so it deserves its own review.
Scope
- What is included in the base fee
- Which repairs bill separately
- Response time commitments
Performance
- Callbacks per asset
- Time to arrive and to complete
- Repeat visits for the same fault
Price
- Hourly and after-hours rates
- Parts markup terms
- Renewal and escalation clauses
Data Quality Checklist Before You Report
- Every work order has an asset, a building, and a category.
- Labor hours and parts are entered before a work order is closed.
- Contractor invoices are linked to the matching work order or contract.
- Capital projects are tagged separately from repairs.
- Duplicate and cancelled work orders are excluded from totals.
- Area figures are reviewed annually and after any tenant reconfiguration.
Budget Season Playbook
Common Benchmarking Pitfalls
- Comparing to a single published number without checking scope and definitions.
- Assuming the lowest cost is the best result when it may reflect deferred work.
- Allowing category codes to drift between buildings and years.
- Ignoring occupancy and hours of operation when comparing utilities-related work.
- Presenting cost without the operational data that explains it.
Choosing the Right Benchmark Question
Different stakeholders ask different questions, and each needs its own comparison. Decide the question first, then choose the data.
| Question | Best comparison | Key caution |
|---|---|---|
| Are we spending too much on repairs? | Cost per rentable square foot against similar buildings in the same market | Confirm scope and category definitions match |
| Are we maintaining assets well? | Planned share, PM completion, and repeat failures | Low cost may signal deferred work |
| Are tenants well served? | Response and close times by request type | Measure from the same start and end points |
| Which building needs attention first? | Trend by building against its own history | Adjust for occupancy and age |
A note on published ranges
- Published dollar ranges change every year and differ by market, so cite the source and year each time.
- Use ranges to frame questions, and use your own work order data to find answers.
- Avoid quoting a benchmark to tenants or lenders unless you can explain how it was built.