Hospital facility directors are asked to defend cost per square foot every budget cycle, but most benchmark that number against ASHE or IFHE survey averages that are already a year old by the time they publish. The real comparison a CFO wants is how this quarter's utilities, maintenance labor, and capital spend stack up against peer facilities of the same bed count and climate zone, in real time. Without a live data source, facility teams spend weeks pulling numbers from utility bills, work order systems, and finance exports just to build one benchmark slide. A CMMS that already tracks every asset, work order, and meter reading can generate that comparison as a byproduct of daily operations instead of a special project. Book a demo to see your facility's live cost per square foot benchmarked against peer hospitals.
Healthcare Facility Benchmarking
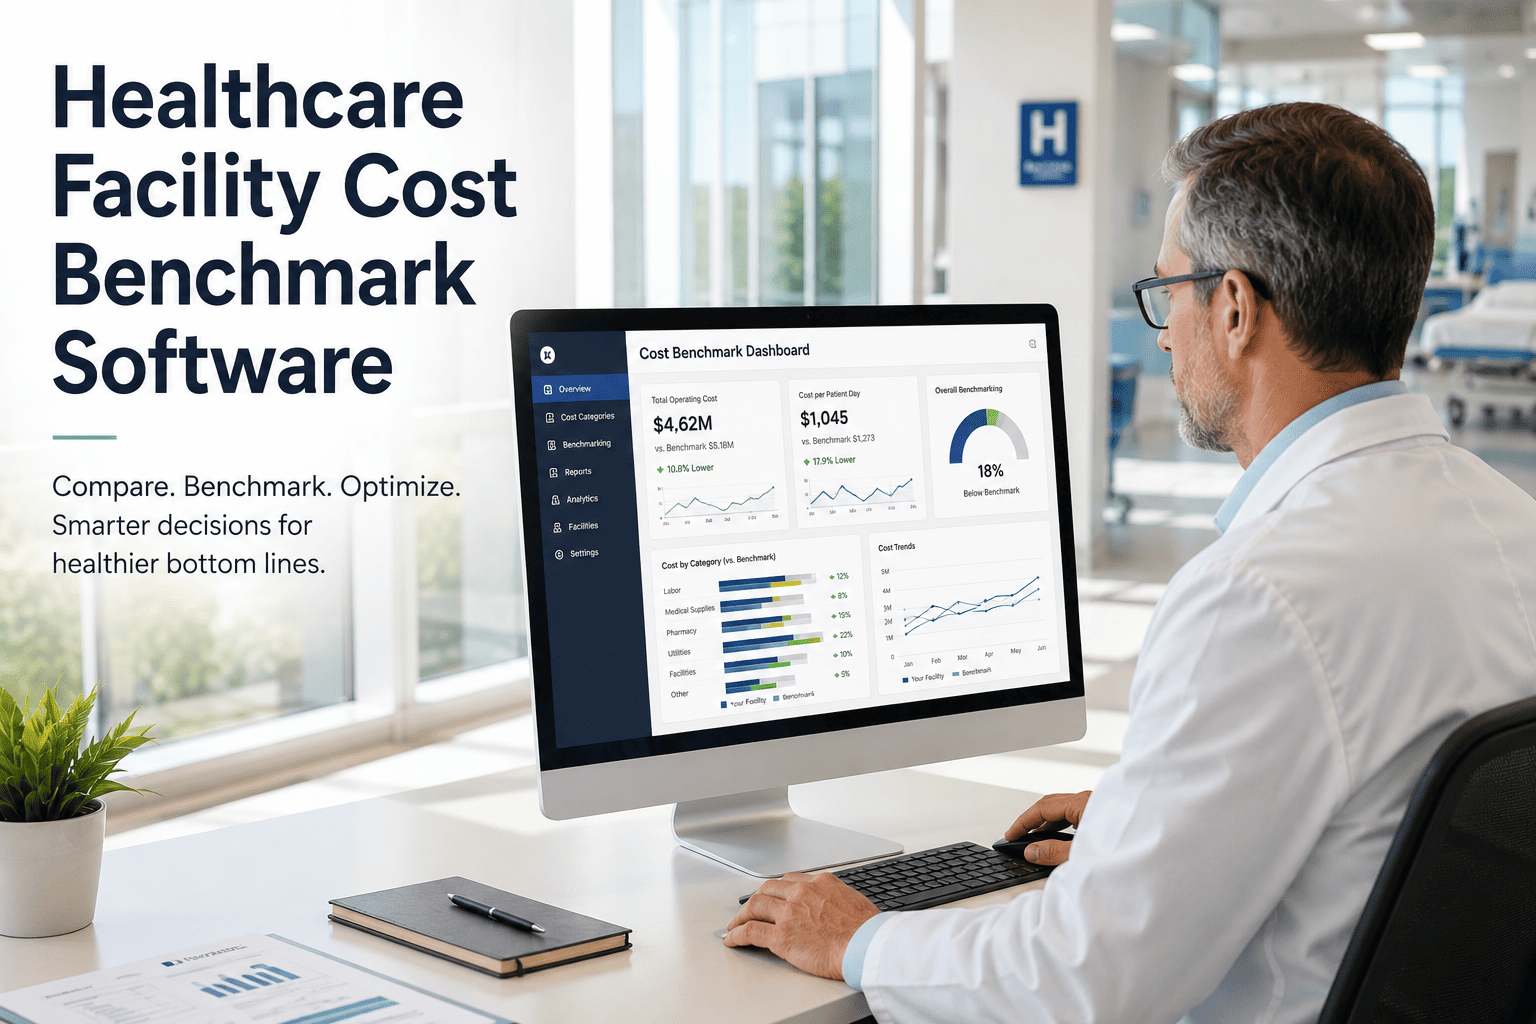
How does your cost per square foot compare to peer hospitals this quarter?
OxMaint pulls utilities, labor, and maintenance spend directly from your live facility data and benchmarks it against ASHE and IFHE peer categories — no export, no spreadsheet, no waiting for the annual survey.
Cost Breakdown
Where hospital facility cost per square foot actually goes
Across a typical acute-care hospital, four categories account for nearly all facility operating cost. Seeing the split helps directors know which line item to benchmark first when costs drift above peer median.
The Benchmark Gap
Why annual benchmark surveys fall behind
Benchmark Checklist
What a real-time healthcare facility benchmark needs to track
- Energy consumption normalized by square foot and bed count
- Water usage against department-level fixtures
- Peak demand charges by building and meter
- Labor hours per work order by department
- Preventive versus reactive maintenance ratio
- Contractor spend against in-house labor cost
- Asset age and remaining useful life by category
- Replacement cost forecast against depreciation
- Deferred maintenance backlog value
Root Causes
What causes cost per square foot to drift between sites
Multi-site health systems rarely have one cost problem — they have several small ones hiding inside a single blended average. These are the three drivers that show up most often once data is broken out by building.
- Chillers and air handlers running past efficient service life
- Reactive repairs replacing preventive maintenance on older assets
- Energy use climbing quietly before a failure forces a capital request
- Contractor spend rising to cover open in-house technician roles
- Overtime hours absorbing preventable equipment downtime
- Work order backlog growing faster than reported labor hours
- Older wings compared against a hospital-wide average that hides them
- Renovated floors skewing the blended cost per square foot down
- Capital plans built on average cost instead of building-level cost
Product Fit
How OxMaint builds your benchmark from live facility data
Each of these capabilities feeds the benchmark automatically, so the report reflects what is happening on your campus this month rather than last year's survey.
Meter and Utility Integration
Energy and water meters feed time-series data straight into the benchmark, tagged to building and department automatically.
Work Order Cost Tracking
Labor hours, contractor invoices, and parts cost roll up against each closed work order, split by building and asset category.
Capital Planning View
Asset age, remaining useful life, and replacement cost are tracked against the deferred maintenance backlog for every building.
Building-Level Breakdown
Every benchmark figure can be filtered down to a single wing or floor, so cost drift is visible before it reaches the annual average.
Live Instead Of Annual
Stop waiting for next year's benchmark survey
OxMaint updates your cost-per-square-foot position every time a work order closes or a meter reading lands, so your benchmark reflects this quarter, not last year.
Mini Case Study
A 410-bed hospital found a 22% utility overspend hiding in one wing
The facility team benchmarked cost per square foot once a year using the prior year's ASHE survey, comparing hospital-wide averages that masked which wing was actually driving cost. Their east tower had run 22% above median energy cost per square foot for two years before anyone noticed.
With live meter and work order data broken out by building, the team spotted the east tower overspend within one reporting cycle, traced it to an aging chiller, and brought that wing back to peer-median cost per square foot within four months.
Benchmark Categories
ASHE and IFHE-aligned benchmark categories OxMaint tracks
| Benchmark Category | Peer Comparison Basis | Data Source in OxMaint |
|---|---|---|
| Cost per square foot | Bed count, climate zone, building age | Work order cost plus utility spend by building |
| Energy use intensity | Facility type and regional peer group | Time-series meter data by asset and building |
| Maintenance labor ratio | Bed count and staffing model | Technician hours logged per closed work order |
| Deferred maintenance | Asset age and replacement value | Asset registry cross-referenced with backlog value |
FAQ
Healthcare facility benchmark software: common questions
What is a good cost per square foot for a hospital facility?
It varies widely by climate zone, building age, and bed count, which is why comparing against a hospital-wide average is often misleading. Book a demo to see your peer-adjusted figure.
How is this different from the ASHE annual benchmark survey?
The ASHE survey is a valuable annual reference point, but it is typically over a year old by publication. OxMaint benchmarks your live operational data continuously against the same category structure.
Can benchmark data be broken out by building or wing?
Yes — utility, labor, and capital data can be filtered down to a single building, floor, or department, which is usually where cost overruns actually originate. Start a free trial to test it on your campus.
Does this replace our finance system's cost reporting?
No — OxMaint benchmarks operational facility cost drivers like utilities, labor, and maintenance, which finance teams then reconcile against the general ledger for full cost reporting.
How quickly can a hospital get its first benchmark report?
Most facilities generate a first benchmark view within the first billing and maintenance cycle after connecting meters and work order history. Book a demo to see a sample report first.
Know Your Number, Every Quarter
Turn facility cost benchmarking into a live number, not an annual project
Join hospital facility teams using OxMaint to track cost per square foot, energy use intensity, and maintenance ratios against peer hospitals in real time.
Free 14-day trial. No credit card required.