Facility teams managing buildings without real-time KPI visibility are flying blind — reacting to failures instead of preventing them. A structured analytics dashboard built on a CMMS transforms scattered maintenance data into actionable intelligence, helping operations leaders track MTBF, MTTR, SLA compliance, and asset uptime from a single screen. This guide breaks down the exact KPIs that matter and how leading facility teams are using them to cut costs and boost performance.
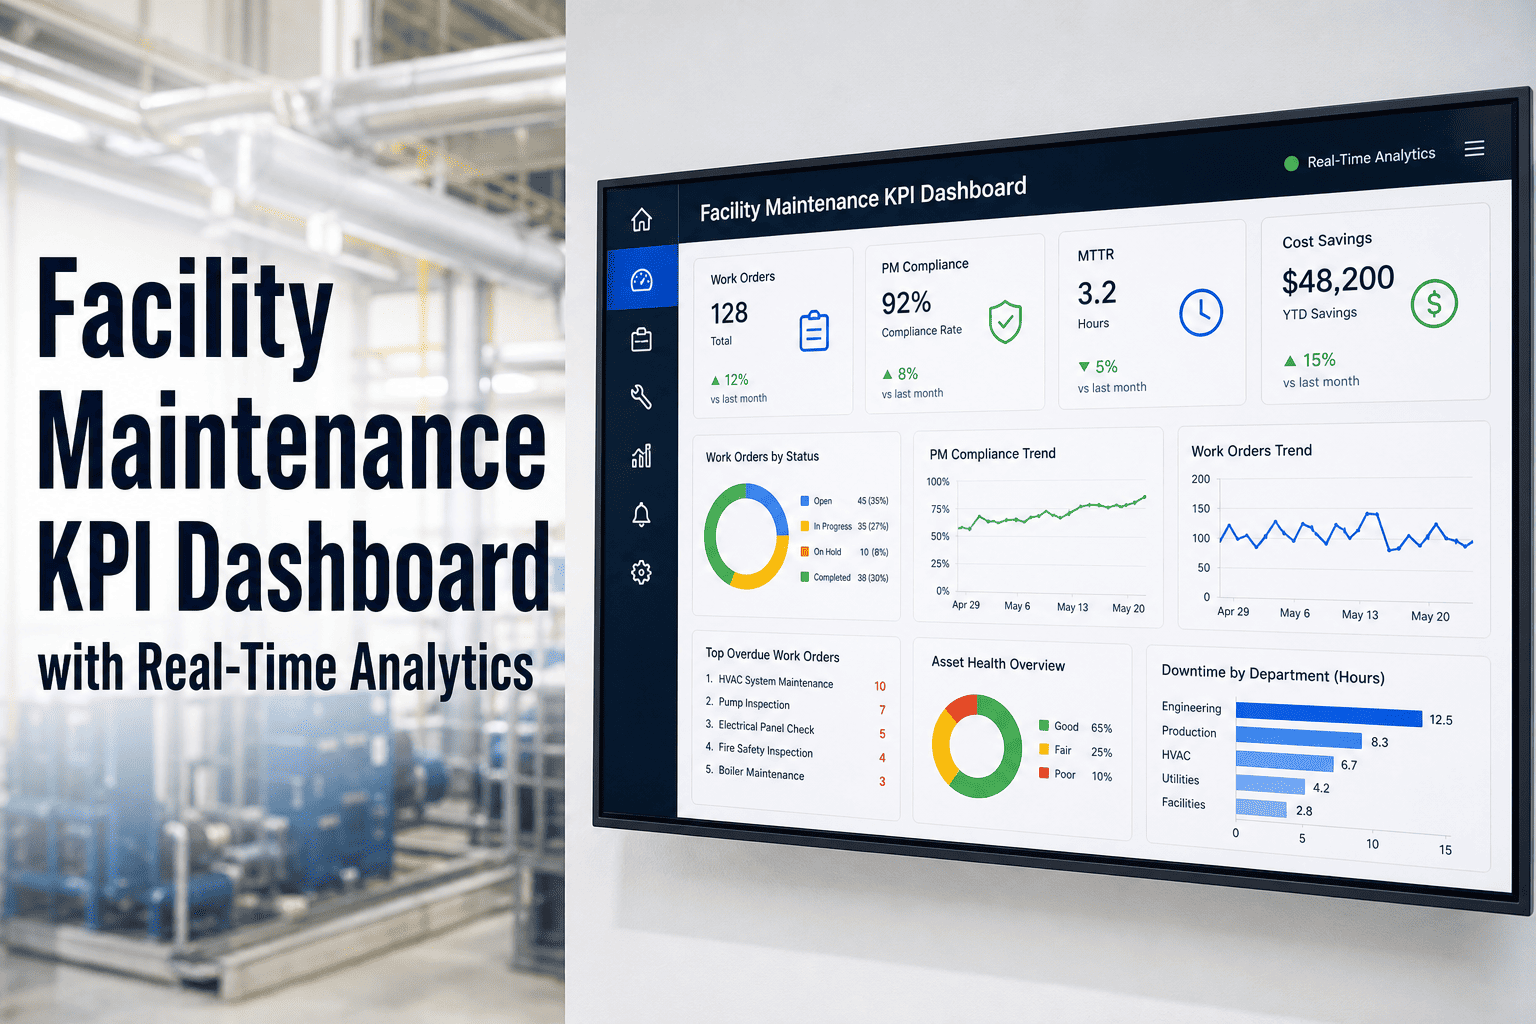
Facility Maintenance KPI Dashboard
with Real-Time Analytics
Track MTBF, MTTR, uptime, SLA compliance, backlog, and maintenance costs — all in one live dashboard. Here is how top facility teams do it.
Why Most Facility Teams Struggle with KPI Visibility
Maintenance data lives in spreadsheets, email threads, and technician notebooks — none of which talk to each other. When leadership asks "what is our equipment uptime this month?" the answer takes days, not seconds. Without a live KPI dashboard, facility managers can not identify trends, justify budgets, or prove SLA compliance to tenants and stakeholders.
No Baseline Metrics
Teams can not improve what they do not measure. Without MTBF and MTTR baselines, every failure feels like a surprise.
Delayed Reporting
Monthly PDF reports arrive too late to act on. Problems compound before they surface in management reviews.
Hidden Backlog Costs
Deferred maintenance accumulates silently until a capital crisis hits. No dashboard means no early warning system.
SLA Blind Spots
Without real-time SLA tracking, compliance breaches are discovered after tenants complain, not before.
KPIs Every Facility Dashboard Must Track
These six metrics are the industry standard for facility performance measurement. Track them live and your team shifts from reactive chaos to structured control.
| KPI | What It Measures | Target Benchmark | Risk if Ignored |
|---|---|---|---|
| MTBF | Average time between equipment failures | > 720 hrs for critical assets | Unplanned downtime spikes |
| MTTR | Average time to restore equipment after failure | < 4 hrs for Tier-1 systems | SLA breaches, tenant complaints |
| Asset Uptime | Percentage of scheduled operating time assets are running | > 95% for critical systems | Revenue and productivity loss |
| SLA Compliance | Work orders resolved within contracted response windows | > 98% for P1 tickets | Penalty clauses, contract risk |
| Backlog Ratio | Open work orders vs capacity — aging over 30 days | < 10% of total WO volume | Deferred maintenance cost surge |
| Cost per WO | Total maintenance spend divided by work orders closed | Trending down YoY | Budget overruns, no accountability |
Benchmarks based on BOMA International standards and Oxmaint facility customer averages across commercial real estate and institutional buildings.
What a Real-Time Facility KPI Dashboard Looks Like
A well-built CMMS dashboard layers three tiers of visibility — strategic, operational, and asset-level — so executives and technicians both get exactly what they need without navigating through irrelevant data.
Executive View
- Overall uptime percentage
- SLA compliance rate
- Monthly maintenance spend vs budget
- Backlog trend (30 / 60 / 90 day)
Operations Manager View
- Open work orders by priority
- Technician utilisation rate
- Planned vs reactive maintenance ratio
- MTTR by asset category
Technician View
- Assigned work orders with SLA countdown
- Asset service history on mobile
- Parts availability status
- PM schedule for the day
See Your Facility KPIs Live in Oxmaint
MTBF, MTTR, SLA compliance, backlog, and cost analytics — configured for your building portfolio in one dashboard.
The Financial Case for Real-Time Analytics
What Industry Leaders Say
Frequently Asked Questions
Ready to Put Your Facility KPIs on a Live Dashboard?
Stop guessing. Start tracking MTBF, MTTR, SLA compliance, and maintenance costs in real time — built for facility teams of any size.