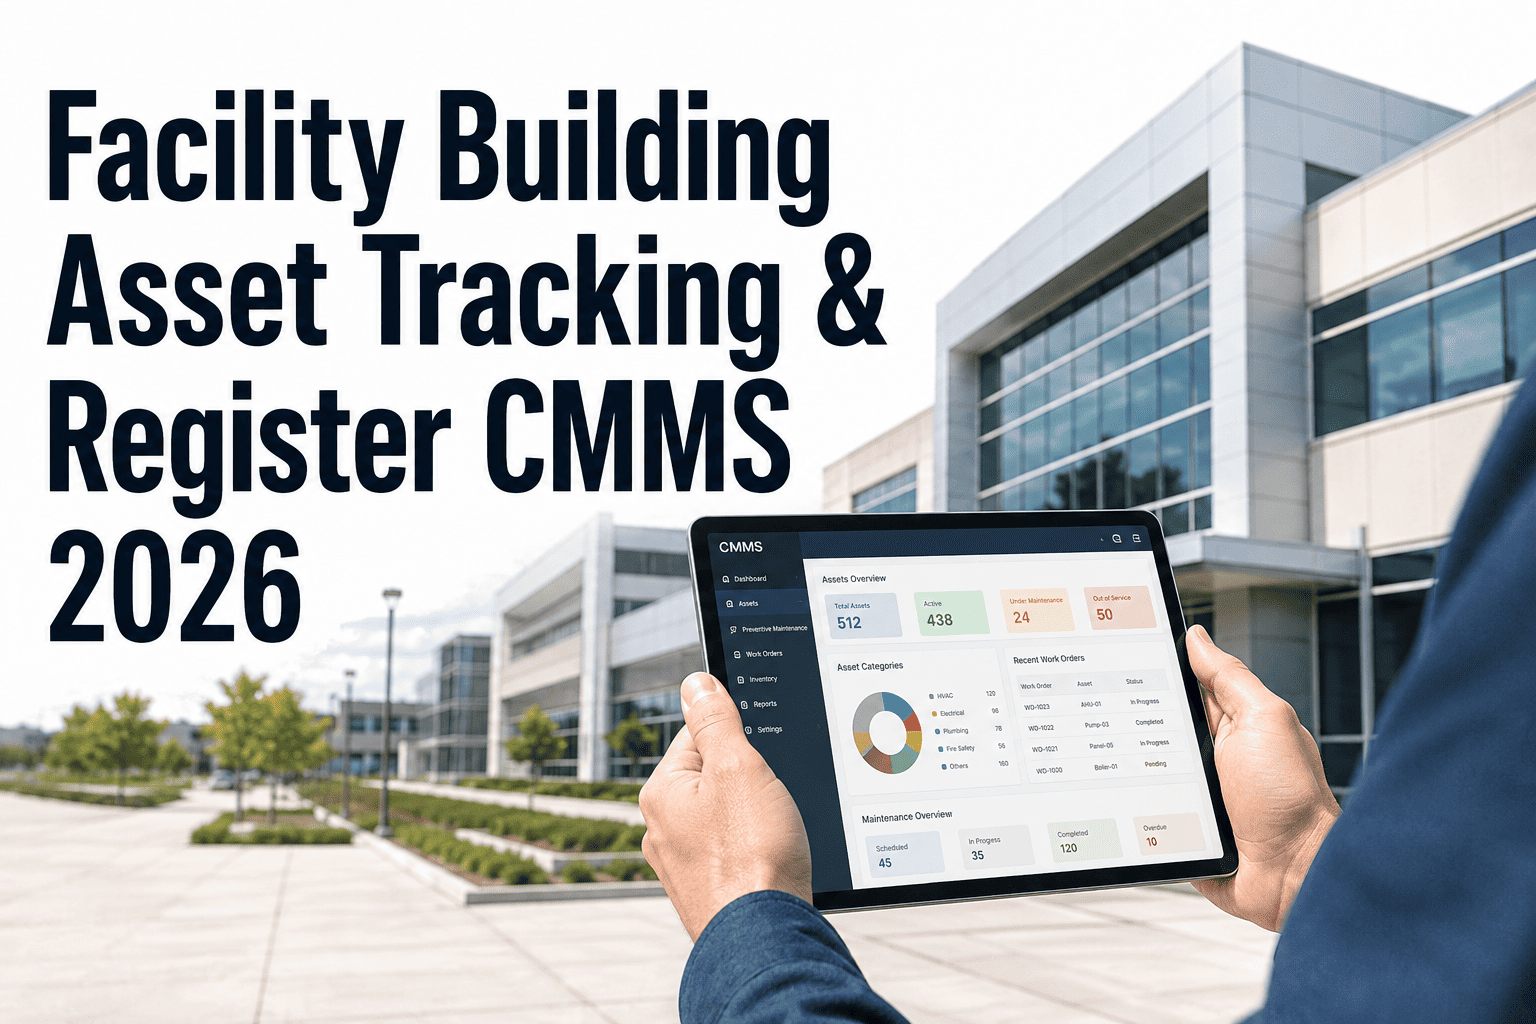
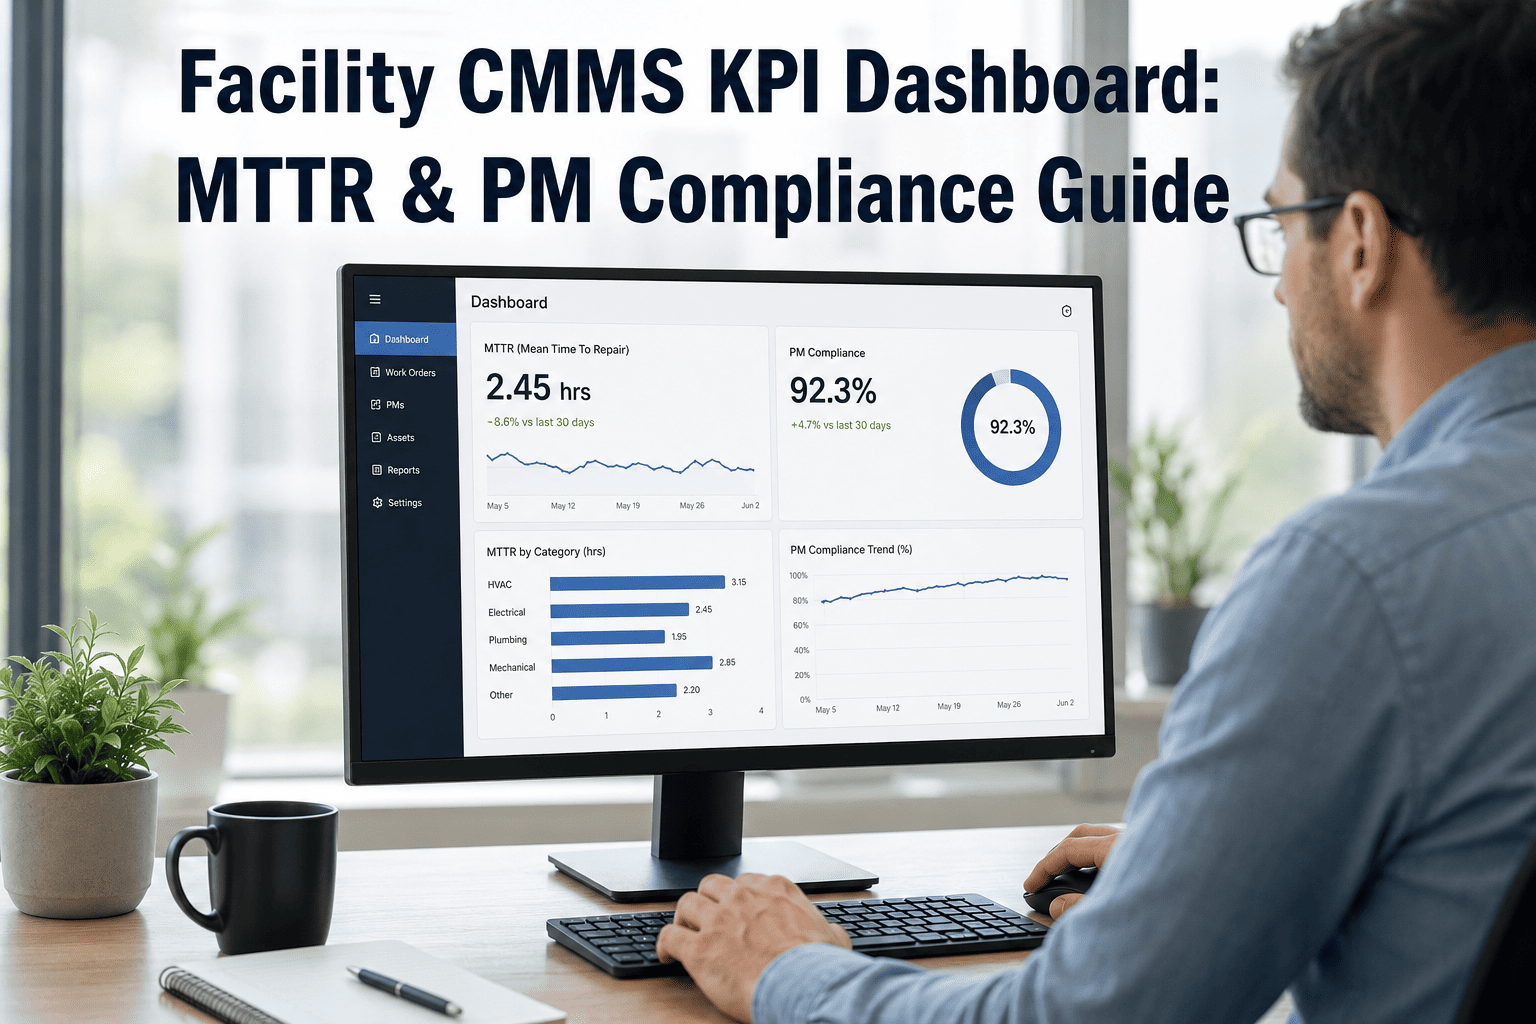
Facility maintenance teams spend thousands annually on emergency repairs, unplanned downtime, and reactive work — costs that a structured CMMS platform like OxMaint can dramatically reduce through preventive scheduling, asset tracking, and automated reporting. If your team still relies on spreadsheets or paper-based logs, calculating the true cost of your current process is the first step toward justifying a modern solution. This ROI calculator-style guide breaks down exactly where facilities lose money — from inflated MTTR to poor PM compliance — and shows how OxMaint's analytics and reporting suite turns maintenance data into measurable financial outcomes. Whether you manage a single building or a multi-site portfolio, the numbers below will help you build a credible business case. Use this guide alongside a live demo to see real-time ROI estimates for your specific facility.
Facility Maintenance · Analytics & Reporting · ROI Analysis
How Much Is Reactive Maintenance Really Costing You?
Facilities that switch from reactive to planned maintenance cut emergency repair costs by 25–30%. Here's how to calculate your savings potential with OxMaint.
25%Lower Emergency Repair Costs
40%Faster MTTR with CMMS
3xLonger Average Asset Life
80%PM Compliance Improvement
Where Facilities Bleed Money
The 5 Hidden Cost Drivers in Unmanaged Maintenance
01
Emergency Repair Premium
Emergency work orders cost 3–5x more than planned PMs due to overtime labor, expedited parts, and contractor markups. Facilities averaging 40% reactive work spend nearly double what planned-maintenance peers do per asset annually.
Avg. impact: $18,000–$95,000/yr
02
Unplanned Downtime
For commercial and industrial facilities, each hour of critical system downtime can cost $5,000–$50,000 in lost productivity, tenant credits, SLA penalties, and emergency vendor calls. MTTR tracking is the first step toward eliminating it.
Avg. impact: $12,000–$60,000/yr
03
Poor PM Compliance
When preventive tasks are missed or delayed, equipment degrades faster, warranty coverage lapses, and asset replacement cycles shorten by 20–35%. Most facilities without CMMS software run at 55–65% PM compliance — far below the 85%+ benchmark.
Avg. impact: $22,000–$110,000/yr
04
Slow Response Times
Manual dispatch and phone-based request handling add 45–90 minutes to average response times. Faster response directly reduces secondary damage, tenant dissatisfaction, and SLA breach penalties — all of which carry real dollar costs.
Avg. impact: $8,000–$40,000/yr
05
Premature Asset Replacement
Without lifecycle data, facility managers replace equipment 3–7 years earlier than necessary. Tracked assets with consistent PM history have provably longer usable lives — and higher resale or disposal value at end of life.
Avg. impact: $30,000–$200,000/yr
See Your Facility's ROI in 30 Minutes
Book a personalized demo and our team will run through a live ROI estimate based on your facility size, asset count, and current maintenance process.
ROI Breakdown
Facility Maintenance ROI: By the Numbers
The table below models ROI outcomes across small, mid-size, and large facility portfolios. These figures are based on industry benchmarks from APPA, BOMA, and independent CMMS adoption studies.
| Facility Size |
Annual Reactive Cost (Before) |
CMMS Investment/yr |
Savings on PM Compliance |
MTTR Reduction Value |
Net Annual ROI |
Payback Period |
| Small (<50 assets) |
$48,000 |
$3,600 |
$9,200 |
$6,400 |
$12,000+ |
3.6 months |
| Mid-Size (50–250 assets) |
$185,000 |
$9,600 |
$38,000 |
$22,000 |
$50,400+ |
2.3 months |
| Large (250–1000 assets) |
$620,000 |
$24,000 |
$140,000 |
$78,000 |
$194,000+ |
1.5 months |
| Enterprise (1000+ assets) |
$1,800,000+ |
$60,000+ |
$380,000 |
$210,000 |
$530,000+ |
<1 month |
KPI Metrics
Key Maintenance KPIs OxMaint Tracks Automatically
MTTR
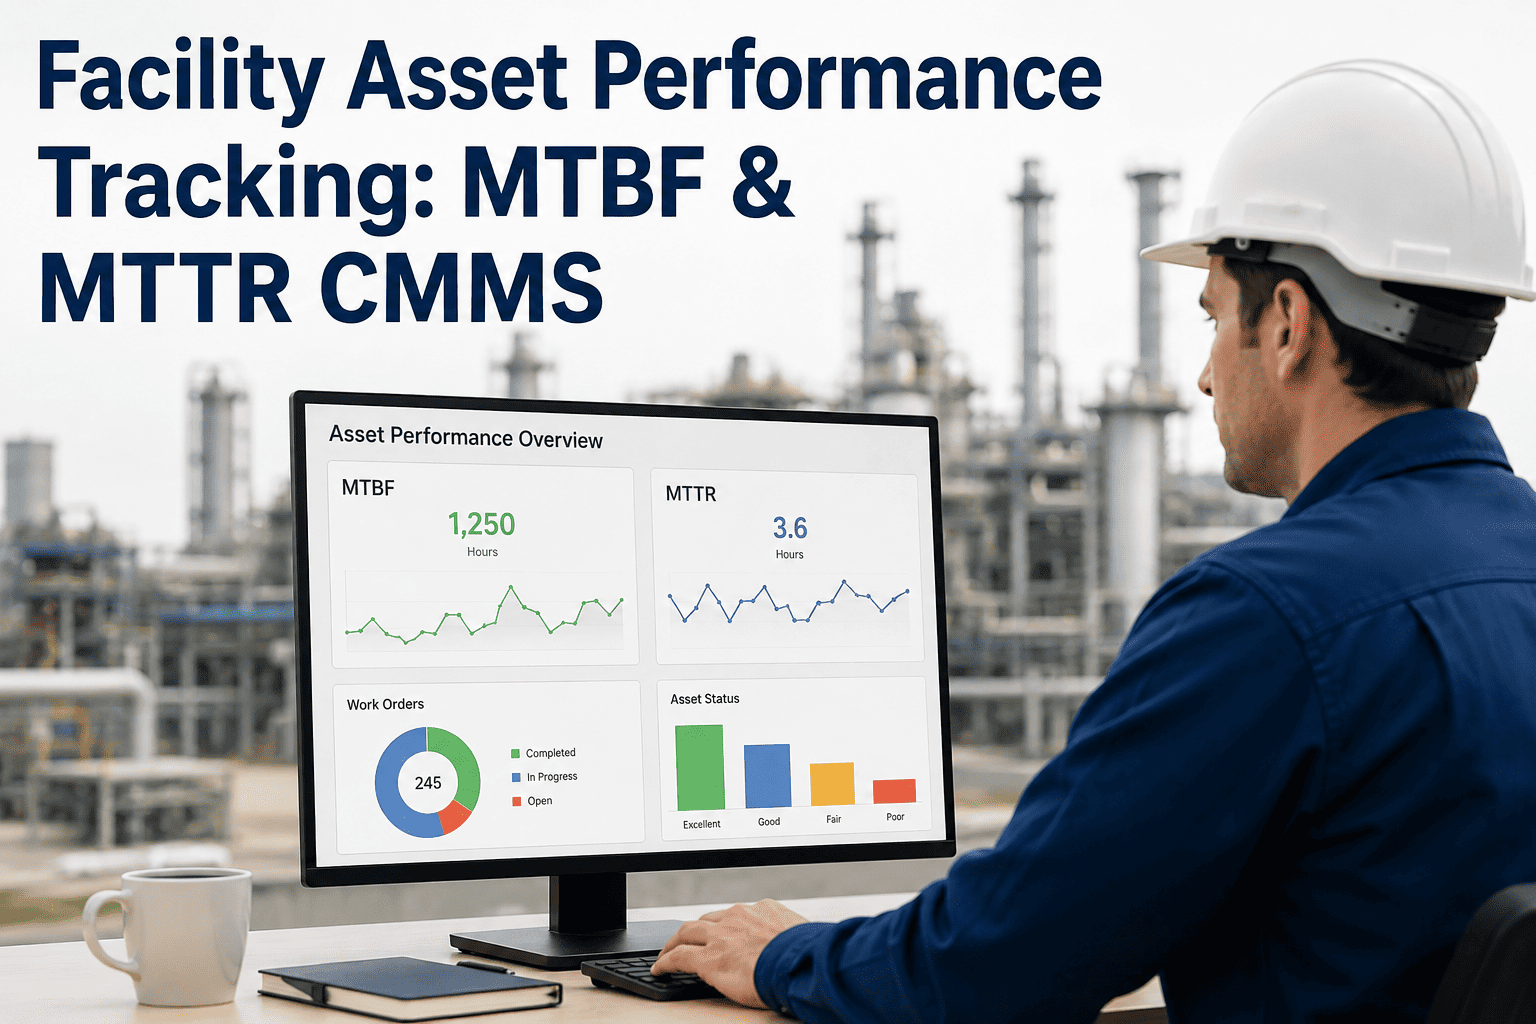
Mean Time to Repair — tracks how fast your team resolves work orders, identifies bottlenecks, and surfaces response time trends by asset type or location.
MTBF
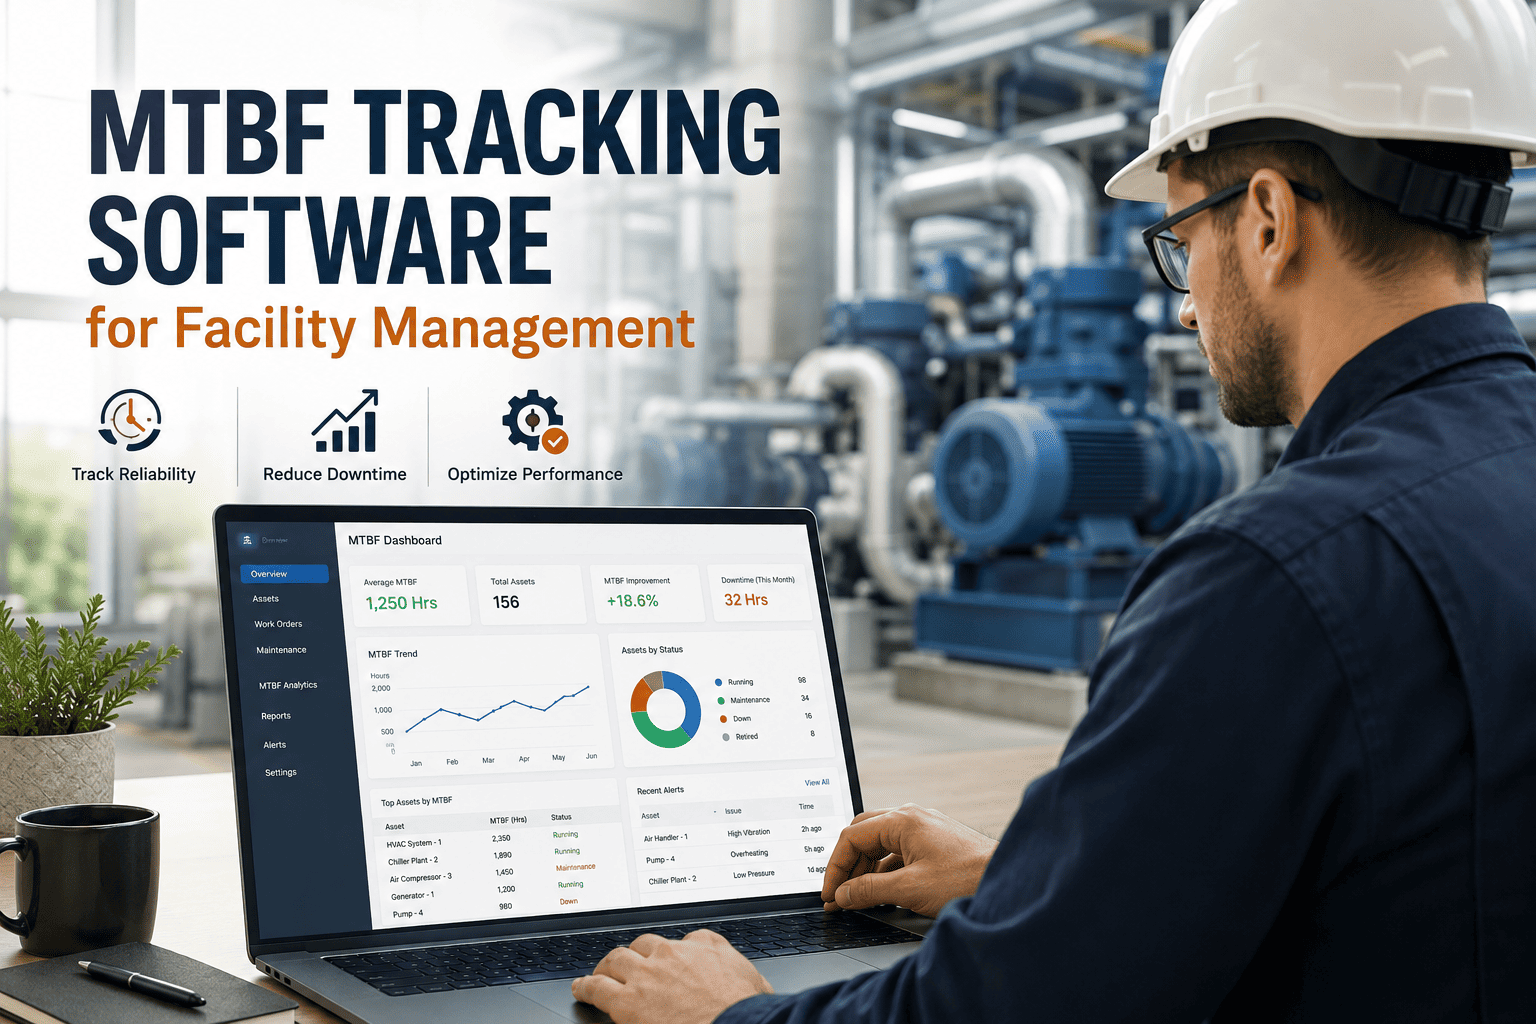
Mean Time Between Failures — helps predict equipment health, set optimal PM intervals, and justify capital replacement decisions with actual failure history data.
PM Compliance Rate
Percentage of scheduled preventive tasks completed on time. OxMaint targets 90%+ and alerts managers when compliance drops below configured thresholds.
Reactive vs. Planned Ratio
Tracks what percentage of your total work orders are reactive. Industry best practice is below 20% reactive — OxMaint dashboards show your current ratio in real time.
Cost per Work Order
Total labor + parts cost divided by completed work orders — OxMaint calculates this automatically per asset class, helping benchmark your maintenance spend accurately.
Asset Utilization
Measures how much of your asset's available uptime is actually productive. Low utilization often signals deferred maintenance, poor scheduling, or chronic failure patterns.
Expert Review
What Facility Directors Say About CMMS ROI
“
The biggest mistake facility managers make when evaluating CMMS platforms is comparing subscription cost to the status quo — instead of comparing it to the true cost of doing nothing. When we audited our reactive maintenance spend for a 400,000 sq ft commercial portfolio, the number was 2.8x what leadership assumed it was. Emergency vendor callouts, overtime labor, tenant credits for HVAC failures, early equipment replacement — none of it appeared in the maintenance budget line. Once we built a real cost picture and modeled a 35% reduction in reactive work, the CMMS business case was approved in one meeting. The payback period was under six weeks.
Common Questions
Frequently Asked Questions
How do I calculate my current reactive maintenance cost?
Start by pulling 12 months of work order labor hours and multiplying by fully-loaded labor rates — including overtime premiums. Add parts and contractor invoices tagged as emergency or unplanned. For most facilities, this number is 2–4x higher than expected because emergency costs are spread across multiple budget categories.
Book a demo to walk through OxMaint's cost audit framework with a facilities specialist who can help you build this number accurately.
What MTTR improvement can I realistically expect after CMMS implementation?
Most OxMaint customers see 30–45% MTTR reduction within the first 90 days, primarily driven by faster dispatch, mobile work order access, and asset history visibility at the point of repair. The biggest gains come from eliminating the time technicians spend hunting for equipment manuals, past repair records, and parts locations.
Start your free OxMaint account and benchmark your current MTTR against the industry average using the built-in reporting dashboard from day one.
Does OxMaint track cost per asset, or only total maintenance spend?
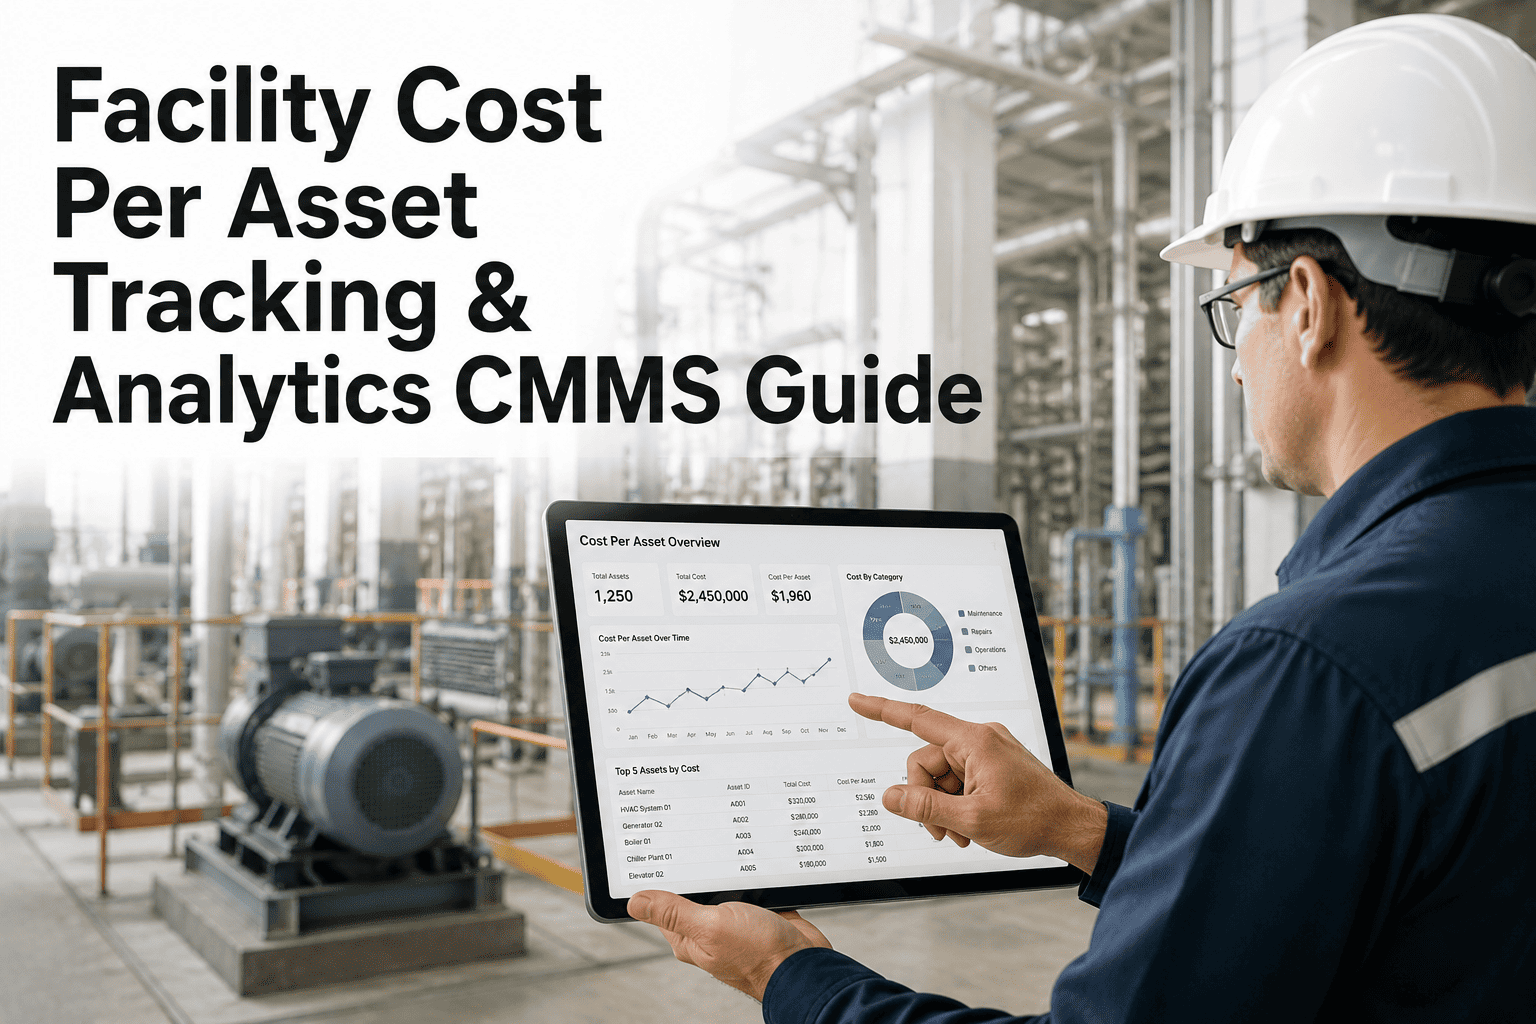
OxMaint tracks maintenance cost at the individual asset level — accumulating labor hours, parts costs, and contractor expenses per asset over its lifetime. This asset-level cost history is what enables lifecycle decisions: when an asset's annual maintenance cost approaches 40–50% of replacement cost, OxMaint flags it for capital review. You can filter cost reports by asset class, location, technician, or date range.
Explore OxMaint's cost reporting features in a free trial.
How long does it take to see measurable ROI after deploying OxMaint?
Most facility teams see measurable labor efficiency gains within 30 days of go-live — primarily through faster work order dispatch and elimination of manual scheduling. PM compliance improvements typically show up in reports by week 6–8, and the full impact on emergency repair costs becomes visible in the 90–180 day window as the PM backlog is cleared and scheduled maintenance takes over from reactive response.
See a live ROI timeline in a 30-minute demo.
Can OxMaint generate reports I can present to leadership to justify the investment?
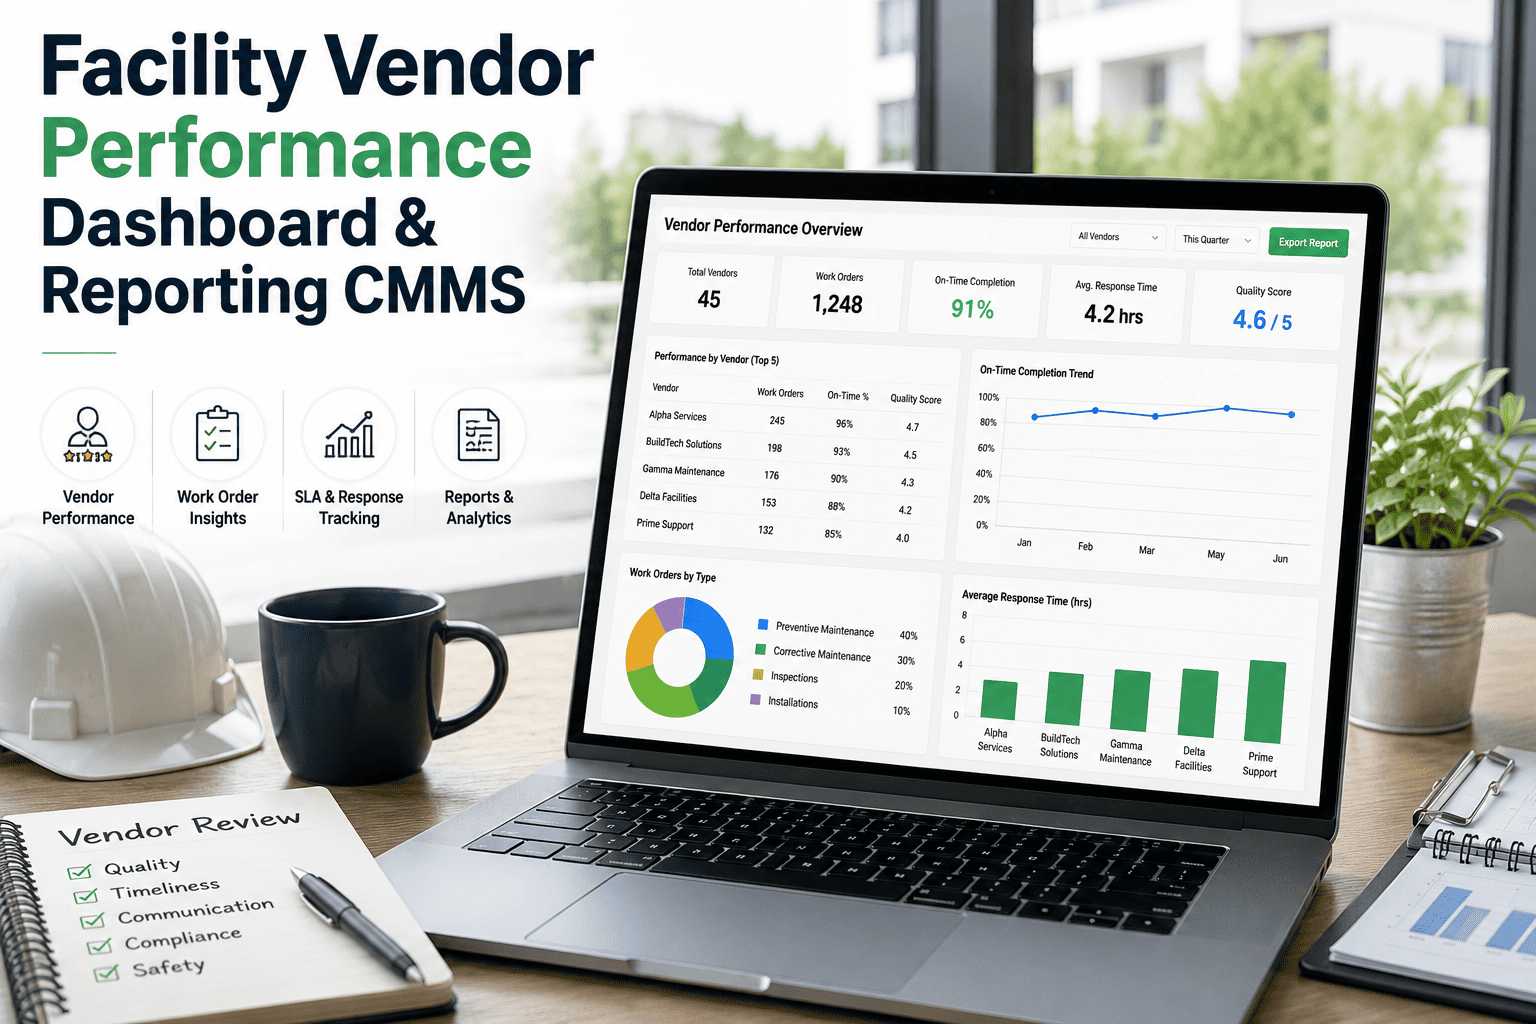
Yes — OxMaint's reporting suite includes pre-built executive summaries showing PM compliance rate, reactive vs. planned work ratio, MTTR trends, cost per work order, and asset-level spend. These reports are exportable to PDF or Excel and are designed specifically for leadership review and budget justification. Many OxMaint customers use the 90-day post-implementation report as the foundation for their annual maintenance budget submission.
See the full reporting dashboard in a free account.
Facility Maintenance ROI · OxMaint CMMS
Stop Guessing. Start Measuring Your Maintenance ROI.
OxMaint gives facility managers real-time visibility into every KPI that drives maintenance cost — from MTTR and PM compliance to asset lifecycle spend. See exactly where your budget is going and where you can save.