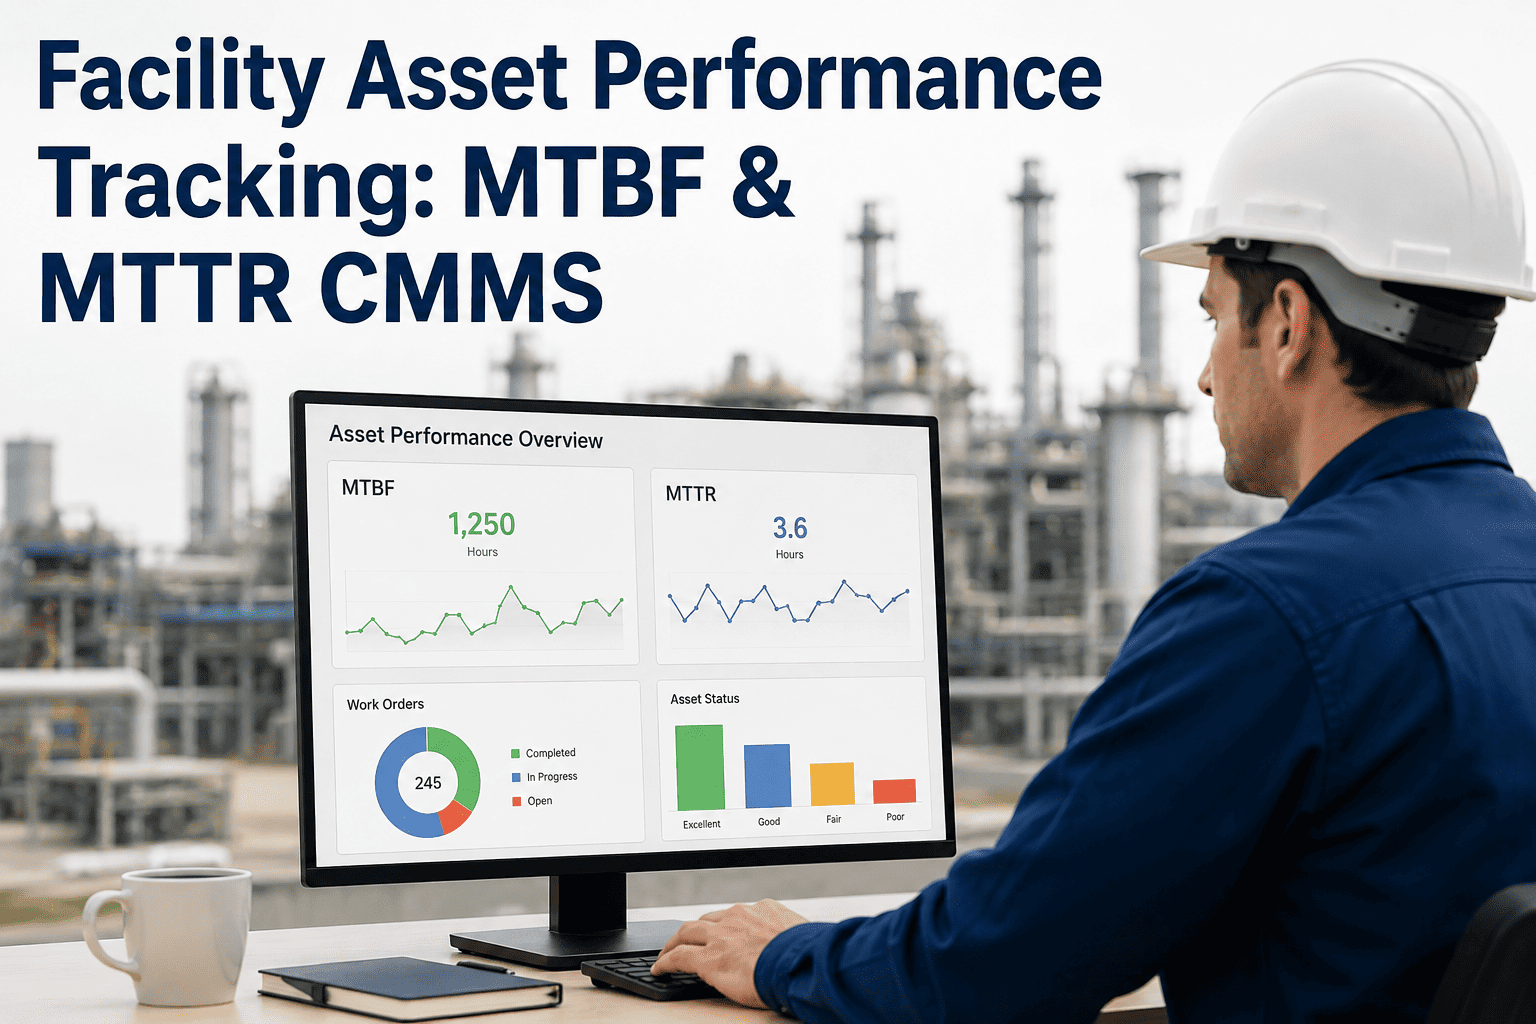
Facility asset performance tracking turns maintenance data into a leading indicator of reliability rather than a lagging record of breakdowns. By codifying MTBF (Mean Time Between Failures) and MTTR (Mean Time to Repair) by equipment class and feeding those figures into a CMMS, managers expose failure patterns that spreadsheets hide and trend them month over month. Teams that operationalise these metrics typically lift availability by 8–15% within two quarters while cutting unplanned labour spend. The framework below walks through the benchmarks, formulas, trending cadence and CMMS configuration needed to make it repeatable — and you can pilot it on your own asset register with a Start Free Trial before committing to a rollout.
Is your CMMS telling you which asset fails next — or just logging what already broke?
Most facility teams own a CMMS but still run reactive. The gap is rarely the software; it is the absence of a structured MTBF/MTTR tracking loop with thresholds, owners and trending that triggers action before the next failure. Closing that loop is what separates a 92%-available plant from a 78% one.
MTBF and MTTR, decoded for facility teams
ISO 55000-aligned reliability programs converge on the same two numbers. Together they describe how long an asset typically runs before failing, and how quickly your team restores it when it does.
MTBF — Mean Time Between Failures
For repairable assets (AHUs, compressors, conveyors). A rising MTBF means your preventive program is winning; a falling one means failure modes are accelerating. Track it per asset, not facility-wide averages, which mask problem children.
MTTR — Mean Time to Repair
Clocks from failure notification to restored function. A high MTTR signals parts availability gaps, skill shortages or unclear escalation paths. The fastest win in most facilities is cutting MTTR, not MTBF — it is directly controllable.
Realistic MTBF and MTTR ranges by equipment type
Benchmarks below are drawn from mid-sized manufacturing and commercial facilities running mixed HVAC, compressed-air and production assets. Use them as sanity checks — your CMMS history is always the authoritative source for your context.
| Equipment Class | Typical MTBF | Typical MTTR | Top Failure Driver | Tracking Cadence |
|---|---|---|---|---|
| AHU / RTU (HVAC) | 340–520 hrs | 4–9 hrs | Coil fouling, belt slip | Weekly |
| Centrifugal chiller | 2,800–4,200 hrs | 12–28 hrs | Refrigerant leak, bearing | Monthly |
| Air compressor (rotary screw) | 900–1,600 hrs | 5–11 hrs | Oil carryover, valve | Weekly |
| Conveyor (powered roller) | 600–1,100 hrs | 3–6 hrs | Drive chain, photo-eye | Weekly |
| Hydraulic press | 450–820 hrs | 8–16 hrs | Seal failure, relief valve | Bi-weekly |
| CNC machining center | 1,200–2,000 hrs | 6–14 hrs | Spindle, coolant pump | Monthly |
| Dock leveler / lift | 1,000–1,800 hrs | 2–5 hrs | Hydraulic hose, switch | Monthly |
Cadence assumes 1,800–2,400 operating hours/yr per asset. Criticality Tier-1 assets should always be reviewed weekly regardless of class.
A 180-asset plant moves from reactive to predictive in 90 days
A food-packaging facility ran 180 assets on a CMMS used purely for work-order logging. Unplanned downtime was costing $42K/yr in lost throughput and $19K/yr in emergency labour. Here is what changed when they added structured MTBF/MTTR trending.
Baseline & classify
Tagged every asset with class and criticality tier in the CMMS. Exported 18 months of work orders, back-filled uptime hours from PLC run-status logs. Calculated MTBF/MTTR per asset — found 14 "problem children" generating 61% of downtime.
Set thresholds & PM tuning
Configured MTBF and MTTR thresholds per asset class. Any asset breaching its MTBF floor for two consecutive periods triggered an automated reliability review. Tightened PM intervals on the four worst compressors; loosened over-serviced AHUs to free 22 labour hours/month.
Trend & act
Monthly reliability huddle reviewing the CMMS trend dashboard. Average MTBF across Tier-1 assets rose 19%, MTTR fell 31% (parts kitting + escalation runbook). Net unplanned downtime dropped 27% — payback on the program in under 11 weeks.
Five settings that turn a CMMS into a performance engine
Most CMMS platforms can compute MTBF and MTTR out of the box — yet fewer than 40% of facilities activate the features. These five configurations are the difference between a system that reports and one that predicts.
Asset class & criticality tagging
Every asset record carries a class code (HVAC-AHU, AIR-COMP, CON-ROL) and a Tier (1–3). Without this, MTBF aggregates become meaningless averages that hide the 14 problem assets behind 166 healthy ones.
Failure-mode coding on every WO
Mandatory failure-mode dropdown on reactive work orders: leak, vibration, electrical, controls, wear, contamination. This lets you trend why assets fail by class, not just how often — the input root-cause analysis needs.
Uptime source & meter readings
Pipe PLC run-status or meter readings into the CMMS so MTBF uses actual operating hours, not calendar time. Calendar-time MTBF on seasonal equipment understates winter reliability and overstates summer reliability.
Threshold alerts & review triggers
Configure per-class MTBF floors and MTTR ceilings. Two consecutive breaches auto-create a reliability review work order with the asset's 12-month trend chart attached — no manual report-pulling required.
Monthly trend dashboard
A single board showing MTBF/MTTR trend by class, top-10 deteriorating assets and PM-completion rate. Reviewed in a 30-minute monthly reliability huddle — the cadence that keeps the program alive after the launch energy fades.
Pilot it on your own data
Spin up a free CMMS workspace, import your asset register and work-order history, and see MTBF/MTTR trending on your real equipment in under an hour.
Start Free TrialSee your MTBF and MTTR by asset — before the next breakdown
Book a 30-minute walkthrough and we'll map your asset classes, import a sample of your work-order history, and show you exactly where your failure patterns are hiding.
Facility asset performance tracking — the questions that come up first
What is a good starting MTBF for facility equipment?
It depends on class and criticality, but a practical floor is 300–500 operating hours for HVAC and compressed-air assets, and 800+ hours for production machinery. The more useful question is whether your current MTBF is trending up or down over three months — direction beats absolute benchmarks every time. Baseline first, then set improvement targets of 10–15% per quarter.
How quickly can a CMMS show MTBF/MTTR trends?
If you have 90+ days of clean work-order history with failure dates and repair durations, a CMMS can produce per-asset MTBF and MTTR the same day you import the data. Meaningful trends (3-point moving averages) need about three months of ongoing data. You can pilot this on your own register with a Start Free Trial — most teams see their first dashboard in under an hour.
Should MTTR include parts-waiting time?
Yes — and this is where many facilities understate their true MTTR. The clock should run from failure notification to restored function, including time spent waiting for parts, sourcing contractors or escalating. If your MTTR jumps from 6 to 14 hours for a given asset class, parts availability is almost always the culprit. Track "repair-active" and "repair-wait" as sub-components if your CMMS supports it.
What's the difference between availability, MTBF and OEE?
Availability = MTBF ÷ (MTBF + MTTR) and measures uptime alone. OEE (Overall Equipment Effectiveness) multiplies availability × performance × quality, so it captures speed loss and defect rates too. For facility asset performance tracking, availability driven by MTBF/MTTR is the right starting metric — OEE is better suited to production-line optimisation once reliability is under control.
How do I justify the cost of a CMMS-based tracking program?
Quantify three buckets: unplanned downtime cost per hour (lost throughput + emergency labour), emergency parts premium (typically 20–35% above stocked pricing) and overtime triggered by breakdowns. Even a modest 180-asset facility spending $42K/yr on unplanned downtime can justify the program with a 20–30% reduction. A 30-minute demo at Book a Demo will map the numbers to your specific operation.
Stop logging failures. Start predicting them.
Your CMMS should tell you which asset is about to fail, why, and what to do about it. Set up MTBF/MTTR trending on your real equipment this week — no migration, no credit card, no consultants required.
Free 14-day trial · No credit card