Most commercial buildings still run every asset on the same logic: fix it when it breaks, or service it on a fixed calendar. Neither fits a rooftop unit, a fire pump, and a restroom exhaust fan equally well. A per-asset strategy checklist asks three questions in order: how does this asset fail, what does that failure cost, and which task actually prevents it. This guide follows the SAE JA1012 RCM decision approach and shows how to record each decision in maintenance management software so it stays consistent from one technician and one year to the next.
Commercial Facilities · RCM Decision Logic · Strategy Selection
Facility Maintenance Strategy Checklist: Pick the Right Strategy for Every Asset
Assign reactive, preventive, or predictive maintenance to each asset using failure mode, criticality, and cost inputs instead of one building-wide rule. Work through the checklist once per asset class, record the reasoning, and revisit it when the evidence changes.
Inputs per asset
Failure mode and consequence
Criticality score
Cost of failure vs cost of task
SAE JA1012 decision logic
Strategy assigned
Reactive with a spares plan
Time-based preventive
Condition-based or predictive
Failure-finding test
Why One Strategy for the Whole Building Fails
Facility teams rarely choose a maintenance strategy on purpose. It builds up from contract scopes, OEM manuals, habit, and whatever failed last winter. The outcome is over-maintained low-risk assets and under-protected critical ones.
Blanket strategy
Every rooftop unit gets the same quarterly visit, whatever its duty or redundancy.
Standby pumps and emergency lighting are assumed to work because nobody has seen them fail.
Sensors are bought for assets whose failures are cheap to fix.
Technicians cannot say why a task exists, so tasks get skipped or padded.
Per-asset strategy
Task frequency follows failure pattern and criticality, not calendar habit.
Hidden failures get functional tests on a defined interval.
Monitoring spend goes only where warning time and failure cost justify it.
Every task links to a failure mode and a written reason.
The Six Stages Behind the Checklist
The checklist below is split into six parts that mirror the RCM sequence: function, failure, consequence, priority, cost, and task selection. Complete them in order for each asset class, not each individual tag.
1DefineAsset, function, and duty context
2AnalyseFailure modes, effects, consequence class
3ScoreCriticality across five factors
4PriceFailure cost against task cost
5AssignReactive, PM, PdM, or failure-finding
6RecordTemplates, owners, and review triggers
The Per-Asset Strategy Selection Checklist
Part A
Asset Scope and Function
A strategy attaches to a specific function, not to a piece of equipment in the abstract. Start by writing down what the asset must do and where it does it.
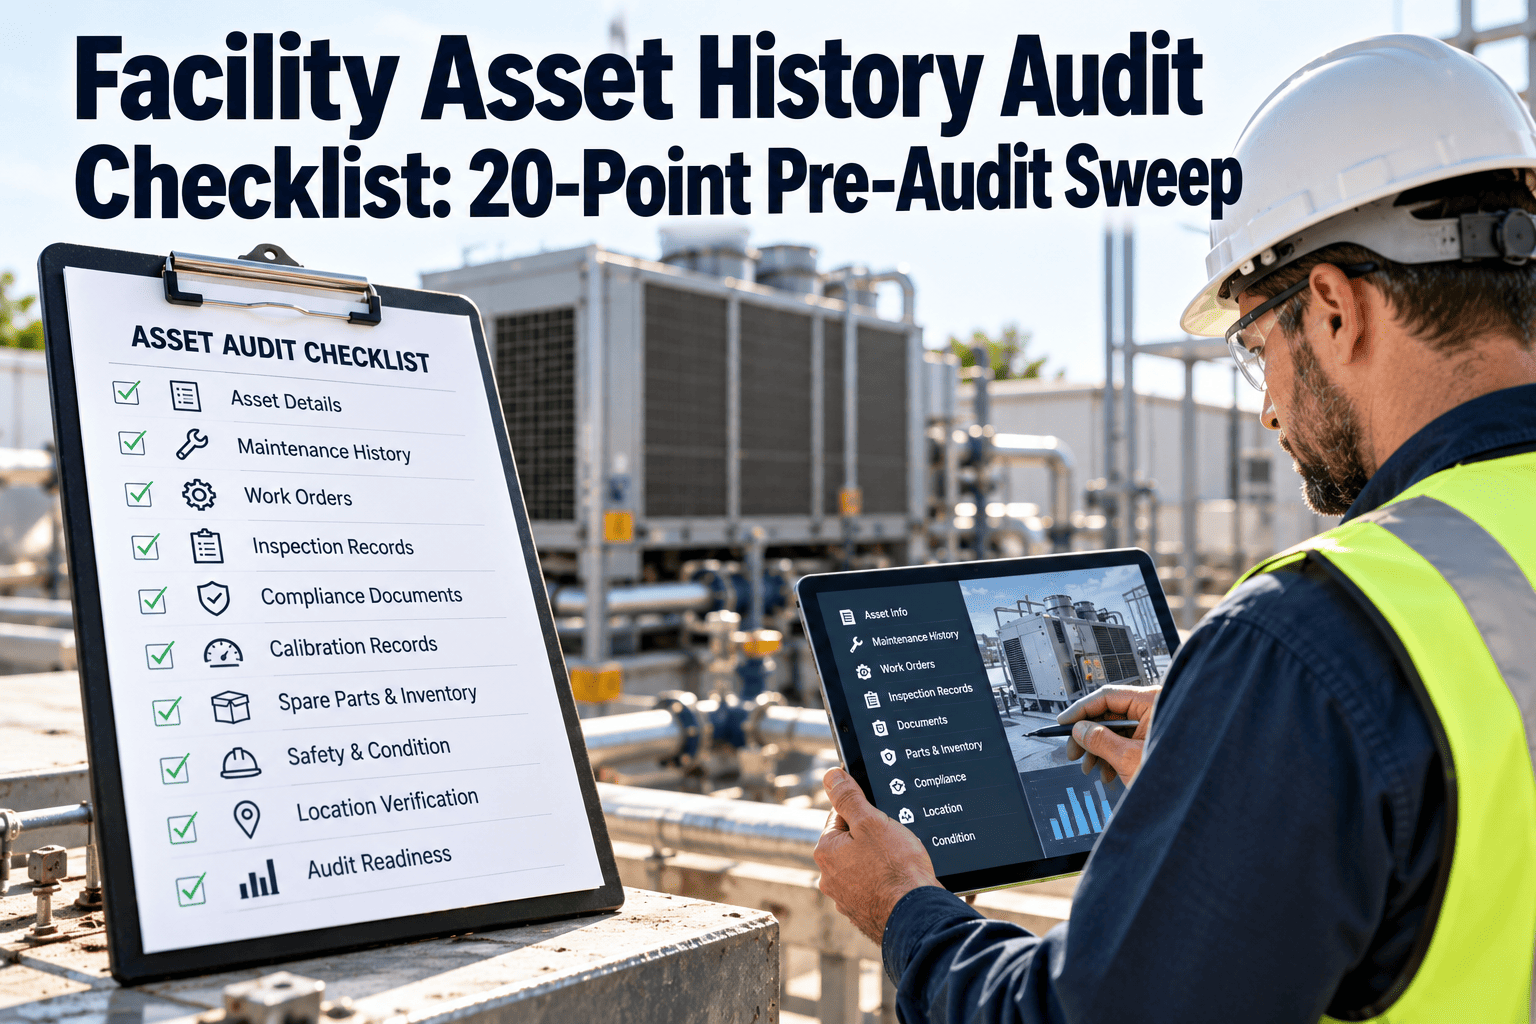
Asset is uniquely identified in the register with location, system, make, model, and install date, so the strategy attaches to a real record and not a description.
Function is written as a performance requirement, such as "holds the east wing at setpoint at design load," rather than just the equipment name.
Asset is grouped by system (HVAC, electrical, plumbing, fire and life safety, vertical transport, envelope) so related assets share one review owner.
Duty context is recorded: run hours, seasonal use, lead or standby role, and environment such as rooftop, mechanical room, or wet area.
Fixed obligations are captured: manufacturer, code, insurer, and warranty maintenance requirements set a floor under whatever strategy you choose.
Part B
Failure Modes and Consequences
This part decides whether any proactive task is worth considering. The consequence class matters more than the failure frequency.
Functional failures are listed as both total loss of function and partial loss, such as reduced capacity or readings out of tolerance.
Likely failure modes are identified from work order history, technician knowledge, and OEM guidance: bearing wear, belt slip, refrigerant leaks, contactor pitting, fouled coils.
Each failure effect is written down: what happens, what is seen or heard, who notices first, and how long restoration takes.
A consequence class is assigned per JA1012 logic: hidden, safety or environmental, operational, or non-operational.
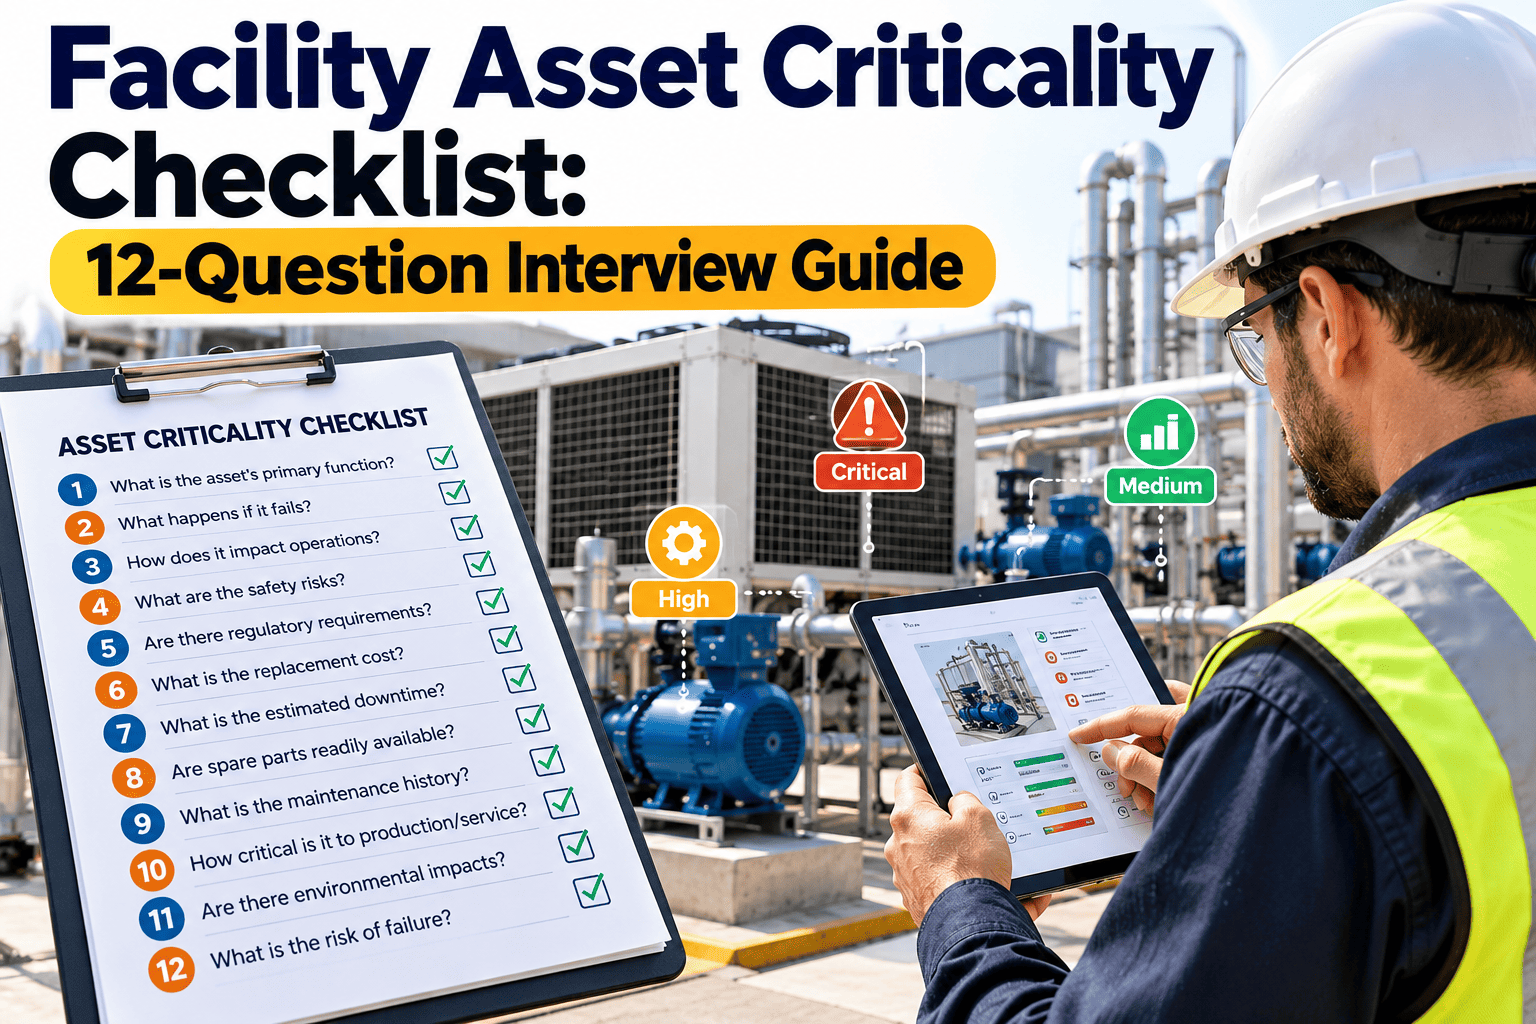
Hidden failures are flagged. Relief valves, emergency lighting, standby pumps, and alarm devices fail without notice and are discovered only when needed.
Failure pattern is noted: age-related wear, random, or early-life. A time-based task only helps when failure relates to age or use.
Part C
Criticality Scoring
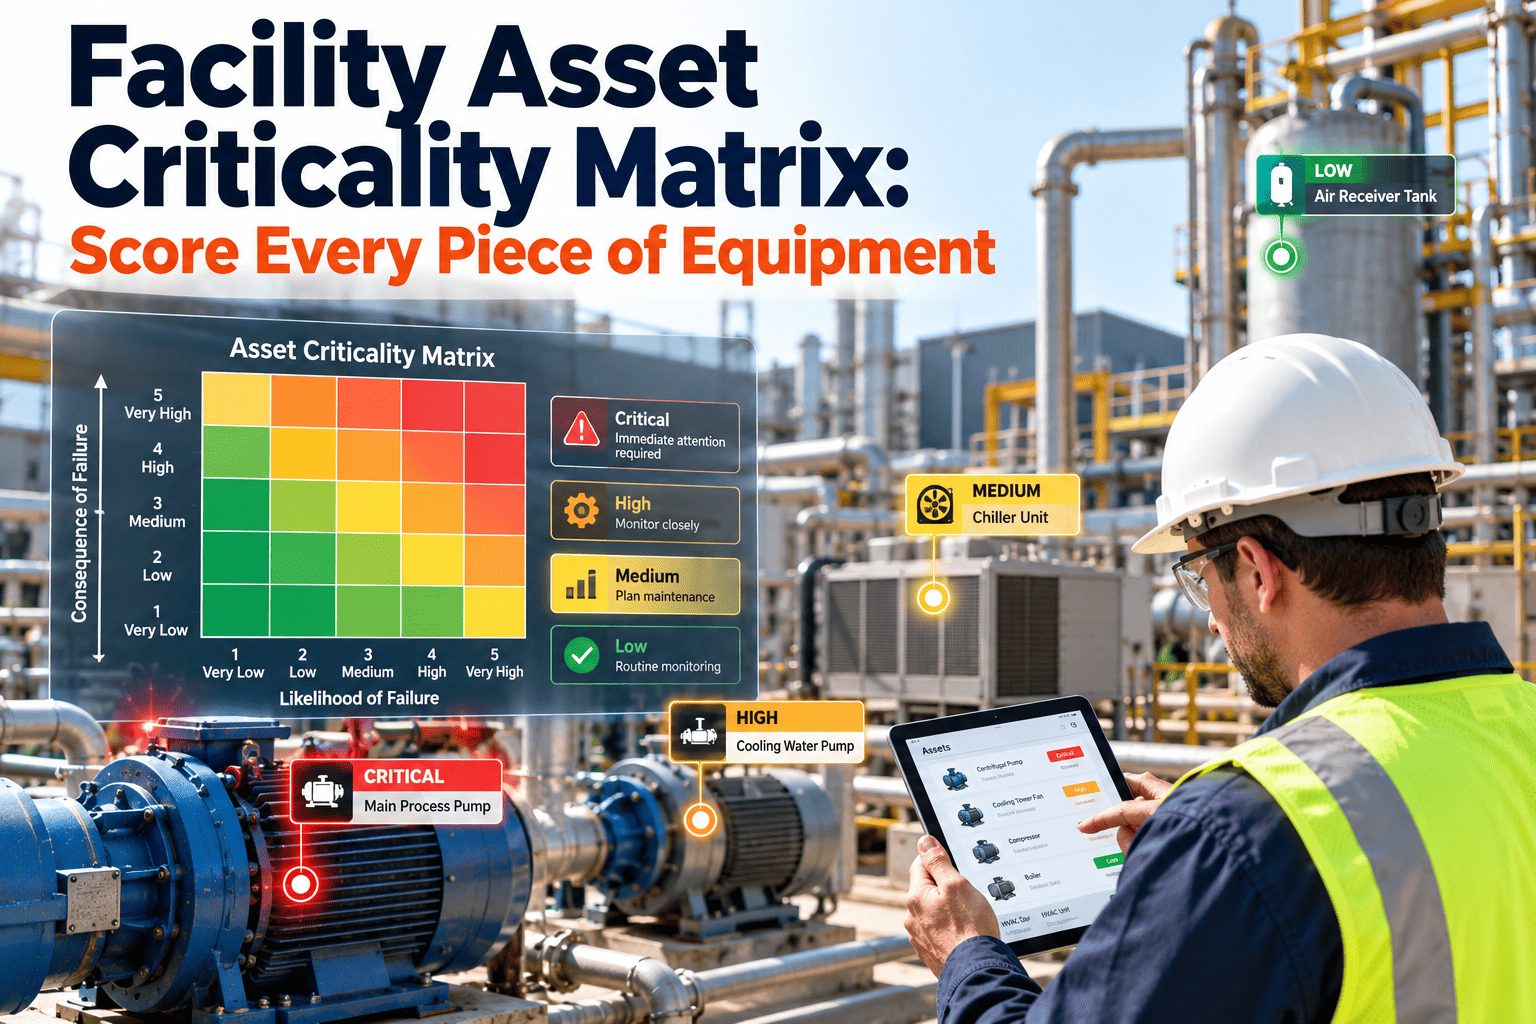
Criticality decides how much effort an asset deserves. Score the same five factors for every asset so bands are comparable across systems.
Life-safety impact is scored from 1 to 5, including egress, fire protection, medical gas, and hazardous exposure.
Occupant and business impact is scored: tenant downtime, data halls, laboratories, patient areas, retail floors, and comfort complaints.
Regulatory exposure is scored for assets with mandated inspection or testing, such as fire protection, elevators, backflow devices, and refrigerant systems.
Redundancy is scored: installed spare, N+1, or none, and how long a changeover takes.
Repair lead time is scored: parts on the shelf versus long-lead components, and contractor response time.
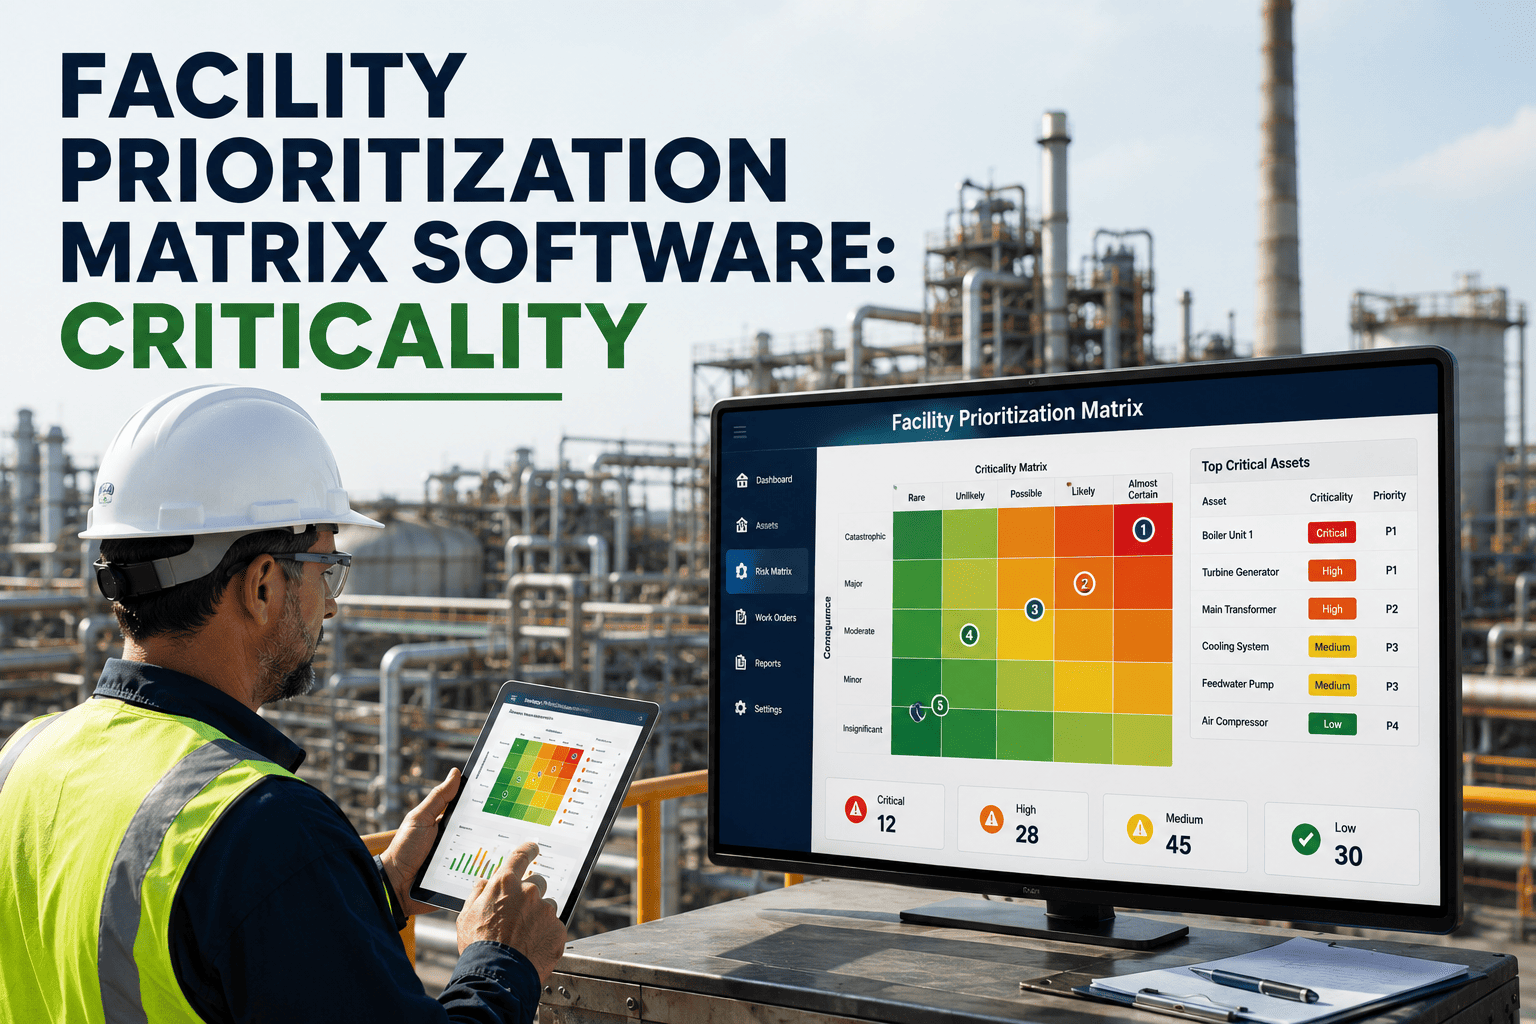
The total is banded A, B, or C and signed off by the facility manager. Bands are re-checked when building use changes.
Part D
Cost Inputs
A proactive task is justified only when it costs less than the failure it prevents. Use rough, sourced numbers rather than precise guesses.
Failure event cost is estimated: parts, labor, emergency contractor rates, and secondary damage such as water intrusion or spoiled stock.
Downtime cost is estimated: tenant impact, lost revenue, temporary cooling or heating, and relocation of activities.
Proactive task cost is estimated per interval: labor hours, materials, access equipment, and lockout or shutdown time.
Monitoring cost is compared against the failure cost it avoids, including sensors, handheld tools, route time, and analysis effort.
Remaining life is considered. If replacement is planned soon, new monitoring investment rarely pays back.
Annual proactive cost is compared with annual expected failure cost, and the source of each assumption is noted so it can be challenged.
Part E
Strategy Assignment
With consequence, criticality, and cost on the page, the strategy usually becomes obvious. Confirm each test below before you commit.
Reactive is allowed only when the consequence is non-operational or minor, no safety exposure exists, replacement is quick and cheap, and no task costs less than the failure.
Time-based preventive is chosen when failure is age-related, the interval can be predicted, and the task costs less than the failure.
Condition-based or predictive is chosen when the failure gives a detectable warning that lasts longer than the time needed to inspect and respond.
Inspection interval is set inside the warning window, commonly at about half the P-F interval, so at least one check lands between potential and functional failure.
Failure-finding tasks are set for hidden failures: functional tests of standby pumps, emergency lighting, and relief devices at a defined interval.
Redesign or replacement is logged as a capital request when no task is worthwhile and the consequence is still unacceptable.
A default fallback is recorded so no asset is ever left unassigned.
Part F
Recording and Review
A strategy that lives in a spreadsheet or in one engineer's head will drift. Push each decision into the maintenance system.
Strategy, rationale, and owner are recorded on the asset record.
Each proactive task is built as a template with interval, calendar or meter trigger, craft, time estimate, and parts kit.
Condition thresholds are defined: alert and action limits, who receives the alarm, and which work order it creates.
Run-to-failure assets have a spares and response plan, so "reactive" is a deliberate decision and not an accident.
Review triggers are set: repeat failure, major repair, change of use, code change, and an annual review.
Results are tracked: failures per asset, PM compliance, and cost by strategy band, with strategy adjusted on evidence.
Decision Matrix: Consequence Class by Failure Pattern
Use this grid after Part B. It is a starting point for the conversation, not a substitute for judgment on unusual assets.
| Consequence class | Age-related failure | Detectable warning | Random, no warning |
|---|
| Safety or environmental | Scheduled restoration or replacement at a conservative interval | Condition-based with a tight inspection interval | Redesign, add protection, or replace |
| Hidden failure | Failure-finding test plus scheduled task | Failure-finding test | Failure-finding test with added redundancy |
| Operational | Preventive if cheaper than failure | Condition-based if warning time is long enough | Reactive with spares, or redesign if costly |
| Non-operational | Reactive unless the task is very cheap | Condition-based only if very cheap | Reactive |
Criticality Scoring Grid and Bands
Score each factor from 1 to 5 using anchors like these. The band thresholds are examples; tune them to your portfolio and keep them fixed once agreed.
| Factor | Score 1 | Score 3 | Score 5 |
|---|
| Life-safety impact | None | Indirect or delayed exposure | Direct risk to occupants |
| Occupant and business impact | Unnoticed | Local disruption | Building or tenant operations stop |
| Regulatory exposure | No mandate | Periodic inspection required | Mandated testing with penalties |
| Redundancy | Installed spare, automatic | Manual changeover | No backup |
| Repair lead time | Same day, parts stocked | Days, local supply | Weeks, long-lead parts |
Band ATotal 19 to 25. Full strategy review, condition monitoring considered, named owner.
Band BTotal 11 to 18. Preventive tasks tied to failure modes, reviewed annually.
Band CTotal 5 to 10. Reactive or minimal PM, with spares and response plan on record.
Turn Strategy Decisions Into Scheduled Work
A checklist only helps if the result reaches the technician. Put each asset's strategy, tasks, and intervals into one system and see what gets done against what was planned.
Worked Examples for a Commercial Building
These examples are illustrative. Your answers depend on redundancy, duty, and local conditions, which is exactly why the checklist is run per asset.
| Asset | Typical consequence | Common strategy | Reasoning |
|---|
| Water-cooled chiller | Operational, high cost | Condition-based plus scheduled PM | Trended approach temperature, oil, and vibration give warning |
| Main switchgear | Operational, possible safety | PM with infrared thermography | Loose connections heat up before they fail |
| Emergency lighting | Hidden failure | Failure-finding test | Failure is unseen until a power loss |
| Fire pump | Hidden, safety, regulated | Code-required tests and inspections | Mandated intervals set the floor |
| Air filters | Operational | Time-based or differential-pressure trigger | Loading is measurable and cheap to check |
| Restroom exhaust fan | Non-operational | Reactive with spare belts and motors | Low consequence, fast repair |
| Circulation pump with installed spare | Operational, redundant | Reactive or light PM with alternation | Standby covers the failure |
| Lift and escalator equipment | Safety, regulated | Contract PM plus statutory inspections | Compliance and safety drive the interval |
Six Mistakes That Undermine Strategy Selection
Treating PdM as an upgrade for every assetPredictive methods earn their cost only where warning time and failure cost justify them.
Scoring criticality once and never againA new tenant, a converted floor, or a removed backup changes the score.
Ignoring hidden failuresDevices that only work during emergencies need functional tests, not visual glances.
Copying OEM intervals without contextManuals assume average duty. Your environment and run hours may differ.
Labeling reactive as "no plan"Run-to-failure without spares and a response path becomes an emergency.
Skipping the rationaleWithout a recorded reason, tasks are cut or added by opinion.
Review Cadence After the Strategy Is Set
Week 1Load strategies, task templates, and owners into the system. Confirm every asset has a strategy.
Day 30Check that scheduled tasks are being completed and that time estimates match reality.
Day 90Review repeat failures and unplanned work orders on Band A and B assets.
AnnuallyRescore criticality, refresh cost inputs, and retire tasks that no longer earn their place.
Metrics That Show the Strategy Is Working
| Metric | How to measure | Desired direction |
|---|
| PM compliance | Completed on time / scheduled, by criticality band | High on Band A first |
| Reactive share by band | Corrective work orders / total work orders | Low on A, accepted on C |
| Repeat failures | Same asset and failure mode within a set period | Falling |
| Alert-to-action time | Condition alert to work order completion | Shorter than the P-F interval |
| Cost per strategy band | Labor, parts, and contractor spend by band | Shifts toward critical assets |
| Unassigned assets | Assets with no strategy on record | Zero |
Applying the Checklist Inside Oxmaint
Oxmaint gives the checklist somewhere to live. Each decision can be attached to the asset and turned into scheduled, trackable work.
Asset managementStore criticality band, consequence class, and strategy rationale on each asset record.
Preventive maintenanceSchedule time-based and meter-based tasks with the craft, duration, and parts defined in Part F.
Inspections and mobile workflowsRun failure-finding tests and condition readings on mobile, with pass or fail results recorded.
Work orders and inventoryTurn out-of-range readings into corrective work orders and keep critical spares visible.
Reporting and dashboardsTrack compliance, repeat failures, and reactive share by band to guide the annual review.
Frequently Asked Questions
What separates reactive, preventive, and predictive maintenance?Reactive acts after failure, preventive acts on a schedule, and predictive acts when measured condition shows a developing fault. Each suits a different failure pattern and consequence.
Is run-to-failure ever the right choice?Yes, for low-consequence assets that are cheap and quick to replace, provided spares and a response path exist.
How often should asset strategies be reviewed?Review annually and after repeat failures, major repairs, or a change of use. You can log review dates by setting up your asset register.
Do I need sensors to run predictive maintenance?Not always. Handheld readings, thermography, and trended pressures or temperatures from existing controls can provide condition data.
How can Oxmaint support per-asset strategy?It links strategy, tasks, work orders, and reports on each asset. You can book a walkthrough to see the workflow.
Give Every Asset a Strategy You Can Defend
Move from habit-based maintenance to decisions tied to failure, criticality, and cost. Start with your Band A assets and build outward.