Most facility management teams are flying blind -- tracking work orders completed while missing the performance signals that determine whether their operations are improving, stagnating, or heading toward a capital crisis. Facility management KPIs convert raw maintenance activity into comparable, actionable metrics that justify budget requests, expose operational gaps, and benchmark performance against industry standards. Without them, FM leaders manage by intuition in a discipline that demands data. Book a demo to see how Oxmaint tracks all 25 FM KPIs automatically from your work order and asset data.
Article
12 min read
$176B
Deferred maintenance backlog in US public buildings -- growing 7% annually without structured PM programs
62%
Of FM managers report no unified KPI dashboard across their building portfolio
4.8x
Emergency repair cost premium over planned maintenance -- the ratio KPIs expose before failures occur
89%
PM compliance achievable with CMMS versus 51% industry average without automated scheduling
Quick Answer
Facility management KPIs are quantifiable metrics that measure the efficiency, cost, compliance, and occupant impact of building operations. The 25 most critical KPIs span five categories: cost and financial performance, maintenance operations, regulatory compliance, energy management, and tenant satisfaction. FM leaders who track these metrics consistently reduce reactive maintenance spend by 30-45%, improve PM compliance by 38 percentage points, and produce audit-ready documentation on demand.
Category 1: Cost and Financial KPIs
Cost KPIs reveal whether maintenance spend is proportional to asset value, whether reactive repairs are inflating the budget, and whether capital forecasts reflect real asset condition data.
KPI 01
Maintenance Cost per Square Foot
Total maintenance spend / gross building area
Benchmark: $1.60 -- $3.20/sqft (office) | $2.80 -- $4.90/sqft (healthcare)
The primary portfolio-level cost comparator. Rising cost per sqft faster than inflation signals accumulating deferred maintenance before capital budgets reflect the damage.
KPI 02
Reactive vs Planned Maintenance Ratio
Reactive work order hours / total maintenance hours x 100
Best-in-class: below 15% reactive | Warning threshold: above 35%
The single most important FM indicator. Reactive ratios above 35% drive emergency repair costs at 4.8x the planned rate -- consuming budget that should fund PM expansion.
KPI 03
Cost per Work Order
Total labor and parts cost / total work orders closed
Planned WO: $180 -- $340 | Reactive WO: $680 -- $1,200
Tracked alongside reactive ratio, cost per WO reveals whether high spend comes from volume or emergency premium -- two problems requiring different solutions.
KPI 04
Maintenance Cost as % of RAV
Annual maintenance spend / total replacement asset value x 100
Industry standard: 2.0 -- 3.0% of RAV | Reactive programs: 5.0 -- 8.0%
Benchmarks maintenance investment against the value being maintained. Facilities below 1.5% RAV are chronically under-investing and building backlogs that compound at 7% annually.
KPI 05
CapEx vs OpEx Maintenance Ratio
Capital replacement spend / operational maintenance spend
Target: 1:4 to 1:6 CapEx-to-OpEx | Reactive programs: 1:1.5 or worse
When CapEx approaches OpEx spend, the PM program is failing to extend asset lives -- forcing premature replacements that erode operating budgets and trigger emergency council approvals.
KPI 06
PM Compliance Rate
PMs completed on schedule / total PMs scheduled x 100
Best-in-class: 90%+ | Industry average: 51% | Warning: below 70%
The leading indicator of reactive ratio. PM compliance below 70% predicts reactive ratios above 35% within 6-12 months as deferred PMs produce failures that could have been prevented.
Performance KPIs measure whether the maintenance program is actually working -- whether PMs complete on time, failures are detected early, and technicians resolve issues correctly the first time.
KPI 07
Mean Time Between Failures (MTBF)
Total operational hours / number of failures in period
Track trends per asset class -- a falling MTBF signals PM interval tightening required
Rising MTBF confirms PM improvements are extending asset reliability. Falling MTBF on a specific class signals interval recalibration or approaching end of service life.
KPI 08
Mean Time to Repair (MTTR)
Total downtime hours / number of repair events
Target: below 4 hours for critical systems | Warning: above 8 hours
High MTTR indicates parts availability problems, technician skill gaps, or diagnostic inefficiencies. Combined with MTBF, reveals whether the primary reliability problem is failure frequency or repair duration.
KPI 09
Work Order Completion Rate
Work orders closed / work orders created x 100
Target: 85%+ monthly | Warning: below 70%
Low completion rates create backlog accumulation that eventually forces deferred work into emergency status. Track by building and technician to identify bottlenecks before they become crises.
KPI 10
PM Schedule Adherence
PMs completed within +/-10% of scheduled date / total PMs x 100
Target: 85%+ on-schedule | Note: different from compliance rate
Tracks scheduling precision, not just completion. A PM completed 45 days late counts as "compliant" in many systems but fails adherence -- identifying teams that complete PMs after failures have already started developing.
KPI 11
First-Time Fix Rate
Work orders resolved without callback / total work orders x 100
Best-in-class: 85%+ | Industry average: 72%
Each callback is a second labor cost and additional tenant disruption. Low first-time fix rates indicate parts unavailability or diagnostic quality problems addressable through inventory and training.
KPI 12
Backlog Work Order Age
Total open WOs distributed by age bucket: 0-30, 31-60, 60+ days
Target: zero WOs over 60 days for life safety | Over 30 days: escalation review
Age distribution of open WOs reveals accumulation risk before items reach emergency threshold. WOs over 60 days become compliance exposure -- auditors treat age as evidence of systemic process failure.
Category 3: Compliance and Safety KPIs
Compliance KPIs measure whether regulatory obligations are being met before audits find the gaps -- and whether corrective actions close within required timeframes.
KPI 13
Regulatory Inspection Compliance Rate
Regulatory inspections completed on time / total required x 100
Target: 100% | Any miss creates regulatory exposure
NFPA, OSHA, and elevator inspection deadlines are non-negotiable. A single missed required inspection can produce a notice of violation that costs more than the entire inspection program annually.
KPI 14
Open Corrective Action Item Count
Total unresolved CAIs by age bucket (0-30, 31-60, 60+ days)
Target: zero items over 30 days for life safety | Over 60 days: escalation required
CAI aging reveals whether compliance findings are being addressed or accumulating. Items over 60 days old create regulatory liability -- auditors treat them as systemic failure, not isolated incidents.
KPI 15
Safety Incident Rate
OSHA recordable incidents x 200,000 / total employee hours worked
Target: below 2.0 | Industry average: 3.4
Facilities with structured lockout/tagout compliance programs and safety PM documentation consistently achieve rates below 1.5 -- half the industry average.
KPI 16
Audit Readiness Score
Documentation completeness across required inspection records (0-100 score)
Target: 95+ | Below 80: high audit risk
Self-assessed documentation completeness before a regulatory audit. Teams with 95+ scores consistently pass state and federal audits on first review with zero findings.
Category 4: Energy and Sustainability KPIs
Energy KPIs connect maintenance program quality to utility cost and carbon performance -- revealing which buildings and systems consume above benchmarks and where HVAC maintenance produces measurable efficiency gains.
KPI 17
Energy Use Intensity (EUI)
Annual energy consumption (kBtu) / gross floor area (sqft)
Office: 50-80 kBtu/sqft | Healthcare: 200-300 kBtu/sqft
The primary energy performance benchmark. EUI above ENERGY STAR median for building type indicates HVAC or envelope maintenance deficiencies costing thousands in avoidable utility spend annually.
KPI 18
HVAC System Efficiency Index
Actual kW/ton vs design kW/ton for chiller and RTU assets
Target: within 10% of design | Above 20% degradation: maintenance required
Chiller and RTU efficiency degradation of 15-20% above design kW/ton represents thousands in annual energy waste -- tracked per asset to identify which units need coil cleaning or refrigerant service.
KPI 19
Utility Cost Variance (Actual vs Budget)
(Actual utility cost -- budgeted cost) / budgeted cost x 100
Target: within +5% | Above +10%: investigate HVAC and BAS performance
Persistent positive variance indicates rate increases or equipment degradation. HVAC PM deferred one quarter typically produces 6-9% utility cost increases within 6 months.
KPI 20
Carbon Footprint per Building
Total scope 1 and 2 emissions / gross floor area (kgCO2e/sqft)
Target: below sector CRREM pathway | ESG reporting requirement
Increasingly required for ESG reporting and lease compliance. Facilities with current HVAC PM programs outperform sector carbon benchmarks by 12-18% through efficiency maintenance without capital investment.
Category 5: Tenant and Occupant KPIs
Tenant KPIs measure whether facility operations deliver on the occupant experience commitments that drive lease renewals, facility utilization, and organizational reputation.
KPI 21
Tenant Satisfaction Score
Average satisfaction rating from periodic tenant surveys (0-100)
Target: 78+ | Below 65: high lease renewal risk
Directly correlated with lease renewal rates. Facilities consistently scoring above 75 achieve 88% renewal rates versus 61% at facilities below 65 -- a direct link between maintenance quality and revenue.
KPI 22
Work Order Response Time
Average hours from submission to first technician contact
Target: under 4 hours standard | under 1 hour critical
The most visible FM performance metric to tenants. Sub-4-hour average response scores 14 points higher on satisfaction surveys than 8+ hour average, independent of resolution quality.
KPI 23
Complaint Resolution Rate
Complaints resolved within SLA / total complaints x 100
Target: 90%+ within SLA | Below 75%: process review required
Measures follow-through, not just acknowledgment. A complaint logged but not resolved within SLA produces twice the dissatisfaction of one never acknowledged -- because it creates an expectation and then fails it.
KPI 24
Facility Availability Rate
(Scheduled hours -- unplanned downtime) / scheduled hours x 100
Target: 99.5%+ commercial | 99.9% critical operations
Every hour below 99.5% is a service delivery failure with direct tenant impact -- tracked at the system level to identify HVAC, elevator, or power reliability problems before they recur.
KPI 25
Space Utilization Efficiency
Actually used sqft / total available sqft x 100 (from sensor or badge data)
Target: 70%+ average daily utilization | Post-2020 office average: 45-55%
Connects maintenance spend to occupancy reality. Facilities maintaining 100% of space while 45% sits unused are over-spending on energy and maintenance per productive sqft.
FM KPI Industry Benchmark Reference
Benchmarks from IFMA, BOMA, and APPA datasets. Calibrate against comparable portfolio type and geography for most accurate targets.
| KPI |
Industry Average |
Best-in-Class |
Warning Threshold |
| Maintenance Cost per Sqft | $2.10 -- $3.80 | $1.60 -- $2.40 | Above $5.00 |
| Reactive Maintenance Ratio | 38% | Below 15% | Above 50% |
| PM Compliance Rate | 51% | 90%+ | Below 60% |
| Work Order Completion Rate | 72% | 90%+ | Below 65% |
| MTTR (Critical Systems) | 6.2 hours | Under 3.5 hours | Above 10 hours |
| Regulatory Inspection Compliance | 87% | 100% | Below 95% |
| First-Time Fix Rate | 72% | 88%+ | Below 60% |
| Work Order Response Time | 7.4 hours | Under 2 hours | Above 12 hours |
| Tenant Satisfaction Score | 71/100 | 84/100+ | Below 60/100 |
| Maintenance Cost as % of RAV | 3.2% | 1.8 -- 2.5% | Above 6% |
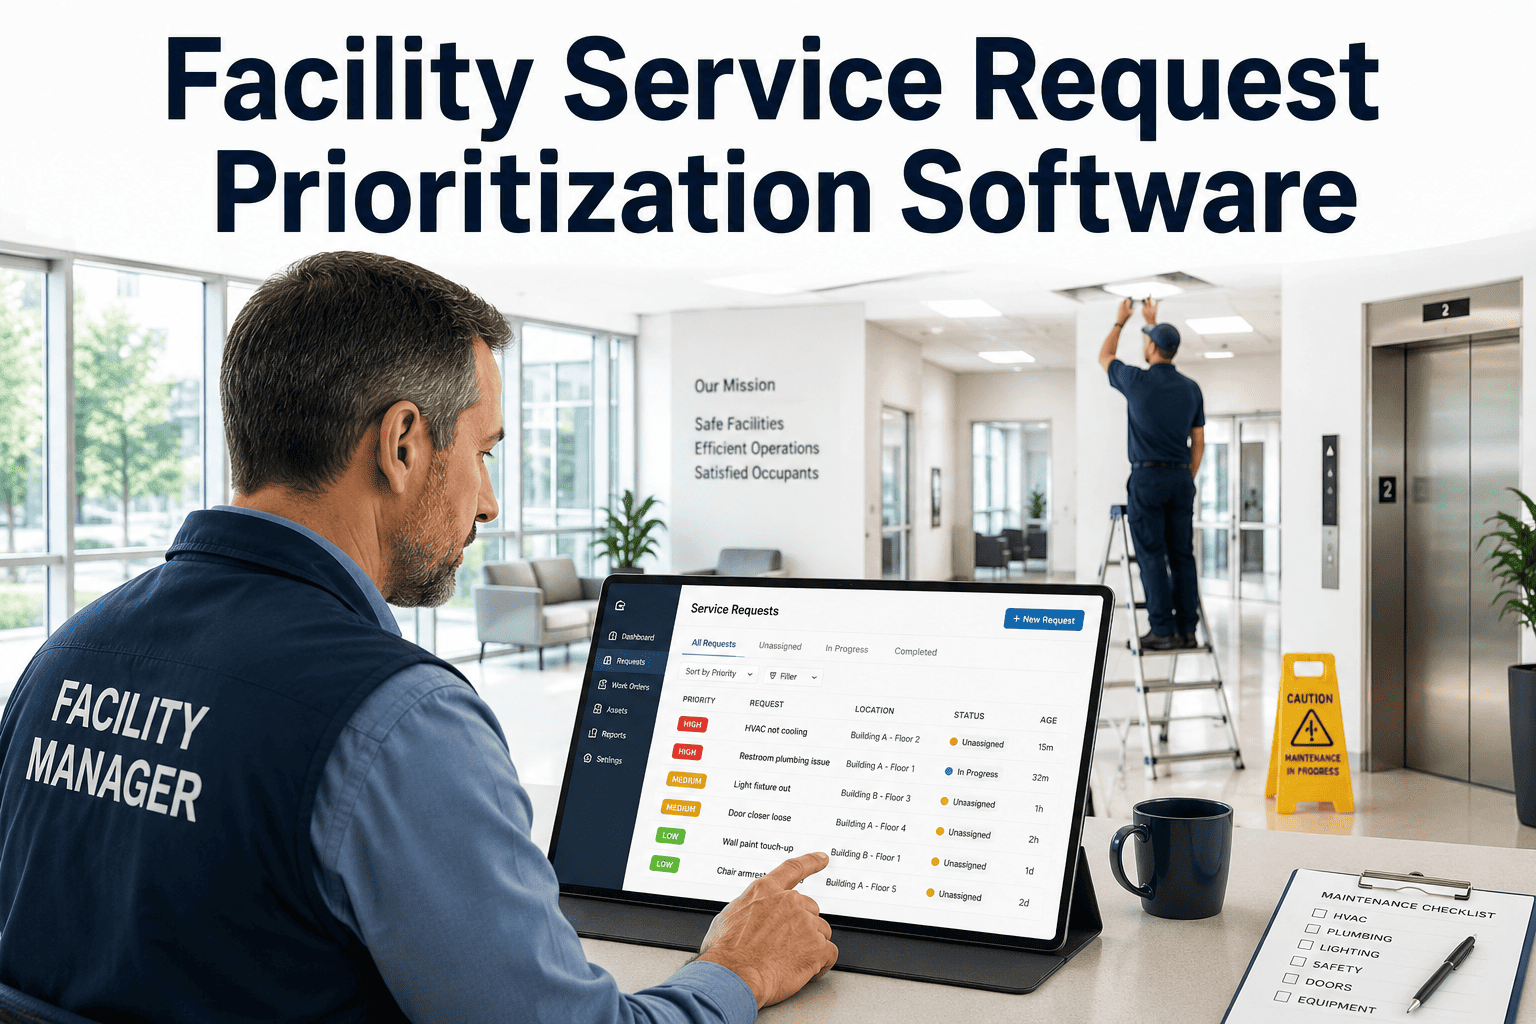
How Oxmaint Tracks All 25 FM KPIs
Oxmaint calculates FM KPIs automatically from work order completions, asset records, and PM scheduling data. Every metric updates in real time as your team completes work -- no parallel data entry, no end-of-month compilation.
Real-Time KPI Dashboard
All 25 KPIs updated continuously from live work order and PM data. No end-of-month compilation. Portfolio and building-level views for every role from technician to director.
Automated KPI Threshold Alerts
Set alerts for any KPI -- reactive ratio above 35%, PM compliance below 70%, MTTR above 8 hours. Alerts route to the right team member before the metric reaches crisis level.
Board-Ready Reporting
One-click KPI summary export in PDF -- trend charts, benchmark comparisons, and portfolio roll-ups ready for council submissions, investor packages, and executive briefings.
IFMA and BOMA Benchmarking
Compare KPIs against buildings in your portfolio and against IFMA/BOMA industry standards for your facility category -- no separate data subscription required.
Before and After: FM KPI Impact
Outcomes from benchmark comparisons between reactive-maintenance programs and Oxmaint-deployed operations running structured KPI-driven PM programs.
Before Structured KPI Tracking
--Reactive maintenance at 38-50% with no visibility into the ratio driving emergency costs
--PM compliance at 51% average -- no automated tracking, no escalation before deadlines pass
--End-of-month KPI compilation requiring 2-3 staff-days of spreadsheet work per portfolio review
--Capital requests rejected without condition-based evidence for council or investor submission
After Oxmaint KPI Dashboard
+Reactive maintenance down to 14-18% within 12 months of PM program enforcement
+PM compliance at 89%+ -- automated scheduling with escalating deadline alerts at 30, 7, and 1 day
+KPIs updated in real time -- management decisions made on current data, not last month's spreadsheet
+88% capital request approval rate using FCI-backed condition evidence from Oxmaint asset records
Frequently Asked Questions: FM KPIs
QWhich FM KPIs should I prioritize if my team is just starting to measure performance?
QHow often should FM KPIs be reviewed and reported?
Operational KPIs (reactive ratio, PM compliance, WO completion) weekly by the maintenance manager. Portfolio KPIs (cost per sqft, EUI, tenant satisfaction) monthly by the FM director. Capital and compliance KPIs quarterly to leadership. Oxmaint automates all three cadences.
Book a demo to configure reporting cadences for your team structure.
QWhat is a realistic timeline to improve FM KPIs after implementing a CMMS?
QHow do I benchmark my FM KPIs against industry standards without purchasing IFMA data?
Continue Reading
HVAC Maintenance Checklist: Seasonal PM Guide for FacilitiesSpring, summer, fall and winter PM tasks for rooftop units, AHUs, chillers and VRF systems with frequency and priority ratings.
Click here to read more
Electrical Systems PM Checklist: Commercial Facility GuidePanels, transformers, generators, UPS systems and thermal imaging -- complete electrical PM checklist with Critical, Action and Monitor priority ratings.
Click here to read more
Plumbing Inspection and Maintenance Checklist for FacilitiesBackflow testing, water heater PM, drainage inspection and leak detection -- zone-by-zone plumbing checklist for facility managers.
Click here to read more
Commercial Roof Inspection Checklist: Maintenance and PM GuideMembrane, flashing, drainage, penetrations and seasonal inspection requirements -- complete commercial roof checklist with severity ratings.
Click here to read more
Turn FM KPIs from Monthly Spreadsheets into Real-Time Intelligence
Oxmaint tracks all 25 KPIs from the work your team is already doing -- no parallel data entry, no manual calculations. Every metric available in real time, every report exportable in one click.
25 FM KPIs Tracked Automatically
Real-Time Dashboard
One-Click Reporting
IFMA Benchmark Overlays