Predictive maintenance pays back quickly in some buildings and slowly in others, and the sensors are rarely the reason. The difference comes from what a failure costs, how often critical equipment drifts toward failure, and how early a warning changes the outcome. This guide sets out planning payback windows by building type, shows the arithmetic behind them, and explains how a maintenance management platform like Oxmaint turns condition alerts into savings you can measure.
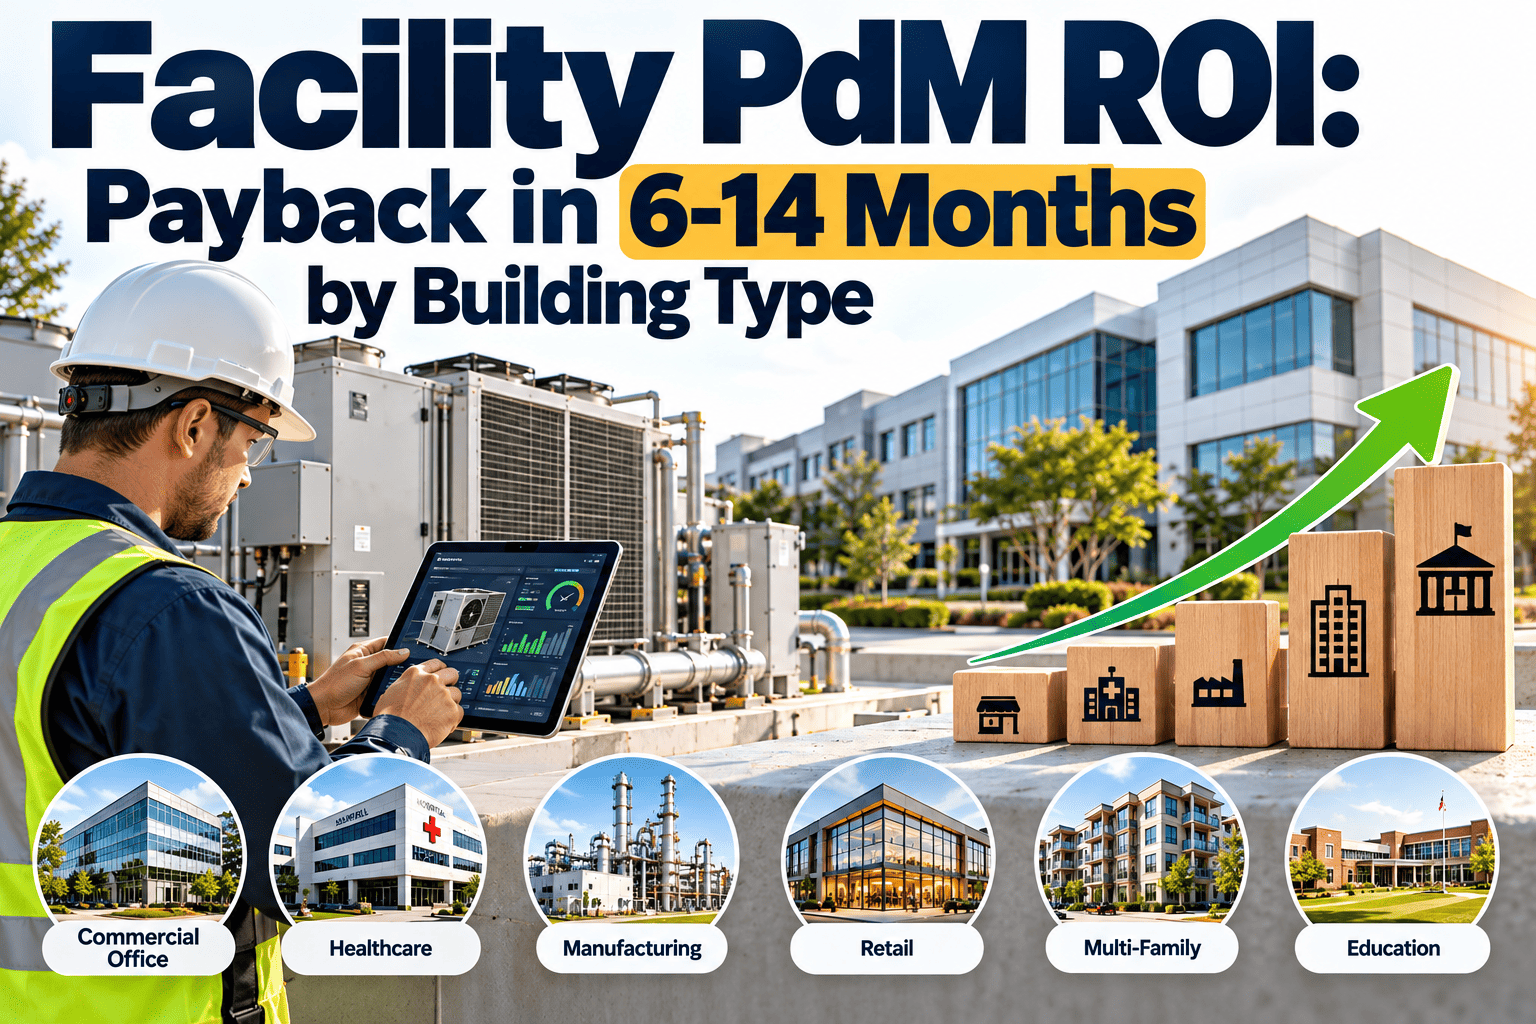
Facility PdM ROI: Payback in 6–14 Months by Building Type
Payback depends on what a failure costs in your building, not on how much technology you install. Use the planning windows below to size a business case, then replace them with your own baseline.
Why Identical Sensors Return Different Payback in Different Buildings
Return on predictive maintenance is a product of three variables. Change any one of them and the payback window moves, even when the hardware and software are identical.
Three questions that set your window
- What does one hour of failure in the most critical system cost your organization, in money and in consequences?
- How many of your annual breakdowns showed a measurable warning sign for days or weeks beforehand?
- Can your team act on a warning within the window, with parts, people, and access to the asset?
Planning Payback Windows by Building Type
The table compares four common commercial building types on the factors that drive the equation above. Scroll sideways on small screens to see every column.
| Building type | What a failure costs | First-wave PdM assets | Main savings lever | Planning payback |
|---|---|---|---|---|
| Data center | Service-level penalties, customer impact, and rapid escalation from a single cooling or power fault | Chillers, CRAH units, UPS batteries, generators, switchgear | Avoided outages and thermal events | 6–9 months |
| Hospital | Patient safety exposure, accreditation findings, and mandatory contingency operations | Chillers, air handlers, pumps, emergency generators, medical gas compressors | Avoided critical-system failures and inspection readiness | 7–11 months |
| Hotel | Room outages, guest relocation, compensation, and reputation damage during peak occupancy | Boilers, chillers, pool and laundry equipment, kitchen refrigeration, elevators | Avoided guest-facing failures plus energy waste | 9–12 months |
| Office building | Tenant comfort complaints, lease friction, and emergency service premiums | Rooftop units, chillers, cooling towers, pumps, elevators | Energy savings and fewer emergency callouts | 11–14 months |
Building by Building: What Speeds Payback and What Slows It
Data centers
Fastest window- Very high cost per minute of downtime, so one avoided event can cover the program.
- Cooling and power assets already generate data from building management and power monitoring systems.
- Strict change-control rules can delay sensor installation on live equipment.
- Redundant N+1 designs mean some failures never reach the customer, which makes avoided cost harder to prove.
Hospitals
Compliance-driven value- Life-safety and critical HVAC systems already require documented inspection and testing, so records double as ROI evidence.
- Failures force costly contingency operations, which raises the value of every avoided event.
- Infection-control rules restrict access to ceilings, mechanical rooms, and patient areas.
- Large, mixed-age campuses need a longer asset-data cleanup before alerts are trustworthy.
Hotels
Guest impact and energy- Guest-facing failures such as hot water loss or chiller trips carry direct compensation and reputation cost.
- Central plant efficiency gains show up quickly on utility bills.
- Seasonal occupancy makes baselines noisy, so models need a full cycle to learn normal behavior.
- Lean engineering teams may struggle to act on alerts without clear work order routing.
Office buildings
Efficiency-led value- Large rooftop and central plant fleets give many repeatable, monitorable assets.
- Energy waste from degraded equipment is a steady, measurable saving.
- Outages are disruptive but rarely catastrophic, so the avoided cost per event is lower.
- Tenant-controlled spaces and shared ownership can split the benefit from the cost.
What One Avoided Failure Looks Like
The clearest way to see the savings is to follow a single failing chilled water pump through both maintenance approaches.
- Bearing wear develops unnoticed between quarterly rounds.
- The pump seizes during a heat wave, when the load is highest.
- Emergency contractor arrives at premium rates, parts are expedited.
- Standby equipment runs hard, raising the risk of a second failure.
- Occupants or guests feel the outage before the repair finishes.
- Vibration and temperature trend past a threshold weeks ahead.
- A work order is generated with the asset history attached.
- Parts are ordered at normal lead time and stocked before the repair.
- Technicians swap the bearing in a planned window on a mild day.
- Cost, downtime, and the failure record close out in one tracked job.
Where predictive maintenance sits among the four strategies
| Strategy | What triggers the work | Main trade-off |
|---|---|---|
| Reactive | The asset fails | No monitoring cost, but the highest downtime and secondary damage |
| Preventive | A calendar or run-hour interval | Reduces surprises, yet parts and labor are often replaced too early |
| Condition-based | A simple rule on a measured value | Acts on real condition, but fixed limits can miss slow, load-dependent drift |
| Predictive | A model estimating remaining useful life | Runs assets as long as safely possible, at the cost of data and tuning effort |
Turn Condition Alerts Into Tracked, Costed Work Orders
Build the Business Case in Five Steps
Worked example with hypothetical figures
| Line item, 250-room hotel | Hypothetical value |
|---|---|
| Sensors and gateways on critical assets | $30,000 |
| Software, integration, and setup | $14,000 |
| Training and process design | $6,000 |
| First-year program cost | $50,000 |
| Avoided emergency callouts (8 events) | $20,000 per year |
| Energy savings from degraded equipment caught early | $14,000 per year |
| Avoided guest relocation and compensation | $8,000 per year |
| Reduced overtime and expedited parts | $12,000 per year |
| Annual avoided cost (about $4,500 per month) | $54,000 per year |
| Payback: $50,000 ÷ $4,500 | About 11 months |
Benefits that payback math usually leaves out
- Longer asset life, which defers capital replacement of chillers, pumps, and air handlers.
- Stronger documentation for insurers, auditors, and warranty claims.
- Less overtime and fewer after-hours callouts, which supports staff retention.
- Better capital planning, because condition data shows which assets are approaching end of life.
The Cost Side: What Actually Goes Into the Denominator
Business cases fail more often from an understated cost than an overstated saving. Count every line below before you divide.
What Published Research Does and Does Not Support
Deloitte's widely cited analysis of predictive maintenance reports three headline ranges. They were developed largely from industrial settings.
Cautions before you borrow the numbers
- Factory equipment runs continuously and earns revenue per hour. Buildings rarely do, so translate uptime into your own cost of failure.
- Percentages describe what mature programs achieved, not what a first pilot will deliver.
- Savings only count if a technician acts on the alert. Sensors without a response workflow produce data, not returns.
- Some industrial analyses cite payback periods of 12 to 18 months or more for broad deployments, which is why narrow first-wave scoping matters.
A Rollout Timeline That Reaches Payback Without Overbuilding
Why Some Programs Miss Their Payback
Programs that fall short usually share a handful of avoidable causes. The matrix below pairs each with the symptom you would see and the correction.
| Failure pattern | What you will see | Correction |
|---|---|---|
| Monitoring everything at once | Thousands of data points, no clear ownership, alerts ignored | Limit the pilot to one high-consequence asset class |
| No response workflow | Alerts sit in a dashboard while failures still happen | Route every confirmed alert into a corrective work order with a deadline |
| Weak asset data | Duplicate assets, missing locations, no failure history | Clean the register and tag assets before installing sensors |
| Unproven baseline | Finance disputes the savings because there is no before-and-after comparison | Record twelve months of emergency cost and hours before launch |
| Alert fatigue | Technicians stop trusting the system after repeated false alarms | Tune thresholds with technician feedback and track false alarm rate |
Where the technology is heading
- Battery-powered wireless sensors have reduced installation labor, which shortens payback on older buildings without existing wiring.
- Anomaly-detection models learn each asset's normal behavior at a given load and outdoor temperature, which cuts false alarms compared with fixed limits.
- Integration between monitoring data and the CMMS is becoming a baseline expectation, since an alert without a work order does not save money.
How Oxmaint Supports a Facility PdM Program
Predictive signals only create value when they connect to planned work. Oxmaint provides the workflow layer that closes that loop.
KPIs That Prove the Payback
Finance will ask for evidence at the six and twelve month marks. Track these measures from the day the pilot starts, so the before-and-after comparison is ready.