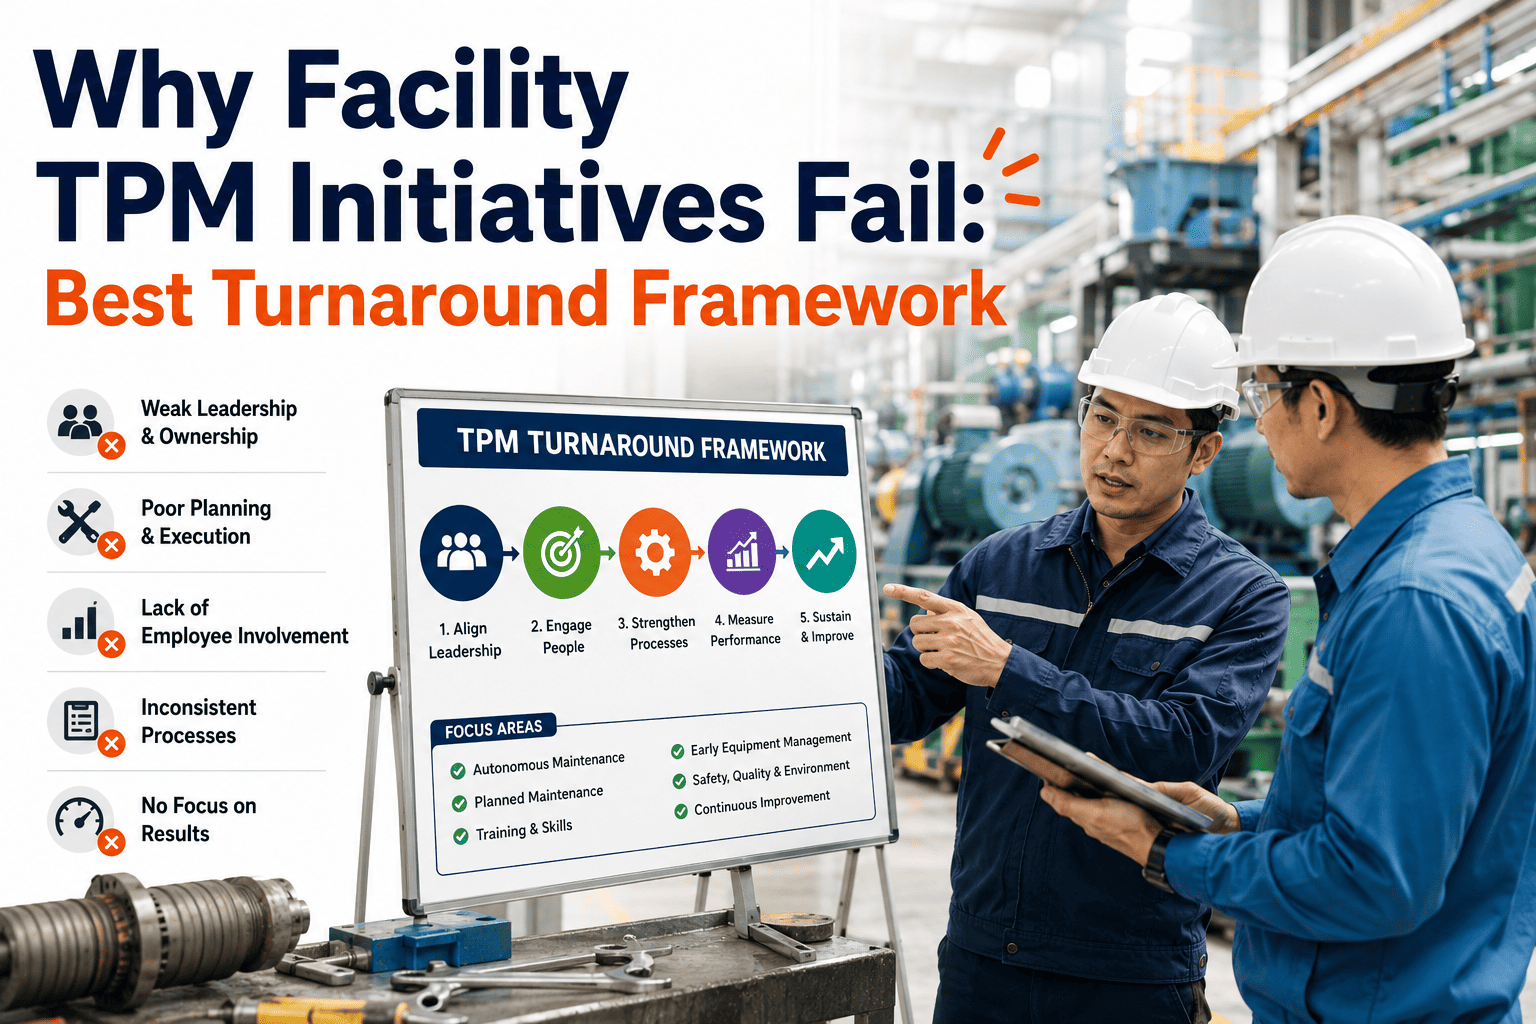
Facility TPM initiatives fail at an alarming rate — industry studies consistently show that roughly 70% of Total Productive Maintenance programs stall or collapse within the first 12 months, leaving facility managers with wasted budgets and disillusioned teams. The root cause is rarely a lack of commitment; it is almost always the absence of a structured turnaround framework backed by the right CMMS software to sustain operator engagement, track autonomous maintenance, and measure pillar-level progress. This guide breaks down exactly why facility TPM failure happens, presents the best TPM turnaround framework for 2026, and shows how a purpose-built platform like OxMaint revives stalled programs before they become permanent losses. If your facility TPM initiative is already showing cracks, Start Free Trial and see how OxMaint's AI-powered CMMS rebuilds momentum from day one.
Why Do 70% of Facility TPM Initiatives Fail in Year One?
The answer is not culture, budget, or leadership buy-in — it is the missing operational backbone. Without a CMMS tracking every pillar, audit, and Kaizen action, even the best-designed TPM program dissolves into spreadsheets and good intentions. Here is the framework that fixes it.
The 5 Structural Reasons Facility TPM Initiatives Fail
Research across manufacturing and facility management consistently identifies five failure patterns that account for over 85% of stalled TPM programs. Each one is preventable with the right turnaround framework and CMMS backbone.
No Digital System of Record
TPM generates hundreds of data points weekly — CIL checks, one-point lessons, Kaizen logs, pillar audit scores. When this lives in binders and whiteboards, it becomes invisible within 90 days. Teams lose the thread, and leadership loses visibility into whether the program is working.
Autonomous Maintenance Without Accountability
Step 1 through Step 3 of autonomous maintenance (initial cleaning, contamination control, provisional standards) require operators to complete and log inspections daily. Without mobile checklists and completion tracking, compliance rates drop below 40% by month three — and the pillar quietly dies.
Kaizen Actions That Go Nowhere
The average TPM pilot generates 15–25 improvement suggestions per operator per year. When these land in a suggestion box or spreadsheet with no assignment, deadline, or status tracking, operators stop submitting them. Engagement collapses, and the continuous improvement engine stalls.
No Pillar-Level Metrics
TPM demands measurement across eight pillars — but most facilities track only OEE. Without planned maintenance compliance, MTBF trends, training completion rates, and early management milestones visible in one dashboard, leadership cannot see which pillar is failing until the whole program follows.
Pilot Success That Never Scales
A model line or model area shows impressive results — OEE jumps 15–20 points, breakdowns drop 60%. But scaling to the full facility requires replicating standards, training matrices, and audit schedules across every line and shift. Without a CMMS to template and deploy these, the pilot stays an island.
Best TPM Turnaround Framework: The 4-Phase Recovery Model
Facilities that successfully revive a stalled TPM program follow a consistent four-phase sequence. Each phase has a defined timeline, measurable exit criteria, and specific CMMS capabilities that make it stick.
Diagnose and Digitize
Audit the current state: which pillars are active, which have lapsed, and where data gaps exist. Migrate every TPM artifact — CIL standards, one-point lessons, Kaizen logs, training records, PM plans — into a CMMS. This creates the single source of truth the program has been missing. Exit criteria: 100% of active assets tagged with QR codes, all PM schedules digitized, baseline OEE and MTBF captured.
Rebuild Autonomous Maintenance
Relaunch Steps 1–3 with mobile digital checklists that operators complete on the floor. Every cleaning, inspection, and lubrication task is assigned, timestamped, and photo-verified. Completion rates are visible to supervisors in real time. Exit criteria: CIL completion rate above 85% for four consecutive weeks, abnormality tags being logged and resolved through work orders.
Reactivate Kaizen and Focused Improvement
Route every improvement suggestion into a structured workflow with assignment, priority, deadline, and status. Track Kaizen implementation rate and cost savings per action. Launch focused improvement teams on the top three loss categories identified from CMMS downtime data. Exit criteria: Kaizen implementation rate above 60%, measurable OEE improvement of 5+ points on target equipment.
Scale and Sustain
Template the revived standards and deploy them across all lines, shifts, and sites. Activate planned maintenance, quality maintenance, and early management pillars with CMMS-driven schedules and milestone tracking. Set up pillar-level dashboards for leadership reviews. Exit criteria: all eight pillars active with assigned owners, monthly TPM audit scores trending upward, OEE improvement of 10+ points facility-wide.
What a TPM Turnaround Looks Like in Practice
Consider a 200-asset food processing facility that launched TPM 14 months ago. The model line showed early promise — OEE climbed from 58% to 71% — but the program stalled when the TPM coordinator left and the paper-based system collapsed.
- CIL completion rate: 34% (paper checklists, no verification)
- Kaizen suggestions implemented: 12% (no tracking workflow)
- Unplanned downtime: 22 hours/month across critical assets
- PM compliance: 61% (schedules in a shared spreadsheet)
- Facility-wide OEE: 54% and declining
- Annual reactive maintenance cost: $186K
- CIL completion rate: 91% (mobile checklists with photo proof)
- Kaizen suggestions implemented: 67% (assigned workflow with deadlines)
- Unplanned downtime: 9 hours/month (59% reduction)
- PM compliance: 96% (automated scheduling and escalation)
- Facility-wide OEE: 68% and trending upward
- Annual reactive maintenance cost: $98K (47% reduction)
The difference between a TPM program that dies and one that delivers is not effort — it is infrastructure. When every pillar, every check, and every improvement action lives in a system that tracks, reminds, and reports, the program sustains itself.
See How OxMaint Revives Stalled TPM Programs
Book a 30-minute live demo and we will walk through the exact turnaround framework on your asset structure — CIL digitization, Kaizen workflows, pillar dashboards, and OEE tracking.
How OxMaint Powers Every Phase of Your TPM Turnaround
OxMaint is not a generic CMMS bolted onto a TPM program — it is the operational backbone that makes each pillar measurable, accountable, and scalable. Here is how specific capabilities map to the failure points above.
Digital CIL and Autonomous Maintenance
Mobile checklists with photo verification, QR-code asset scanning, and real-time completion dashboards push CIL compliance above 85% — the threshold where autonomous maintenance becomes self-sustaining. Offline mode ensures operators log checks even in dead zones.
Kaizen Workflow Engine
Every improvement suggestion enters a structured pipeline — submitted, reviewed, assigned, implemented, verified — with automatic notifications and escalation. Facilities using OxMaint see Kaizen implementation rates climb from under 15% to above 60% within two quarters.
Pillar-Level TPM Dashboards
Track OEE, MTBF, MTTR, PM compliance, training completion, and audit scores across all eight TPM pillars in one view. Leadership sees exactly which pillar needs attention — before it drags the whole program down. Custom reports generate in minutes for JIPM or internal audits.
AI-Powered Predictive Maintenance
IoT sensor integrations and AI failure prediction catch equipment degradation before it causes unplanned downtime — feeding directly into the planned maintenance pillar. Facilities typically reduce unplanned downtime 30–50% within the first year, freeing technician hours for TPM activities.
Best TPM Turnaround CMMS 2026: What to Look For
Not every CMMS supports TPM natively. When evaluating the best TPM turnaround platform for your facility, these are the capabilities that separate genuine TPM enablers from generic work order tools.
| Capability | Why It Matters for TPM | OxMaint | Generic CMMS |
|---|---|---|---|
| Mobile CIL checklists with photo proof | Autonomous maintenance Steps 1–3 require verified daily operator checks | Built-in, offline-capable | Often requires add-on or paper fallback |
| Kaizen / improvement action tracking | Focused improvement pillar dies without a structured suggestion-to-implementation workflow | Native workflow with assignment and escalation | Rarely included; usually a separate tool |
| OEE and pillar-level dashboards | TPM demands measurement across 8 pillars, not just work order counts | Real-time OEE, MTBF, MTTR, PM compliance, audit scores | Basic work order reports only |
| QR asset tagging and scanning | Operators must access asset history, standards, and checks at the machine | One-scan access to full asset profile | Sometimes available; often clunky |
| Multi-site templating and deployment | Scaling TPM from model line to full facility requires replicable standards | Template PM plans, checklists, and standards across sites | Manual re-creation per site |
| AI predictive maintenance and IoT | Planned maintenance pillar needs condition-based triggers, not just calendar PMs | AI failure prediction with sensor integrations | Calendar-based PM only |
Facility TPM Turnaround: Common Questions Answered
Why do most facility TPM initiatives fail within the first year?
The primary reason is the absence of a digital system to sustain the program. TPM generates massive operational data — CIL checks, Kaizen actions, audit scores, training records — and when this lives on paper or in spreadsheets, visibility collapses within 90 days. Without accountability tracking, operator engagement drops, leadership loses confidence, and the program stalls. A CMMS like OxMaint provides the backbone that keeps every pillar alive.
Can a stalled TPM program be revived, or should we start over?
A stalled TPM program can almost always be revived — and restarting from scratch is usually a mistake. The turnaround framework above (Diagnose, Rebuild, Reactivate, Scale) leverages whatever foundation remains: trained operators, existing standards, model line results. Most facilities see measurable improvement within 10 weeks of digitizing their TPM processes. Book a Demo to see how the framework maps to your current state.
What is the best CMMS for TPM turnaround in 2026?
The best TPM turnaround CMMS combines mobile CIL checklists, Kaizen workflow tracking, pillar-level OEE dashboards, QR asset tagging, and AI predictive maintenance in one platform. OxMaint delivers all of these natively, with offline mobile apps and multi-site templating that let you scale from a single model line to an entire facility network without re-building standards.
How long does a TPM turnaround take?
A structured TPM turnaround typically takes 4–6 months to reach self-sustaining momentum. Phase 1 (digitization) takes 2–4 weeks, Phase 2 (rebuilding autonomous maintenance) takes 4–6 weeks, and Phases 3–4 (Kaizen reactivation and scaling) take another 8–12 weeks. Facilities using a CMMS report reaching 85%+ CIL compliance and 5+ point OEE improvement within the first 10 weeks.
What ROI can we expect from reviving our TPM program with a CMMS?
Facilities that successfully turn around TPM with a CMMS typically see 30–50% reduction in unplanned downtime, 40–60% improvement in PM compliance, and 10–15 point OEE gains within 6–12 months. For a mid-size facility spending $150K–$200K annually on reactive maintenance, that translates to $60K–$100K in avoided costs — a payback period of under 6 months on the software investment. Start Free Trial and measure the impact on your own assets.
Your TPM Program Deserves a System That Sustains It
Join hundreds of facility teams using OxMaint to digitize autonomous maintenance, track Kaizen actions, monitor pillar-level OEE, and turn stalled TPM initiatives into measurable results.
Free 14-day trial · No credit card required · Set up in under 30 minutes