Cost per square foot has been the default facility benchmark for decades, and it still has value. But it treats an empty floor and a packed floor as identical. As hybrid work changes how many people use a building on any given day, two offices with the same area and the same spend can deliver very different value per person. Cost per occupant adds the missing half of the picture. This guide explains the metric, shows how to calculate it, and describes how Oxmaint facility maintenance software can supply the cost data behind it.
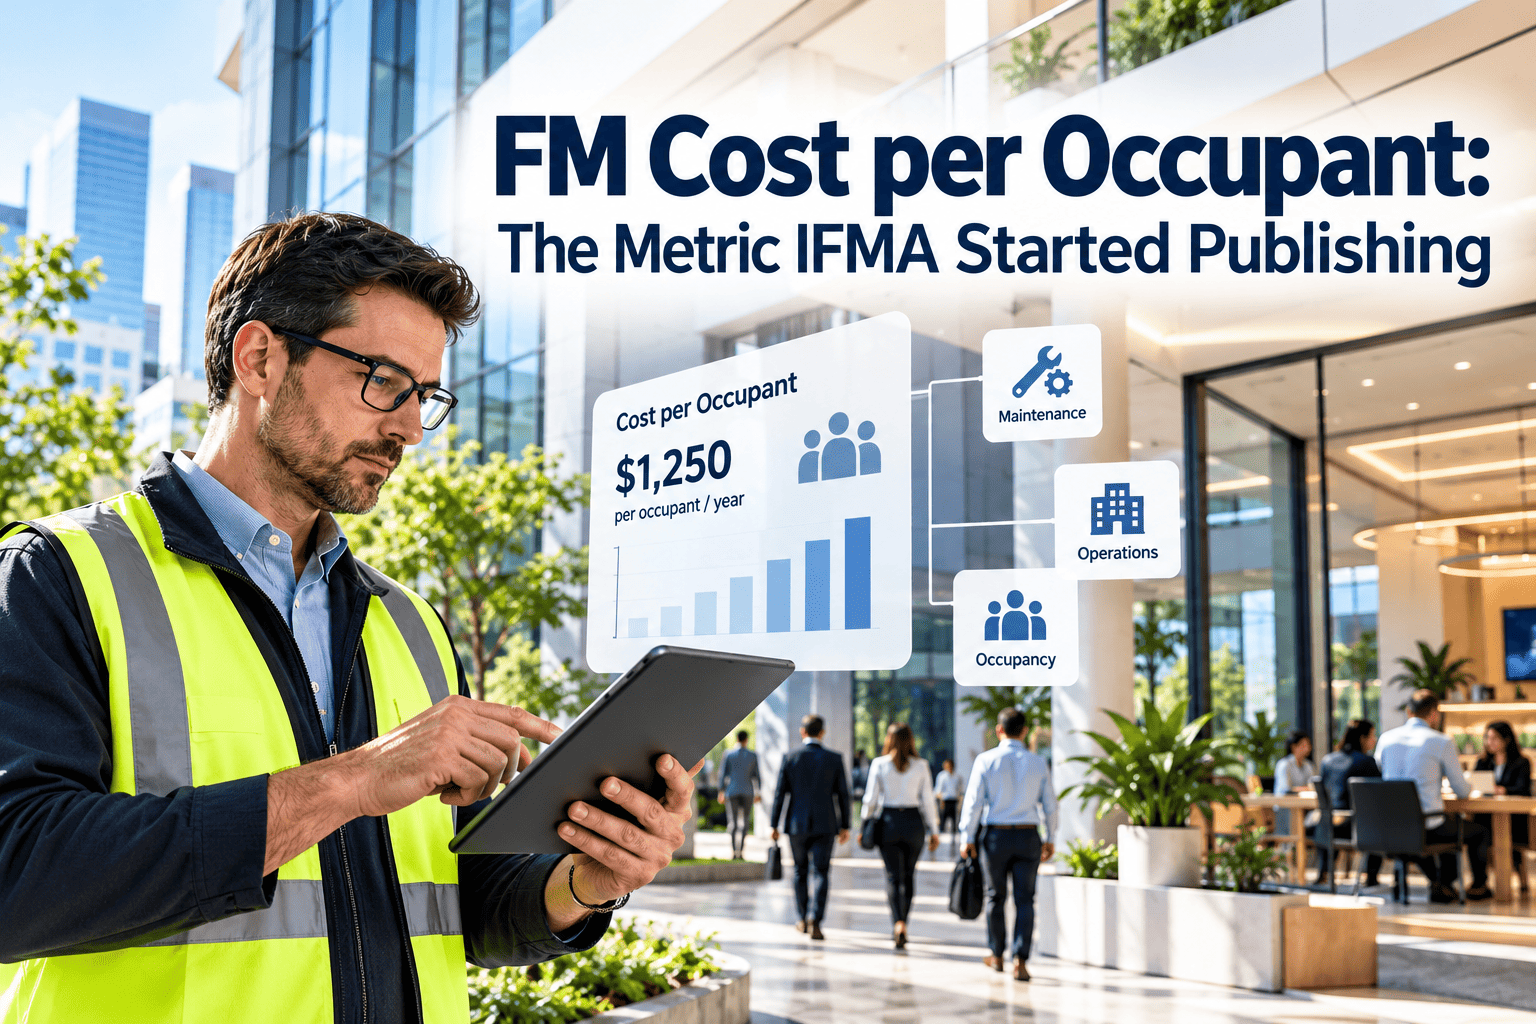
FM Cost per Occupant: The Metric IFMA Started Publishing
See whether space or occupant intensity is driving your facility spend, and benchmark it in a way that reflects how buildings are actually used.
Two Buildings, Same Area, Different Story
The numbers below are illustrative. They show why the same cost per square foot can hide very different results.
| Measure | Building A | Building B |
|---|---|---|
| Area | 100,000 sq ft | 100,000 sq ft |
| Annual FM cost | $800,000 | $800,000 |
| Cost per sq ft | $8.00 | $8.00 |
| Average occupants | 500 | 250 |
| Cost per occupant | $1,600 | $3,200 |
Cost per square foot calls these buildings equal. Cost per occupant shows Building B spending twice as much to support each person.
Reading the Metric: Space Versus Occupant Drivers
Which Costs Scale With People and Which With Space
- Janitorial and restroom supplies
- Waste and recycling volume
- Food service and amenities
- Help desk and service requests
- Security and reception staffing
- Building systems and equipment upkeep
- Roof, envelope, and structure
- Utilities base load and HVAC conditioning
- Insurance and property taxes
- Planned and preventive maintenance
Most buildings have a large fixed cost base. When occupancy falls, cost per occupant rises even when spend is flat.
Get Cost Data You Can Divide by Anything
Track maintenance spend by building, asset, and category so you can report it per square foot, per occupant, or per seat.
How to Calculate Cost per Occupant
Choosing the Occupant Count
| Occupant basis | Strength | Weakness |
|---|---|---|
| Total headcount | Easy to obtain from HR | Ignores hybrid and remote patterns |
| Average daily badge-ins | Reflects real presence | Needs access control data and cleaning |
| Peak occupancy | Shows capacity pressure | Overstates typical use |
| Assigned seats | Useful for workplace planning | Does not show actual attendance |
Whatever you choose, publish the definition. Benchmarks are only comparable when the denominator is the same.
Common Mistakes When Benchmarking
Questions the metric should trigger
- Which categories grew while occupancy fell?
- Are we maintaining space nobody uses?
- Do service levels match actual building population?
- Would consolidation reduce cost per occupant without hurting service?
Where the Cost Data Comes From
Cost per occupant is only as accurate as the cost records behind it. Maintenance is a large and often poorly tracked share.
Cost per Occupant FAQs
Should I replace cost per square foot?
Is cost per occupant the same as cost per seat?
How do I handle hybrid work?
What is a good benchmark value?
Can I track it across many buildings?
Why Cost per Square Foot Alone Misleads
Area-based cost has real strengths. It is simple, widely published, and easy to compare. Its weakness is that it assumes the building is used at a steady, comparable intensity, which is rarely true now.
- Hybrid schedules mean many offices hold fewer people on a typical day than their design capacity.
- Consolidations can reduce headcount in a building without reducing its area or fixed systems.
- Growth can raise occupancy sharply while area cost per square foot appears to improve.
- Different building types, such as labs, call centers, and corporate offices, carry very different occupant densities.
What a leader actually asks
- What does it cost us to support each employee who uses this site?
- Are we paying to condition and maintain space nobody needs?
- Which locations deserve investment and which deserve consolidation?
Build a Metric Set, Not a Single Number
| Metric | Formula | Question it answers |
|---|---|---|
| Cost per square foot | FM cost / gross or rentable area | How efficiently is the space maintained? |
| Cost per occupant | FM cost / average occupants | What does it cost to support each person? |
| Square feet per occupant | Area / average occupants | How densely is the space used? |
| Utilization rate | Average occupants / capacity | How much of the space is actually used? |
| Maintenance cost per occupant | Maintenance spend / average occupants | Is upkeep scaling with building use? |
| Reactive share | Corrective cost / total maintenance cost | Is spend planned or driven by failures? |
Read these together. A rising cost per occupant with falling area cost is a different story from the reverse.
Worked Example: Same Spend, Falling Occupancy
The following figures are illustrative. A site spends the same amount for three years while attendance changes.
| Year | Annual FM cost | Average occupants | Cost per occupant |
|---|---|---|---|
| Year 1 | $600,000 | 600 | $1,000 |
| Year 2 | $600,000 | 450 | $1,333 |
| Year 3 | $600,000 | 300 | $2,000 |
- Cost per square foot did not change, so a square-foot report would show no problem.
- Cost per occupant doubled, which signals space that is increasingly underused.
- The response may be consolidating floors, adjusting service levels, or sharing space, not cutting maintenance quality.
Occupancy Data: Sources and Cautions
Actions When Cost per Occupant Runs High
Maintenance Within the Metric
Maintenance is a fixed-leaning cost, which means it rarely shrinks when occupancy falls. Understanding it separately prevents the wrong cuts.
- Preventive maintenance on core systems usually must continue regardless of attendance.
- Cutting planned maintenance to improve the ratio often creates reactive cost later.
- Zones that are closed or lightly used may support reduced schedules, if risks are assessed.
- Equipment serving unused space may be candidates for shutdown, retirement, or reduced operation.
Data to collect for each building
- Planned versus reactive maintenance spend.
- Cost by system, such as HVAC, electrical, plumbing, and envelope.
- Vendor spend by trade and contract.
- Work order volume and average cost per order.
- Asset age and condition for major equipment.
Reporting Cost per Occupant to Leadership
Credibility comes from consistent definitions. A modest metric you can defend beats a dramatic one you cannot.
Benchmarking Cost per Occupant Responsibly
Published benchmarks are useful starting points, but they rarely match your buildings exactly. Treat them as context rather than targets.
- Compare buildings of similar type, age, climate, and service level.
- Confirm that cost categories in the benchmark match your own scope.
- Check whether the benchmark uses headcount, seats, or attendance as the occupant basis.
- Look at your own trend first, since your history is the most comparable dataset you have.
- Investigate outliers before judging them, because high cost can reflect a justified service level.
Adjustments that make comparisons fairer
- Normalize for operating hours, especially for sites running multiple shifts.
- Separate leased services from owned systems where responsibilities differ.
- Remove one-time capital projects from operating cost comparisons.
- Note special spaces such as data rooms, labs, or amenity floors that distort the average.
Putting the Metric to Work in Planning
Cost per Occupant FAQs in Practice: Scenarios
| Scenario | What the metric shows | Sensible response |
|---|---|---|
| Hybrid shift cuts attendance by a third | Cost per occupant rises while cost per square foot is flat | Review service frequency and space use before cutting core maintenance |
| New tenant fills vacant floors | Cost per occupant falls as fixed costs spread across more people | Confirm service levels still match higher demand |
| Major equipment failure year | Cost per occupant spikes from reactive repairs | Separate one-time repairs and review preventive coverage |
| Amenity floor added | Cost per occupant rises from added services | Judge whether the amenity value justifies the cost |
Steps to start this quarter
- Agree the cost scope with finance so every building reports the same categories.
- Choose one occupancy source and document how it is calculated.
- Calculate cost per occupant for the last four quarters to see the trend.
- Rank buildings and examine the highest and lowest values for causes.
- Share the first results with operations and agree one action per outlier.
- Repeat each quarter and refine definitions as data quality improves.
Key Takeaways for Facility Leaders
- Use cost per square foot and cost per occupant together, never as substitutes.
- Define the cost scope and occupant basis once and apply them to every building.
- Expect fixed costs to push the metric up when occupancy falls.
- Protect preventive maintenance while adjusting services that truly scale with people.
- Investigate outliers before judging them, and attach an owner and action to each.
- Track the trend every quarter, because direction matters more than any single value.
See Cost From the People Side of the Building
Bring maintenance cost, asset history, and work order data into one platform and report it in the units your leadership asks for.