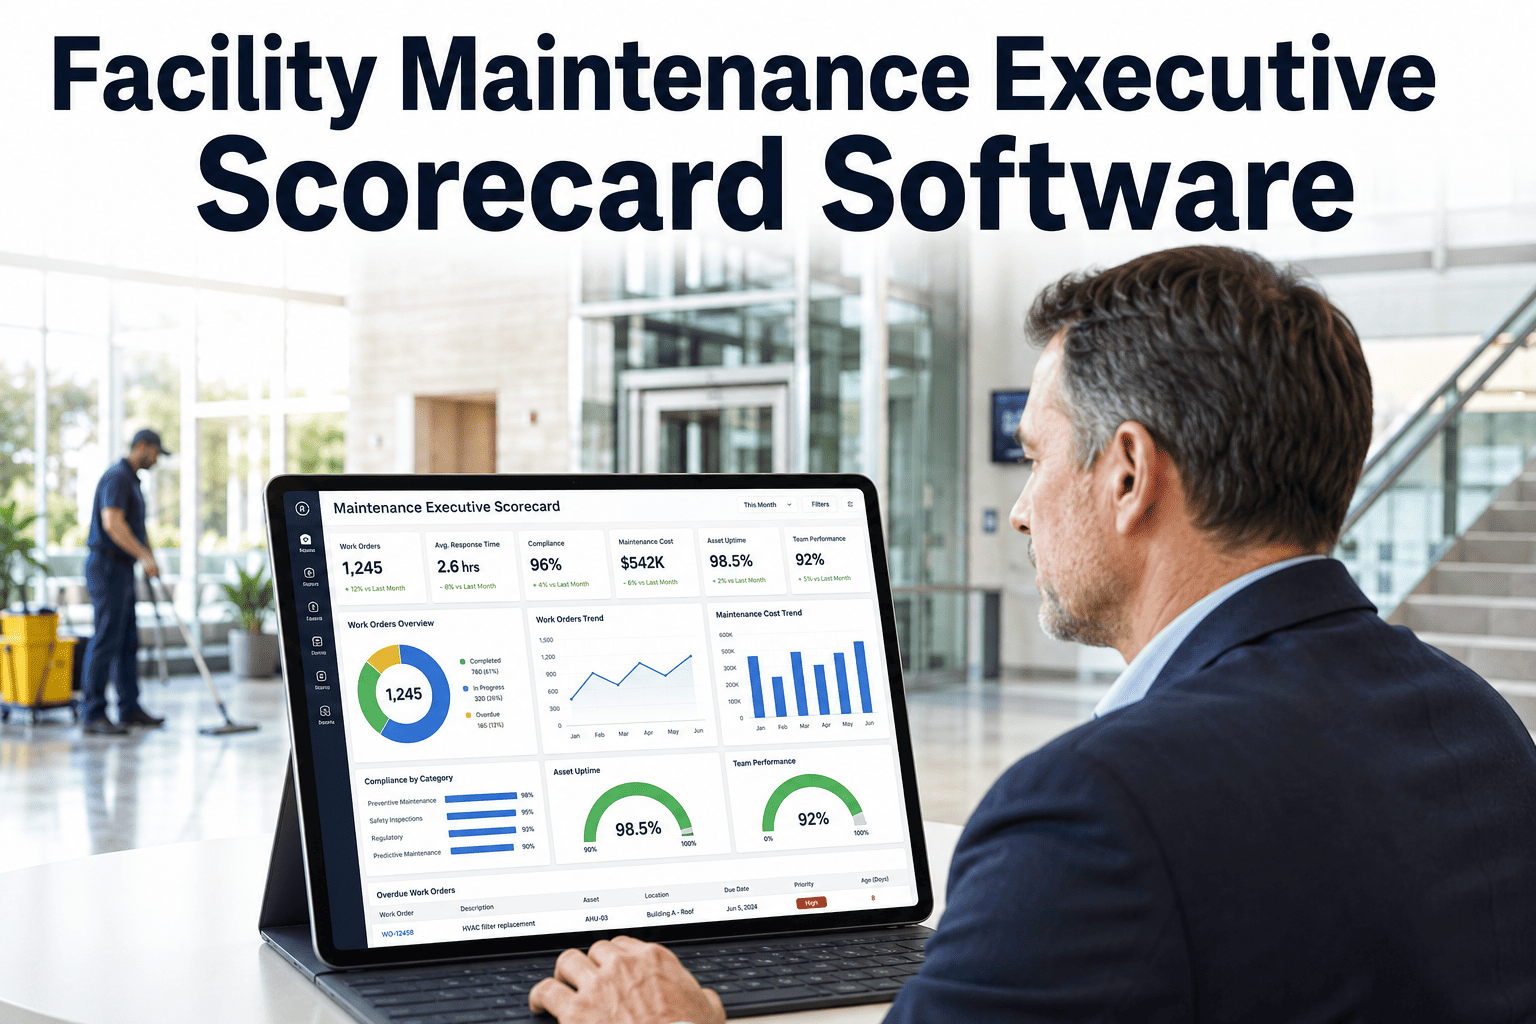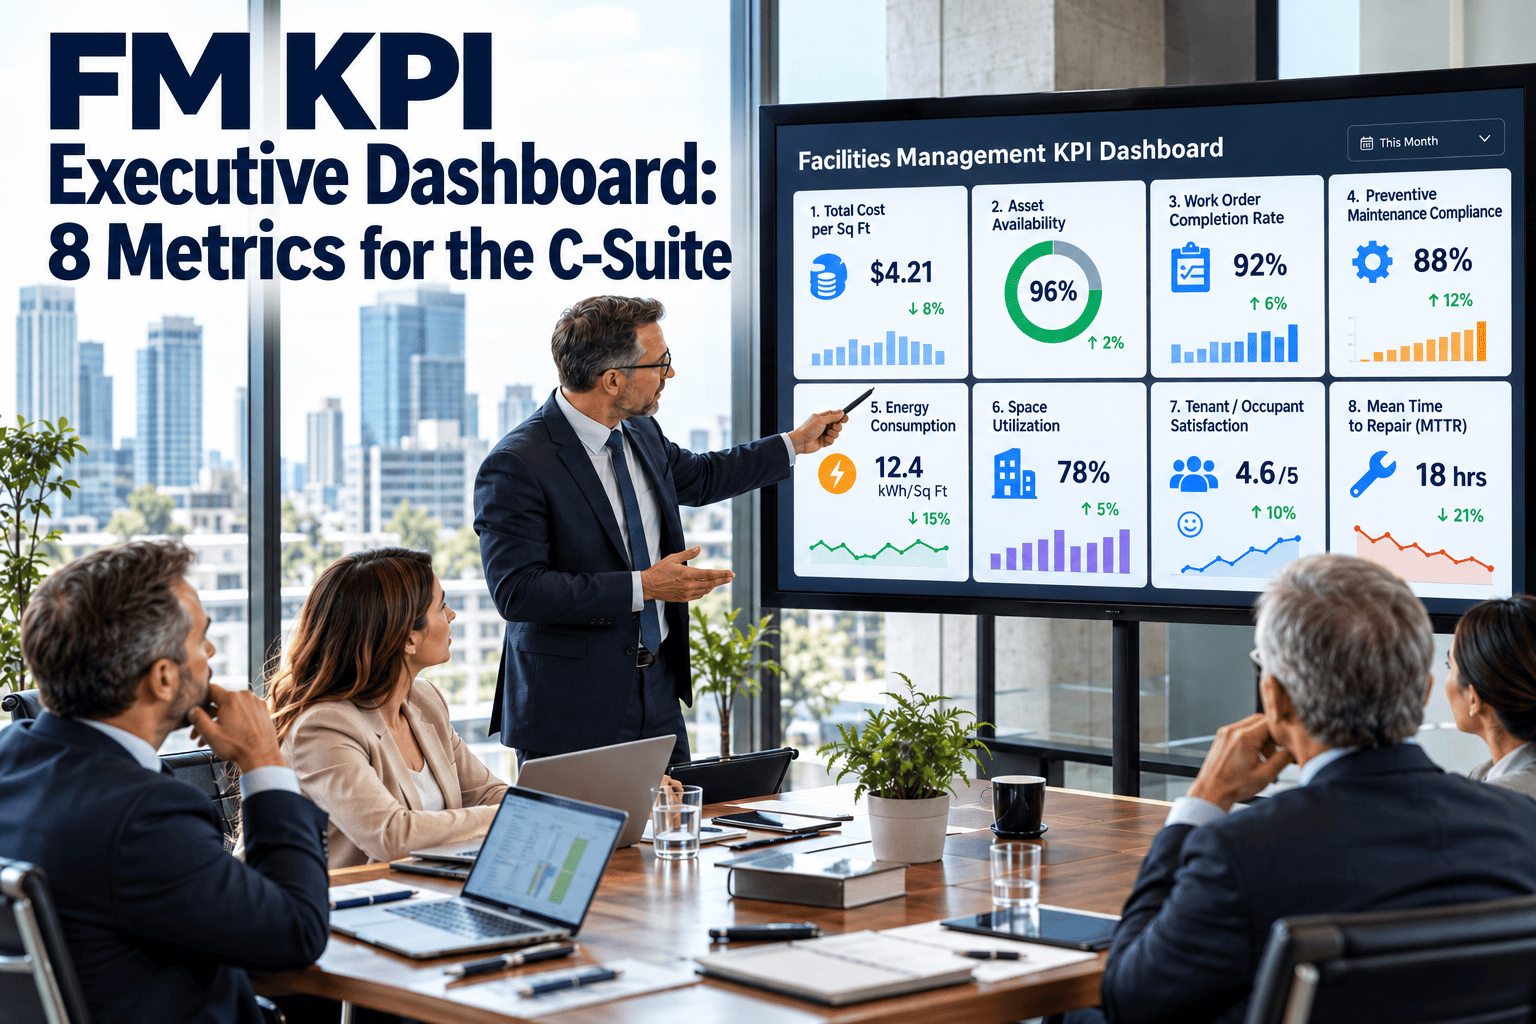
A facilities team can easily produce eighty numbers a month: work order counts, technician hours, energy readings, vendor invoices, ticket categories, inspection scores. Almost none of them survive contact with a board agenda. Executives need a short, stable set of measures that answer four questions: are we spending what we planned, are we compliant, are the buildings working, and are the people inside them satisfied. This guide defines eight such measures, shows how to lay them out on a one-page view, and explains how a CMMS-based reporting setup can feed them from the work records your team already creates.
FM KPI Executive Dashboard: 8 Metrics for the C-Suite
Commercial facility leaders are asked for board-level reporting but hand over operational detail. The fix is a fixed set of eight metrics across spend, compliance, uptime, occupant experience, risk and efficiency, each with a formula, a data source, an owner and a review rhythm.
What the CEO, CFO and Board Actually Ask Facilities
The CEO
Is the portfolio supporting the business, and is anything about to interrupt trading, production or the customer experience? The CEO wants exceptions and trend direction, not ticket queues.
The CFO
Are we inside budget, what is driving variance, and how much future capital is hiding in deferred repairs? The CFO also wants numbers that reconcile to the general ledger.
The Board and Audit Committee
Are statutory obligations met and evidenced, and what are the top building risks? Boards read FM through a risk and assurance lens, so proof of completion matters as much as the percentage.
The COO or Head of Operations
Do sites have the uptime and service levels they need, and are occupants complaining? This reader is the bridge between the FM Director and the rest of the executive team.
Why operational dashboards fail in the boardroom
From 80 Metrics Down to 8
The number eighty is illustrative: it stands for the long list most FM teams accumulate. The funnel below shows the four filters we apply before a metric earns a place in front of executives.
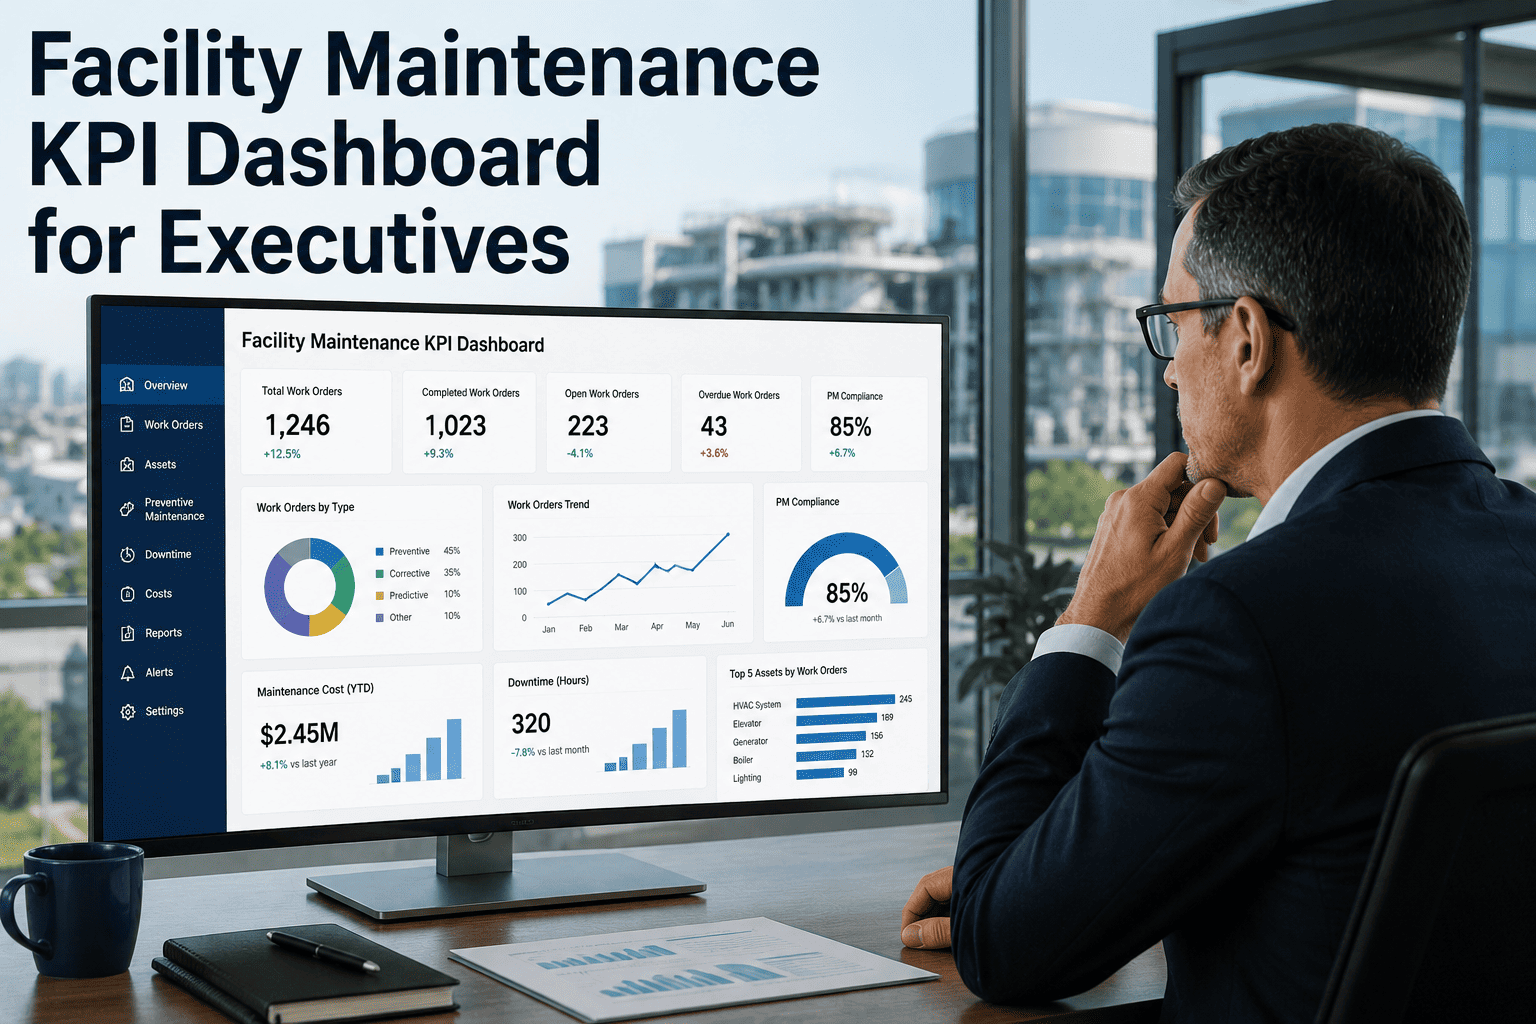
The Mock Executive Dashboard
The Eight Metrics, Defined
Definitions below draw on widely used conventions: SMRP work-management metrics for planned work and PM compliance, the facility condition index used across public and institutional portfolios, and the cost-per-area measures that IFMA and BOMA publish benchmarking around. Always confirm exact formulas against the standard or benchmark you intend to compare with.
FM Cost per Square Foot
Shows how much it costs to operate and maintain each unit of floor area, which lets a CFO compare sites of different size and track efficiency over time.
Budget Variance
Separates a genuine overspend from a timing difference. Pair the percentage with the top three drivers so the board sees the cause, not just the gap.
Statutory and PM Compliance Rate
Combines two proofs: legally required inspections finished on time, and scheduled preventive maintenance completed within its window. Report both components beneath the headline.
Critical Asset Availability
Tracks whether the equipment the business cannot operate without was available when needed, such as chillers in a data hall, lifts in a tower or fire pumps.
Occupant Satisfaction
Measures how people experience the building. A short pulse survey after closed requests, plus a periodic workplace survey, gives both transactional and overall views.
Requests Resolved Within SLA
Turns responsiveness into a single percentage by priority class. It is the operational counterpart to satisfaction and usually moves first.
Deferred Maintenance Backlog and FCI
Quantifies the repair liability being carried forward. The facility condition index expresses it as a share of replacement value so buildings of any size can be compared.
Planned vs Reactive Work Ratio
Indicates whether the team controls its week or is controlled by breakdowns. Measure by labor hours, which is the SMRP convention, and keep spend as a secondary view.
Metric-to-Executive Responsibility Matrix
A metric without an owner becomes a number people discuss rather than act on. Use this matrix as a starting draft, then adjust it to your own reporting lines.
| Metric | CEO | CFO | COO | Risk and Compliance | Board | FM Director |
|---|---|---|---|---|---|---|
| FM cost per sq ft | Informed | Reviews | Informed | None | Informed | Owns |
| Budget variance | Informed | Reviews | Informed | None | Informed | Owns |
| Statutory and PM compliance | Informed | None | Reviews | Reviews | Reviews | Owns |
| Critical asset availability | Reviews | None | Reviews | Informed | Informed | Owns |
| Occupant satisfaction | Reviews | None | Reviews | None | Informed | Owns |
| Requests resolved within SLA | Informed | None | Reviews | None | None | Owns |
| Backlog and FCI | Informed | Reviews | Informed | Reviews | Reviews | Owns |
| Planned vs reactive ratio | None | Informed | Reviews | None | None | Owns |
Red, Amber, Green: A Threshold Guide
Thresholds belong to your organization, not to a blog post. Industry benchmark figures often lack a traceable source, so the guide below defines how to set bands rather than prescribing universal values.
Green: on target
Within the tolerance your executive team approved. No action is needed beyond normal monitoring, and the tile should carry no commentary.
Amber: watch
Outside tolerance, or trending toward it for two consecutive periods. The owner supplies a cause and a recovery date in the pack.
Red: act now
Beyond the escalation limit, or a compliance or safety item is overdue. The owner presents a funded recovery plan at the next meeting.
How to set the bands for each metric
The Monthly Board-Pack Workflow
A dashboard is only trusted if the process behind it is repeatable. This six-block cycle can run on a single working week at month end.
Close the records
Technicians complete open work orders, attach evidence and log downtime. Anything left open is either genuine backlog or a data gap.
Reconcile the cost
Match CMMS labor, parts and contractor cost to the finance ledger so the CFO sees one version of the truth.
Calculate the eight
Run the report with the agreed formulas and period. Never change a definition mid-year without noting it in the pack.
Apply the status
Assign red, amber or green against the approved bands, then check every red and amber has a named owner.
Write the exceptions
Add one or two sentences of cause and action for each non-green tile. Skip commentary on green tiles.
Present and track actions
Log decisions as work orders or projects, so next month the pack shows whether the agreed actions actually closed.
Where Each Metric Comes From in Oxmaint
Most of the eight metrics are by-products of disciplined work management. Oxmaint maintenance management software holds the records; the dashboard is a view of them.
Work orders
Priority, timestamps, labor hours and parts cost support response time, planned vs reactive work and cost roll-ups.
Preventive maintenance
Scheduled tasks with due dates and completion records support the PM side of the compliance rate.
Inspections
Digital inspection forms with pass or fail results and attachments give statutory checks an evidence trail.
Asset management
A register with locations, criticality and history underpins availability, backlog and condition reporting.
Dashboards and reporting
Configurable views and exports let you assemble the eight tiles and share a consistent pack each month.
Compliance records
Completed tasks stay linked to their asset and date, so an auditor can trace a headline figure to its source.
Common Mistakes When Building an FM Executive View
Build Your Eight-Tile Executive View
See how work orders, preventive maintenance, inspections and asset records can feed a repeatable monthly pack your board will trust.
Executive FM Dashboard Sources and Standards
SMRP
Provides widely used maintenance and reliability metric definitions, including planned work percentage and PM compliance.
ISO 41000 family
ISO 41001 frames facility management as a management system with objectives, performance evaluation and improvement.
IFMA
Publishes research and benchmarking on operations and maintenance cost, and encourages choosing KPIs by stakeholder.
BOMA
Defines building area measurement standards and publishes commercial office operating cost benchmarks.
Frequently Asked Questions
Why only eight metrics for the C-suite?
Executives act on exceptions. Eight measures across spend, compliance, uptime, experience, risk and efficiency fit a single page and still cover the questions a board asks.
Can I swap a metric for one that suits my sector?
Yes, if it passes the same three filters: decision value, auditable source and a named owner. Hospitals or airports may replace cost per sq ft with a sector-specific unit.
How often should executives see the dashboard?
Monthly for most tiles and quarterly for FCI and workplace surveys. Compliance exceptions should escalate immediately rather than wait for the pack.
Where does the data come from?
Operational figures come from work orders, PM schedules, inspections and the asset register in a CMMS such as Oxmaint. Budget and survey data come from finance and workplace teams.
Can we see this on our own data first?
You can book a demo to walk through how your assets, work orders and reports would map to the eight tiles.
Give Your Board Eight Numbers It Can Trust
Start with clean work records, agreed definitions and a monthly rhythm, and let the dashboard follow.