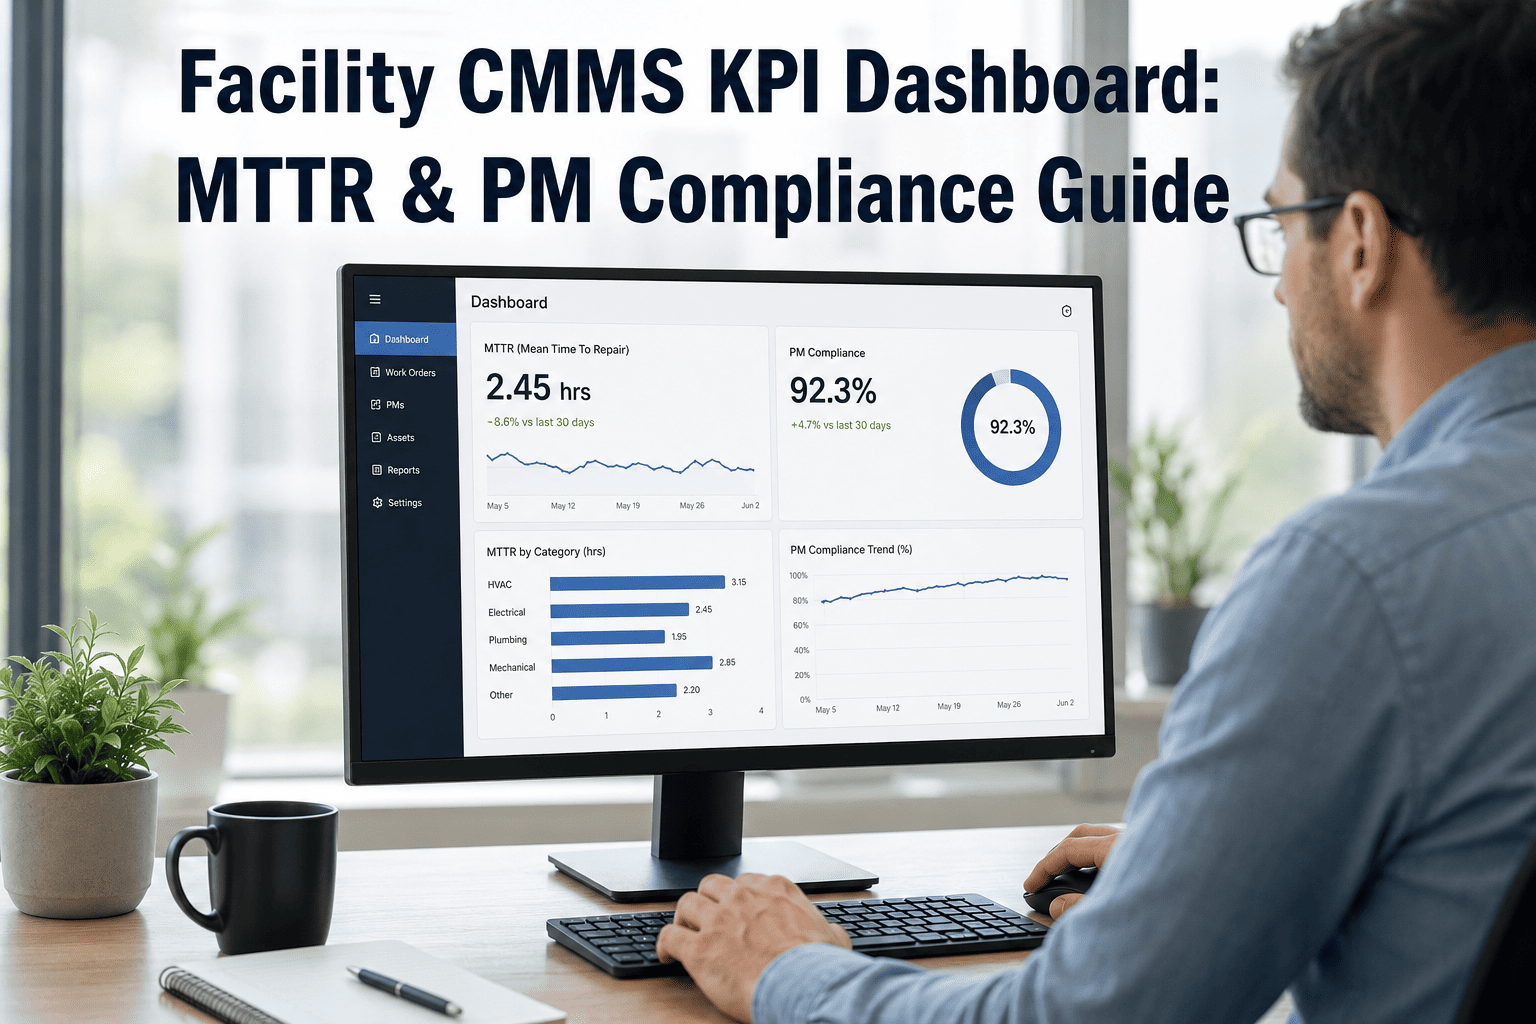
Most facility teams track plenty of numbers and still cannot answer a simple question: is maintenance getting better or worse? A useful dashboard is short, defined consistently, and tied to decisions. Twelve metrics, grouped by what they tell you, are enough to spot reliability problems, execution gaps, and cost drift early. Definitions follow the spirit of SMRP guidance, and they are easier to sustain when data comes from work orders and asset records in one system rather than spreadsheets.
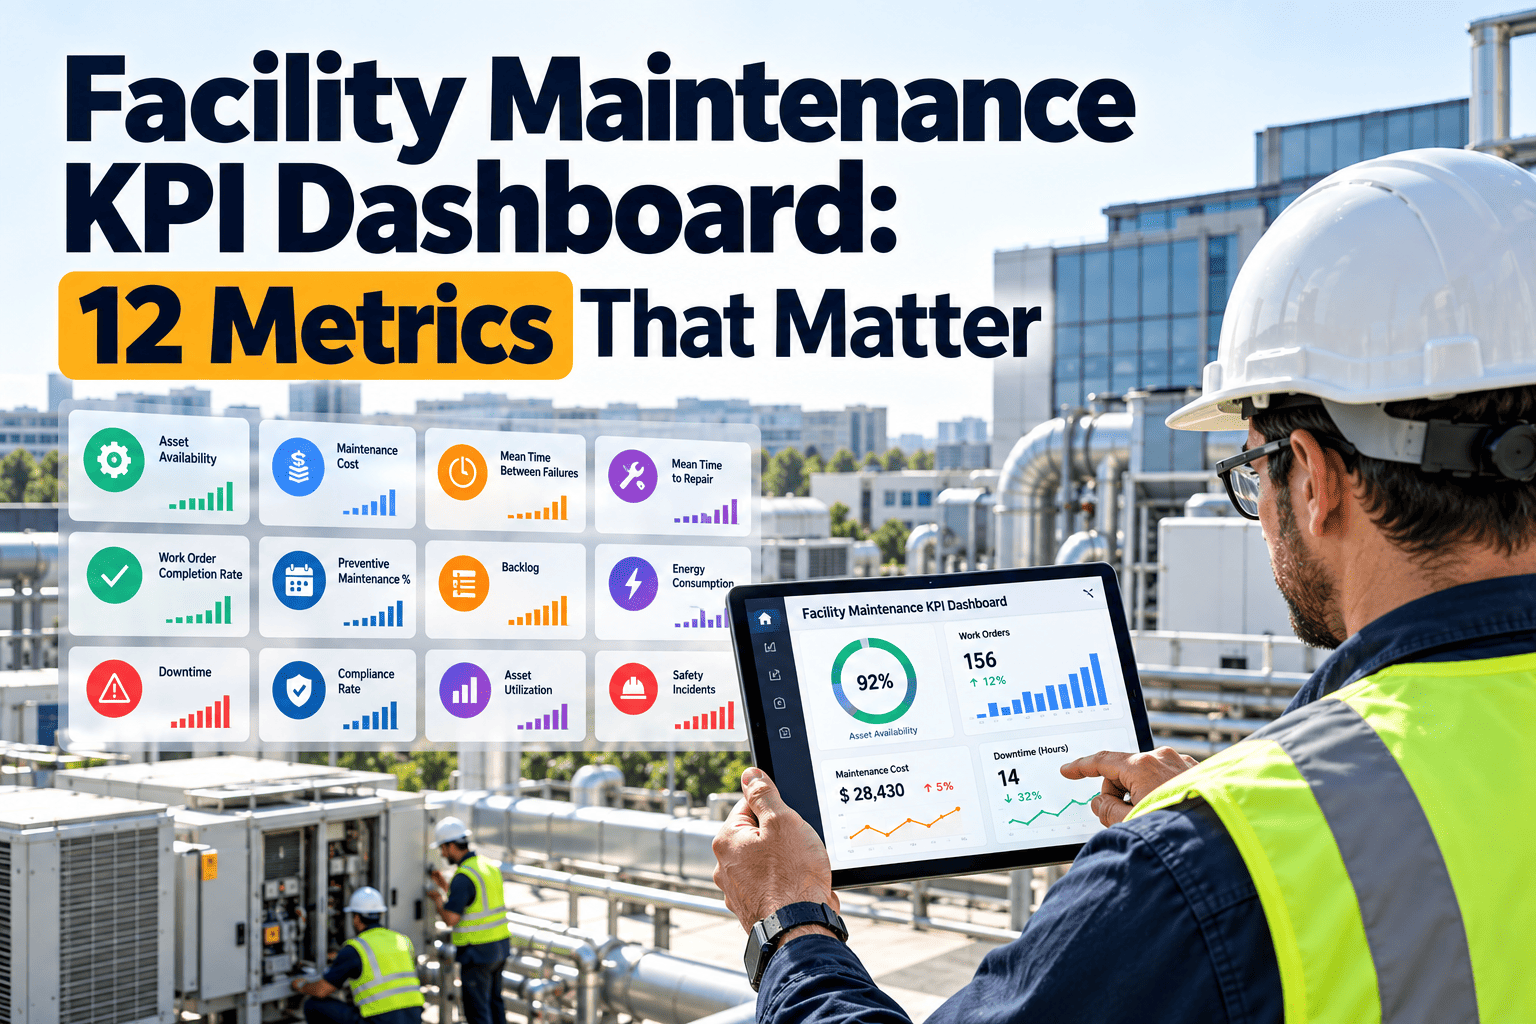
Facility Maintenance KPI Dashboard
12 Metrics That Separate Strong FM Teams From Average
From MTBF and MTTR to schedule compliance and backlog, these are the measures worth putting on one screen, with plain definitions and guidance on setting targets.
Reliability
MTBF, MTTR, Availability
Execution
PM compliance, Schedule compliance, Planned work, Backlog
Responsiveness
Emergency work share, Response time
Cost and Stock
Maintenance cost per area, Parts availability, Repeat failures
Before You Pick Metrics
- Define each metric in writing, including the formula, data source, and reporting period.
- Track a baseline for at least a few months before setting targets.
- Show trends, not single numbers, because direction matters more than one month.
- Assign an owner to each metric so someone acts when it moves.
A note on targets
Targets depend on building type, criticality, and maturity. The guidance below describes what "good" looks like directionally, and you should set numeric goals from your own baseline.
Reliability Metrics
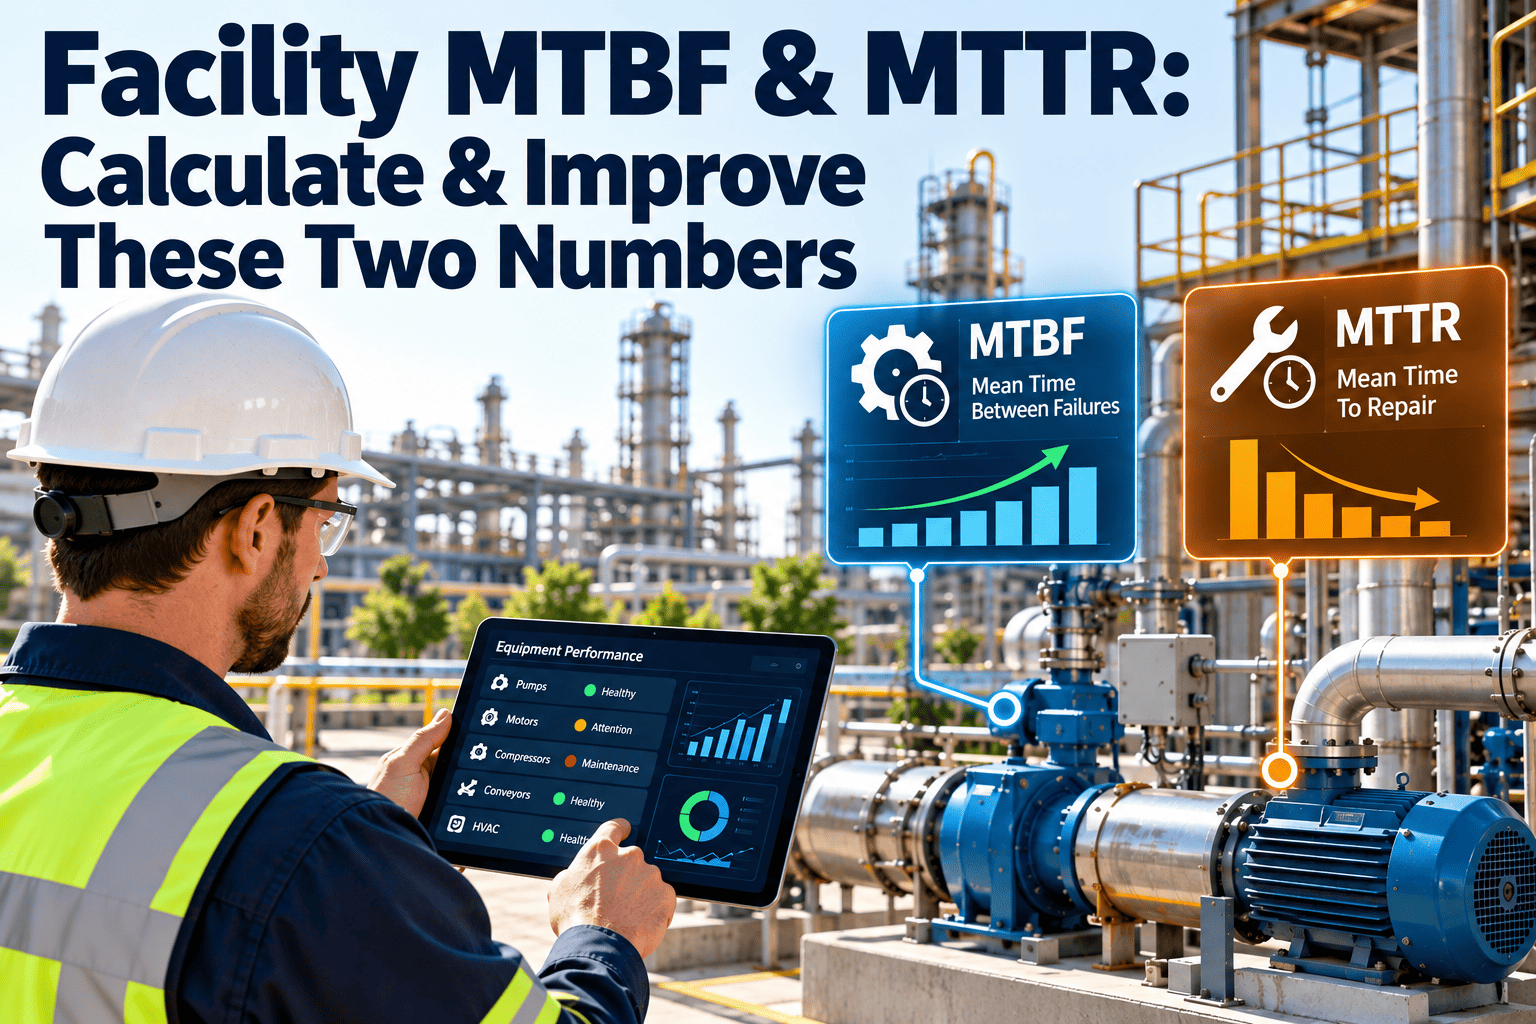
01MTBF: Mean Time Between Failures
Operating time divided by number of failures
Shows how long equipment runs between breakdowns. Rising MTBF suggests maintenance is working. Track by asset class, not for the whole building.
02MTTR: Mean Time To Repair
Total repair time divided by number of repairs
Reflects diagnosis, parts access, and skills. A rising MTTR often points to missing spares or unclear procedures.
03Asset Availability
Uptime divided by scheduled operating time
Best used for critical systems such as chillers, generators, and elevators, where downtime affects occupants directly.
Execution Metrics
| Metric | Formula | What It Reveals |
| 04 PM Compliance |
Preventive tasks completed divided by tasks due |
Whether planned work is actually being done |
| 05 Schedule Compliance |
Work completed on the scheduled date or within its window divided by work scheduled |
How well crews follow the weekly plan |
| 06 Planned Work Percentage |
Planned work hours divided by total maintenance hours |
Balance between proactive and reactive effort |
| 07 Backlog |
Open work hours divided by weekly crew capacity |
How many weeks of work are waiting |
Reading these four together
High PM compliance with low schedule compliance can signal poor planning. High planned work with a growing backlog suggests understaffing or weak prioritization.
Responsiveness Metrics
08
Emergency Work Share
Emergency work orders divided by all work orders
A high share means crews are firefighting. Falling emergency work usually follows better preventive coverage and inspections.
09
Response Time
Time from request to first technician action
Measure by priority. Tenants and occupants judge maintenance mostly by how quickly someone responds.
See These Metrics From Your Own Work Orders
Oxmaint records labor, parts, priority, and completion dates against every asset, so core maintenance metrics come from the same records your team already uses.
Cost and Stock Metrics
10Maintenance Cost per Area
Annual maintenance spend divided by floor area
Useful for comparing sites of similar type. Separate labor, contractor, and parts costs to see what is driving change.
11Parts Availability
Requests filled from stock divided by parts requested
Low availability stretches repair time. Overstock ties up money, so review critical spares separately.
12Repeat Failure Rate
Repeat failures on the same asset and cause divided by total failures
Repeats indicate root causes were not fixed. Good failure codes make this metric possible.
How the Twelve Metrics Connect
Plan
Planned work and PM compliance
Execute
Schedule compliance and backlog
Result
MTBF, availability, and emergency share
Cost
Cost per area, parts, and repeat failures
Why the order matters
Leading measures such as planned work and compliance move first. Reliability and cost follow months later. Judge the program on the whole chain.
Turning Metrics Into a Working Dashboard
Weekly view
Backlog, schedule compliance, emergency work, response time. Used by supervisors to steer the week.
Monthly view
PM compliance, planned work, parts availability, repeat failures. Used by managers to fix process gaps.
Quarterly view
MTBF, MTTR, availability, cost per area. Used by leadership for budget and capital decisions.
Data Quality Checks That Protect Your KPIs
Every work order has an asset and location
Work types are consistent: preventive, corrective, emergency
Failure codes are required at closure
Labor hours are logged by technicians
Parts issued are linked to the work order
Priority definitions are documented and used
Common mistakes
- Averaging every asset together, which hides problem equipment.
- Closing work orders in bulk, which distorts MTTR and compliance.
- Changing definitions mid-year without restating past results.
- Reporting metrics with no action attached.
How Oxmaint Supports the Dashboard
- Preventive maintenance scheduling and completion tracking for compliance reporting.
- Work orders with priority, labor, parts, and failure details for MTTR and repeat failure analysis.
- Asset management to view history and cost by equipment class or site.
- Inventory tracking to monitor parts usage and availability.
- Dashboards and reports to review trends weekly, monthly, and quarterly.
Frequently Asked Questions
Which KPI should a new maintenance program track first?
Start with PM compliance, backlog, and emergency work share. They are simple and show process health quickly.
What is the difference between PM and schedule compliance?
PM compliance measures preventive tasks done. Schedule compliance measures all scheduled work done on time.
Can MTBF be tracked for whole buildings?
It is more useful by asset class or critical system, since averages across a building hide weak equipment.
How do I get reliable KPI data?
Require asset, labor, and failure details on every work order.
Try Oxmaint to see how.
How many KPIs should a facility dashboard show?
Enough to guide action, and no more.
Book a demo to build a focused view.
Measure What Moves Your Maintenance Forward
Build a dashboard from real work order and asset data, and give your team the numbers it needs to plan, prioritize, and prove results.