When a CFO asks "how is facility maintenance performing this quarter," the honest answer for most teams is a scramble — pulling cost data from one system, backlog numbers from another, and compliance status from a spreadsheet someone updates manually. By the time it's all assembled, the numbers are already a week old. Facility maintenance executive scorecard software turns that scramble into a standing report — cost, backlog, SLA compliance, asset uptime, and PM performance, always current, always ready for the next leadership conversation.
Blog · KPI & Reporting
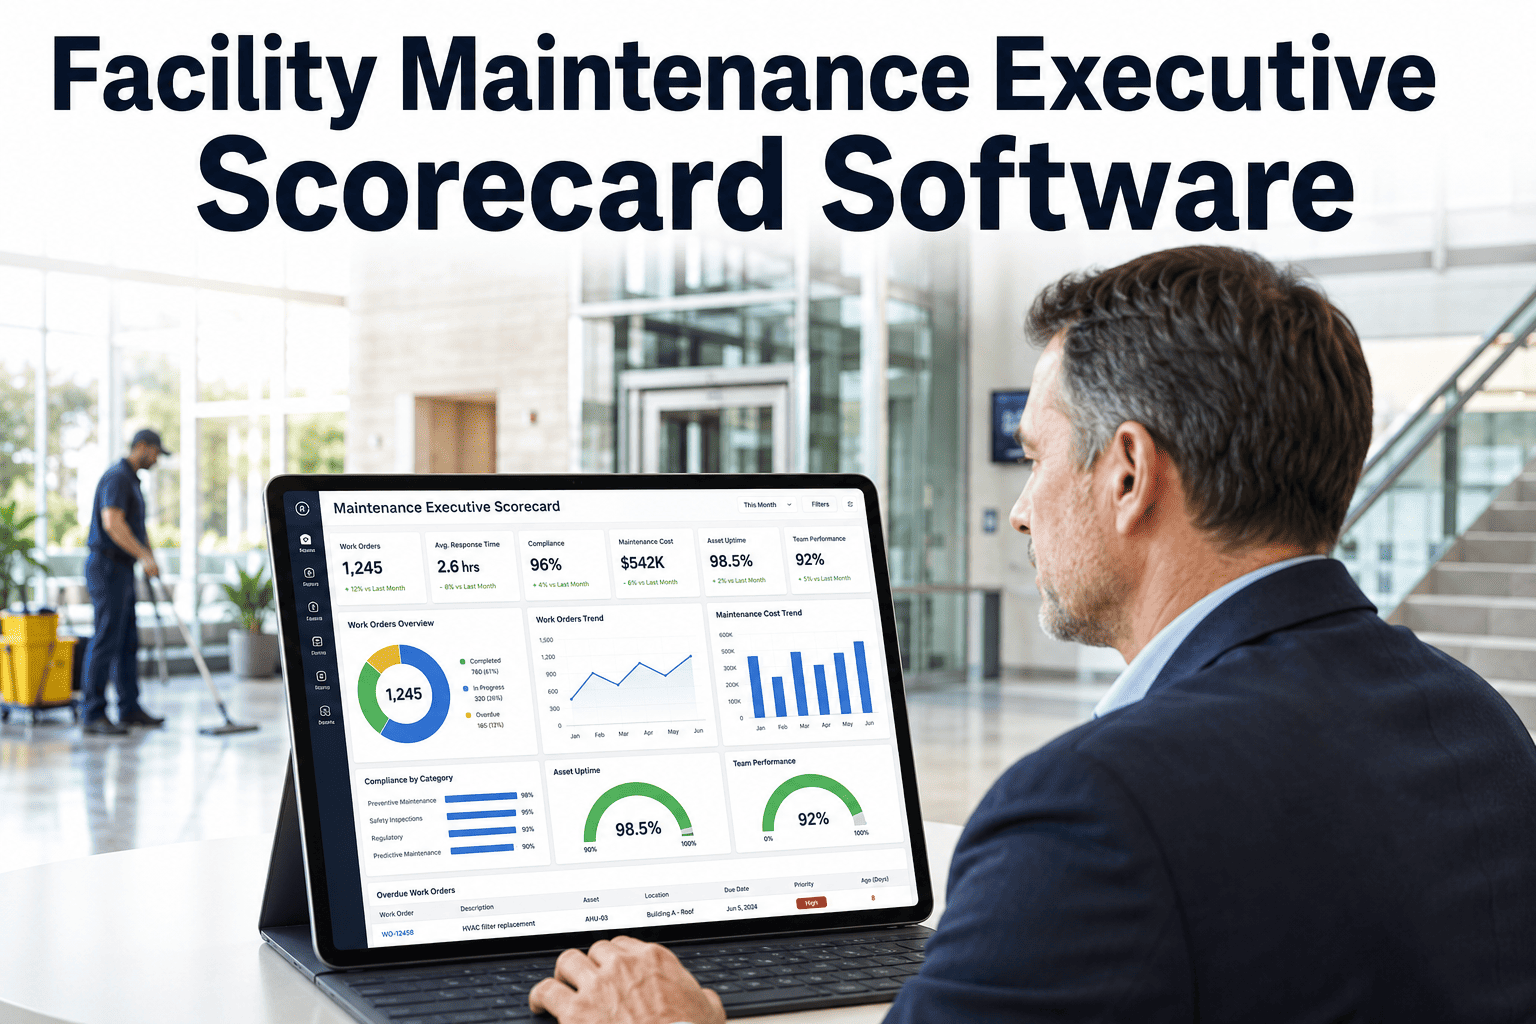
Executive-Ready Numbers, Without the Week-Long Scramble
Cost, backlog, SLA compliance, asset uptime, and PM performance — compiled automatically into a scorecard leadership can trust.
The Five Numbers Leadership Actually Wants
Executives don't need to see every work order — they need five numbers that tell them whether maintenance operations are healthy, trending up, or quietly heading toward a problem. A scorecard distills hundreds of daily activities into exactly those five answers.
Maintenance Cost
Total spend vs. budget, broken down by category — labor, parts, vendor — so overspend is caught early, not at quarter close.
Backlog Volume
Open work orders trending over time, showing whether the team is keeping pace or falling behind on demand.
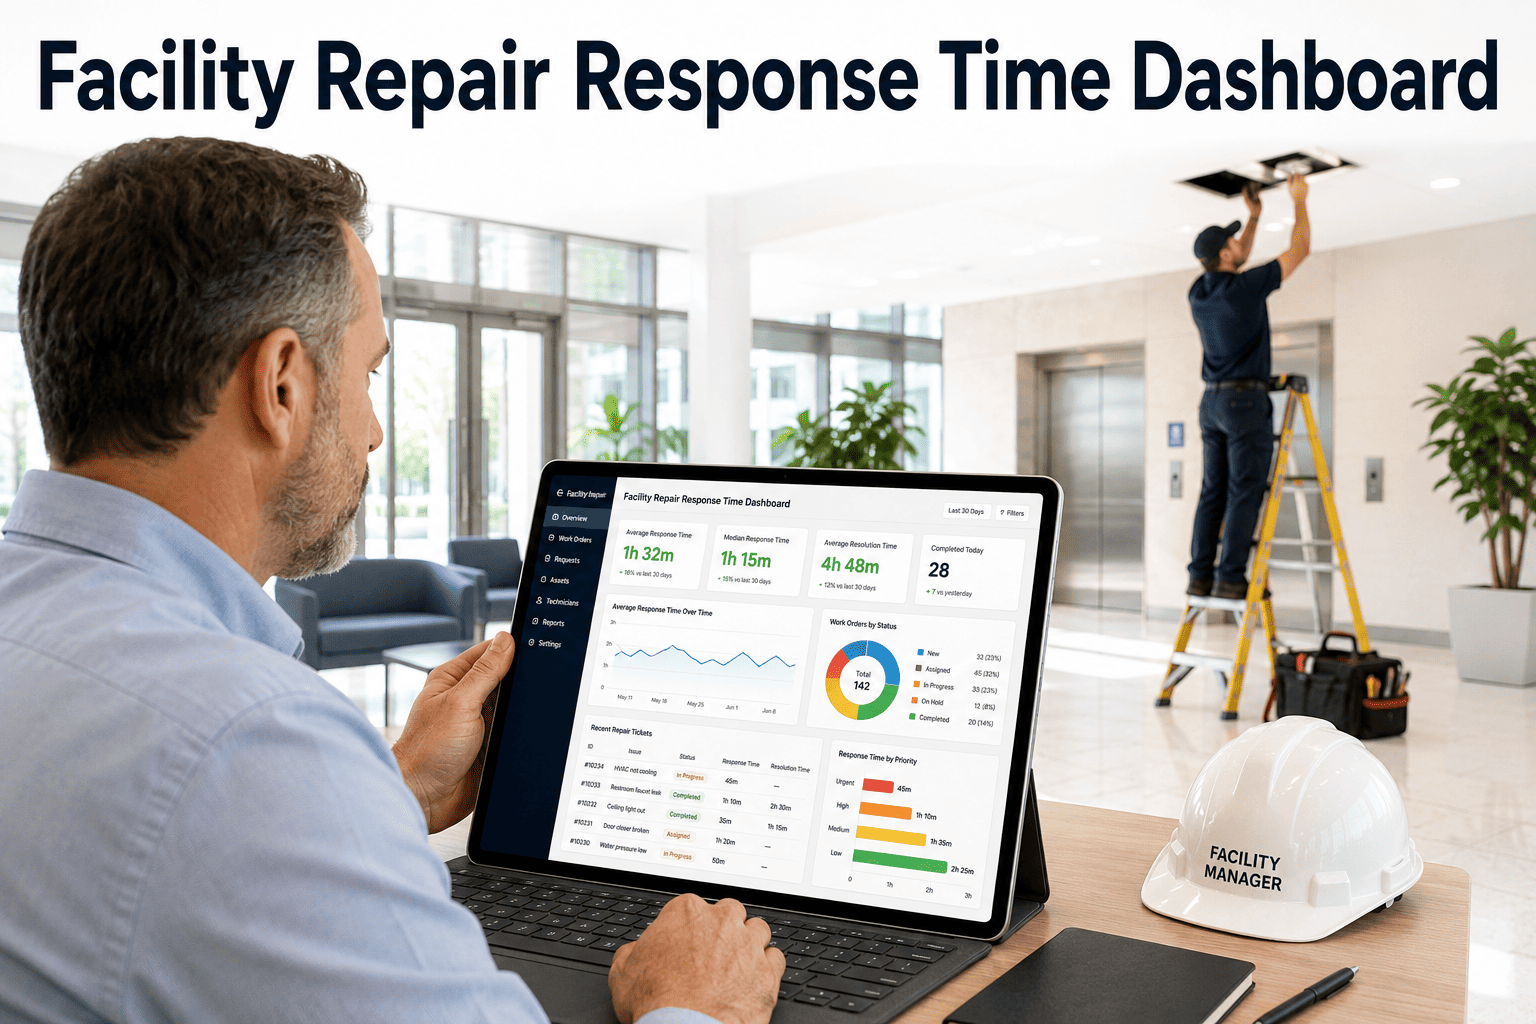
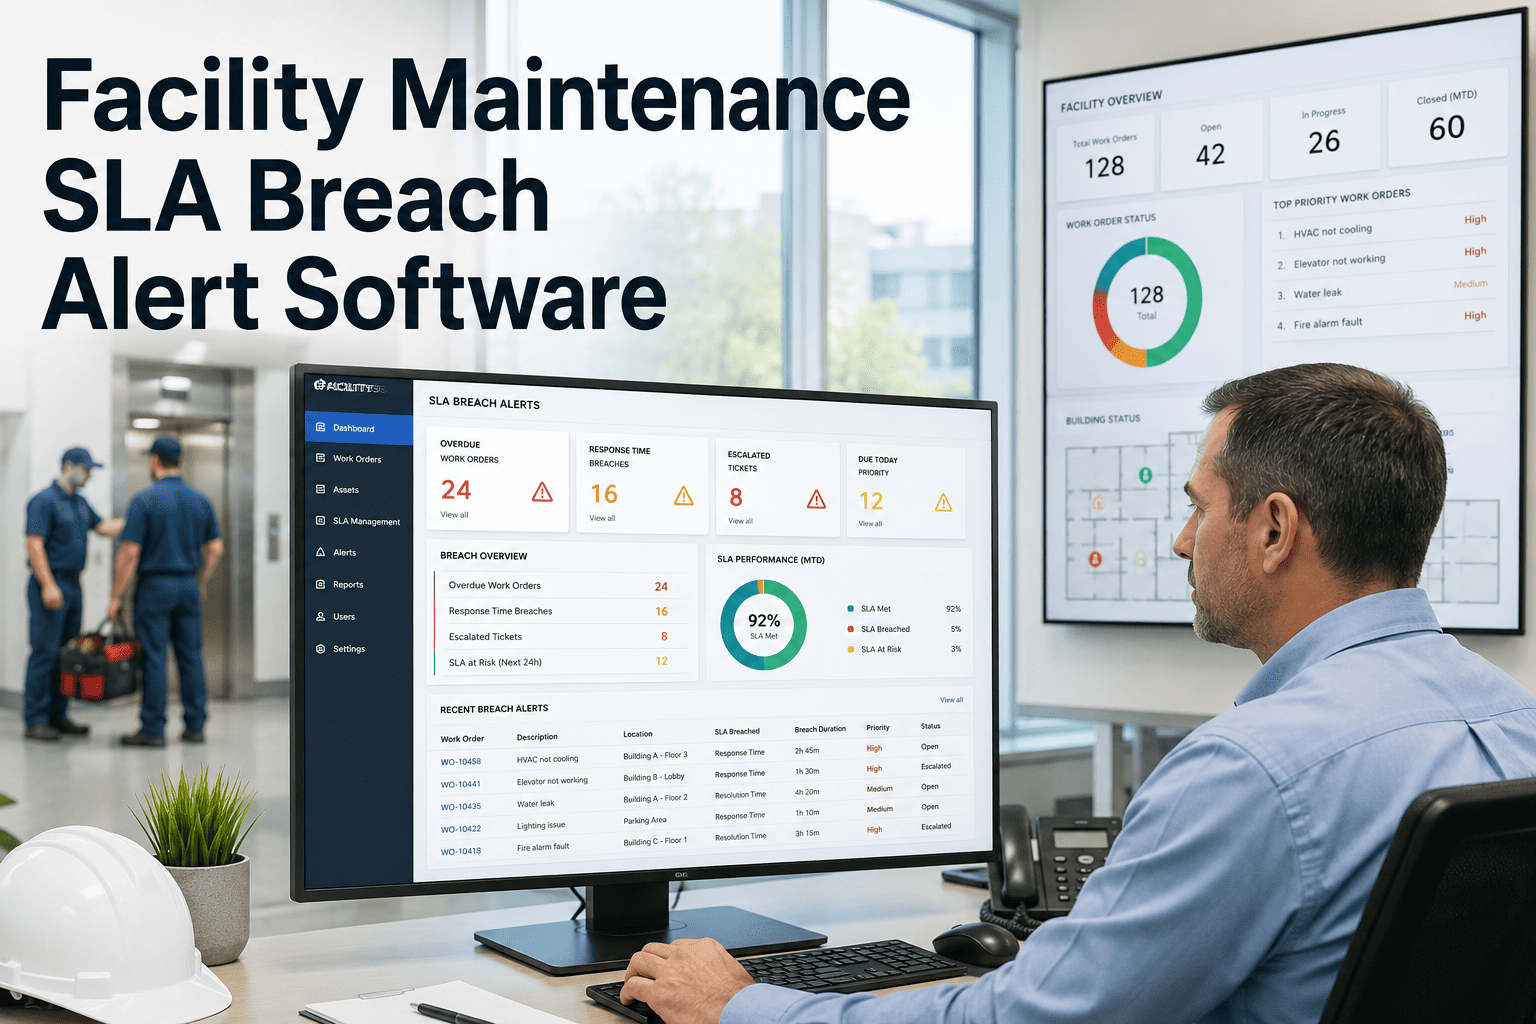
SLA Compliance
Percentage of repairs completed within target time, the clearest signal of service quality to tenants and stakeholders.
Asset Uptime
Percentage of time critical equipment is operational — directly tied to business continuity and risk exposure.
PM Completion Rate
Share of scheduled preventive maintenance completed on time — the leading indicator for future breakdowns and cost.
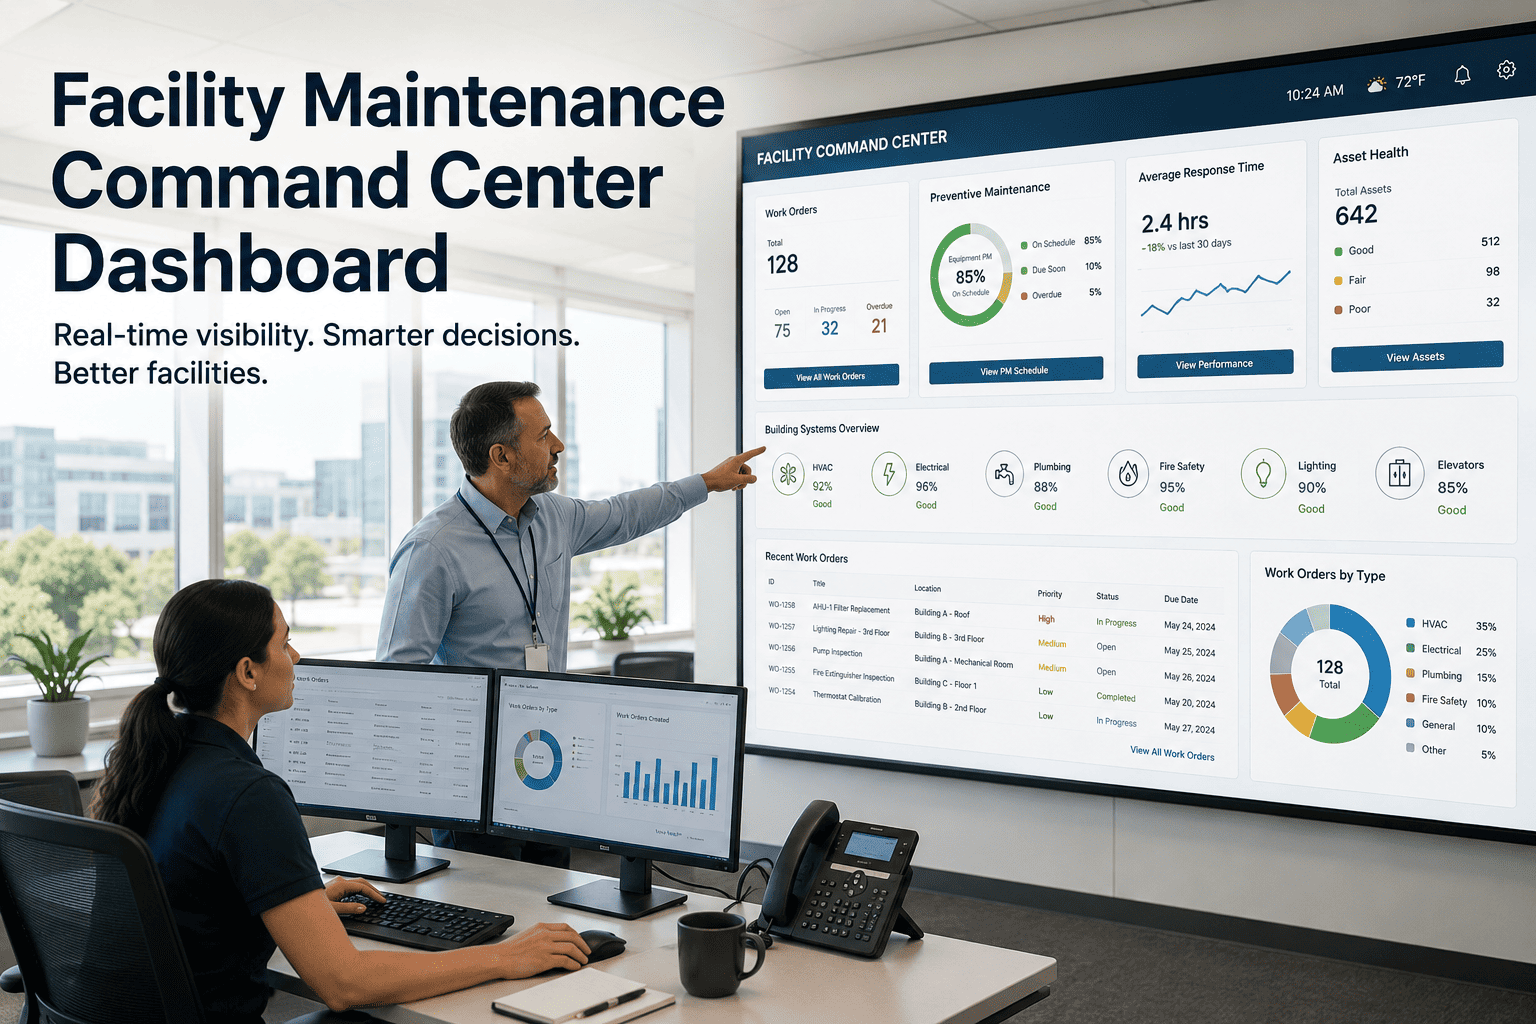
Turn Five Reports Into One Scorecard
Oxmaint automatically compiles cost, backlog, SLA, uptime, and PM data into an executive scorecard — refreshed continuously, so your next leadership meeting starts with answers, not a data-gathering exercise.
Sample Quarterly Scorecard Comparison
| Metric |
Q1 Result |
Q2 Result |
Target |
Trend |
| SLA Compliance |
81% |
88% |
90% |
Improving |
| Maintenance Cost vs. Budget |
+12% |
+4% |
0% |
Improving |
| Asset Uptime |
93% |
95% |
97% |
Improving |
| PM Completion Rate |
89% |
91% |
95% |
Improving |
| Open Backlog |
142 |
118 |
under 100 |
Watch |
Why Quarter-End Reporting Falls Short
Quarter-End Compilation
Data pulled manually from multiple disconnected systems
Numbers reflect status from weeks ago, not current reality
Trends only visible in hindsight, after the quarter ends
Hours spent formatting reports for leadership review
Continuous Scorecard
All five metrics calculated automatically from live data
Always reflects current operational reality
Trends visible weekly, allowing course correction mid-quarter
Reports ready instantly, anytime leadership asks
Expert Review
"The scorecard changed the nature of our leadership conversations entirely. Instead of explaining why last quarter's numbers were what they were, we started discussing what we'd do about this week's trend. Catching a budget variance in week three instead of finding out at quarter close gave us actual room to course-correct — that's the real value, not just having prettier reports."
— VP of Facilities Operations, Healthcare Real Estate Group
Bring This Scorecard to Your Next Leadership Meeting
Book a 30-minute demo and see how Oxmaint compiles your cost, backlog, SLA, uptime, and PM data into a scorecard ready for any leadership conversation.
Frequently Asked Questions
What metrics are included in a facility maintenance executive scorecard?
Core metrics typically include maintenance cost vs. budget, open backlog volume, SLA compliance percentage, asset uptime, and PM completion rate — all calculated automatically within
Oxmaint from live operational data.
Can the scorecard be customized for different stakeholders?
Yes — scorecards can be filtered and formatted differently for site managers, regional directors, and executive leadership, each seeing the level of detail relevant to their role.
How often is scorecard data updated?
Data is continuously calculated from live work orders, schedules, and cost records, so the scorecard reflects current performance rather than a snapshot from a past reporting period.
Can historical scorecard data be exported for board presentations?
Yes — historical trends across quarters can be exported for presentations and audits.
Book a demo to see sample export formats for your reporting needs.