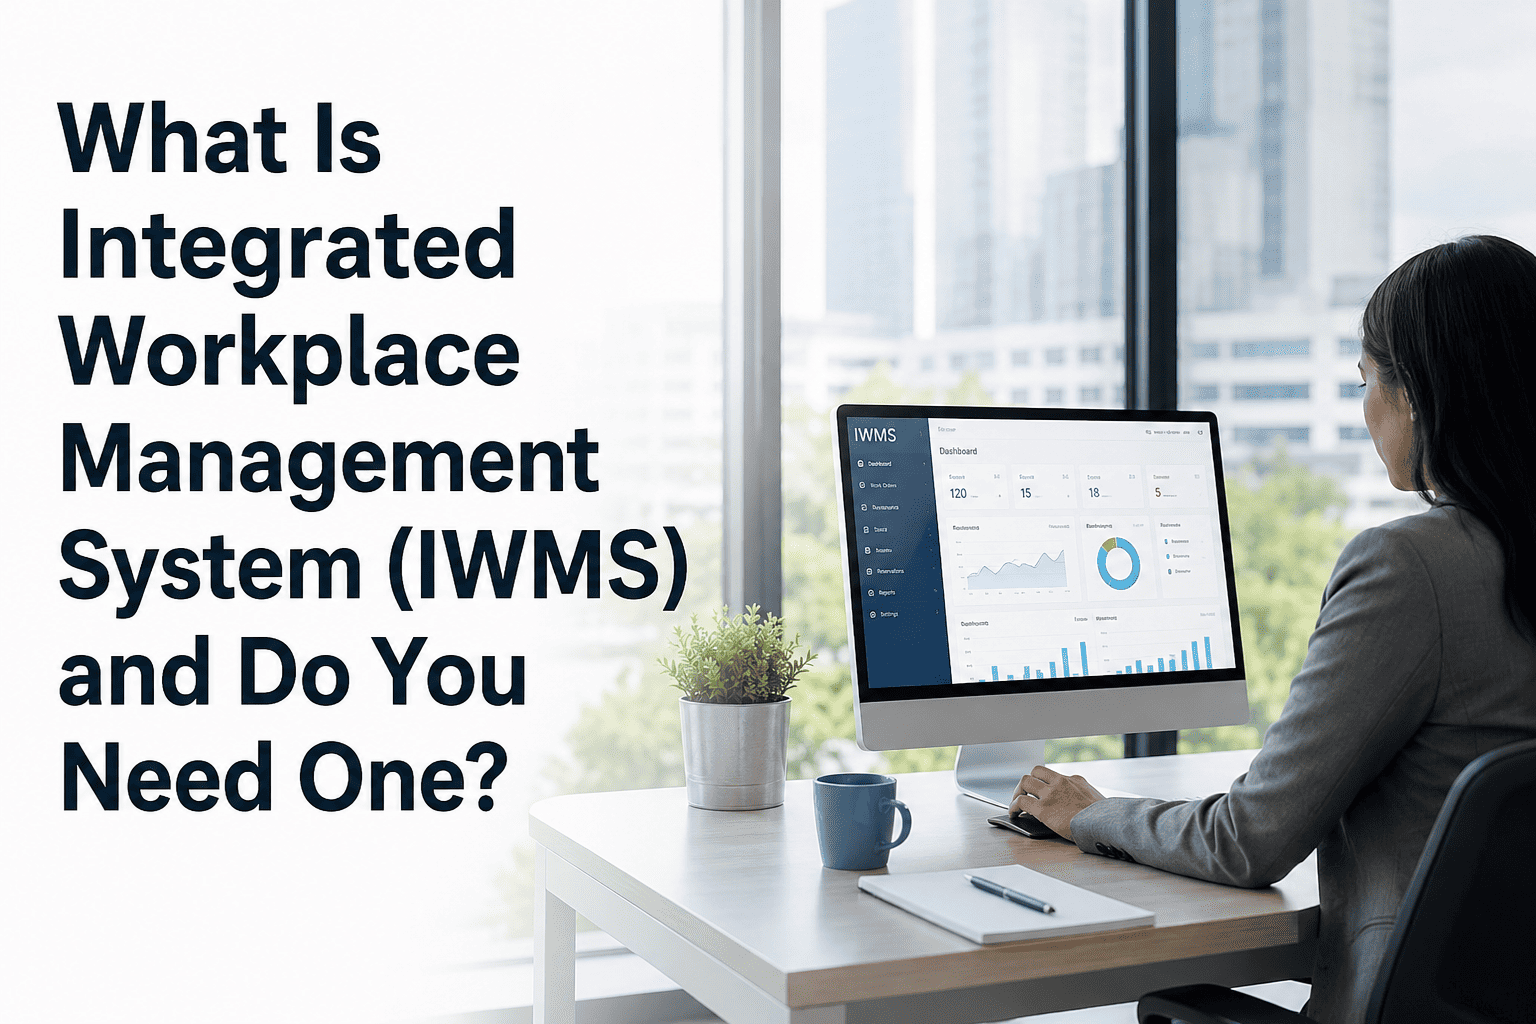
Facility managers have the data. The problem is that 67% of FM directors are still compiling board reports manually from spreadsheets that are 4 to 6 weeks out of date by the time leadership reads them. C-suite executives are making capital allocation decisions, risk assessments, and vendor contract calls based on stale numbers while live operational data sits locked in disconnected systems. The gap between what your CMMS knows right now and what your CFO, COO, and board see next month is where budget gets wasted, deferred maintenance compounds, and facility risk goes invisible at the executive level. An FM executive dashboard built on live data closes that gap permanently. This guide covers exactly what each C-suite role needs to see, which KPIs belong on a leadership dashboard versus an operational one, the design principles that make FM data actionable at board level, and how OxMaint's Executive AI Briefing generates one-click portfolio reporting that replaces hours of manual compilation. Start free on OxMaint or book a demo to see the executive dashboard running on live facility data.
2026 Reality: 67% of FM directors report making capital decisions on monthly reports that are already 4 to 6 weeks out of date. OxMaint's Executive AI Briefing delivers live portfolio intelligence in one click.
Blog
Executive Dashboards for Facility Management: What C-Suite Wants to See
Executive & Reporting
7 min read
67%
FM directors making capital decisions on reports 4 to 6 weeks out of date, per industry research
8-12 hrs
Average FM team time per month manually compiling KPI reports that live dashboards deliver in under 5 minutes
$18.8B
Global FM software market in 2024, growing at 11.8% annually driven by real-time executive dashboard demand
84%
PM compliance achievable with CMMS dashboard-driven scheduling versus 54% average without live visibility
OxMaint · Executive AI Briefing · Executive & Reporting
Your Board Sees Last Month's Spreadsheet. Your CFO Deserves Live Portfolio Intelligence. OxMaint Delivers Both in One Click.
5 minBoard report generation
Real-timePortfolio KPI updates
1 clickExecutive PDF export
ZeroManual compilation
What Each C-Suite Role Needs to See on an FM Dashboard
A single FM dashboard served to every executive fails all of them. The CFO needs financial exposure and budget variance. The COO needs operational risk and compliance status. The board needs portfolio condition and capital forecast. Design for the decision, not for the data.
CFO
Chief Financial Officer
Primary question:
Are we spending on the right things and is our facility budget defensible?
Total maintenance spend vs. budget (YTD variance)
Emergency vs. planned repair ratio (cost premium exposure)
Cost per square foot by property vs. portfolio benchmark
5-year CapEx forecast with replacement timeline by asset class
Deferred maintenance liability value across all sites
Maintenance spend as % of Replacement Asset Value (RAV)
COO
Chief Operating Officer
Primary question:
Are operations running reliably and where are the risks that will disrupt the business?
PM compliance rate across all sites (target 80%+)
Asset condition score distribution (critical assets flagged)
Mean Time to Repair by system and site
Open work order backlog by age and priority
Contractor SLA performance rate
Top 10 highest-risk assets by condition score
Board
Directors and Investors
Primary question:
What is the condition of our property assets and are we protecting long-term portfolio value?
Facility Condition Index (FCI) by building and portfolio
10-year CapEx forecast vs. current capital plan
Compliance status across all regulated systems
Energy Use Intensity (EUI) trend vs. benchmarks
Deferred maintenance as % of portfolio replacement value
ESG and sustainability KPI progress (GHG, energy, water)
VP FM
VP of Facilities / Director of FM
Primary question:
Which sites need attention and how do I allocate team resources most effectively this month?
Site-by-site PM compliance league table
Emergency WO ratio by site (flagging reactive outliers)
Technician workload and WO completion rates
Upcoming planned maintenance schedule next 30 days
Assets approaching end of lifecycle by replacement cost
Compliance inspection due dates with days remaining
The 8 KPIs That Belong on Every FM Executive Dashboard
Not all FM KPIs are executive KPIs. Technician-level metrics belong in operational views. These eight KPIs consistently answer the questions that drive executive action and capital decisions.
01
Facility Condition Index (FCI)
Cost of deferred maintenance divided by current replacement value. FCI below 0.10 is good condition. Above 0.30 signals critical deterioration. The single most important metric for board-level property portfolio risk communication.
Target: FCI below 0.10 per building
02
PM Compliance Rate
Scheduled preventive maintenance tasks completed on time as a percentage of all scheduled tasks. The leading indicator of future failure rates and emergency repair spend. Below 70% predicts reactive budget spiral within 18 months.
Target: 80% or above across all sites
03
Emergency vs. Planned Repair Ratio
Emergency repairs cost 4.8x more than planned maintenance events. A ratio above 35% emergency signals an operation running reactively. This single ratio tells the CFO whether the FM budget is being managed or consumed by failures.
Target: Emergency ratio below 20%
04
Maintenance Spend per Square Foot
Total maintenance spend divided by gross floor area. Benchmarked against IFMA and BOMA data for building type and age. Enables CFO to identify outlier properties and justify or challenge the FM budget in one defensible number.
IFMA benchmark: $2.25 to $4.80/sq ft for commercial
05
Deferred Maintenance Liability
Total cost of maintenance work identified but not yet scheduled or funded. Invisible on P&L but directly impacts asset condition and future CapEx. Every year of deferral increases replacement cost by 10 to 30% on most asset classes.
Alert threshold: Exceeds 3% of total property value
06
Compliance Status by System
Percentage of regulated systems (fire suppression, HVAC, electrical, elevators, pressure vessels) with current inspection certificates. A compliance gap is a legal liability and an insurance exposure. Executives need a single red/amber/green view across the portfolio.
Target: 100% of regulated systems in green status
07
CapEx Forecast Accuracy
Actual capital spend versus forecast at year end. Operations relying on age-based replacement schedules show 40 to 65% variance. Condition-data-driven forecasts consistently achieve under 15% variance, making the FM function credible at board level.
Target: Annual CapEx variance below 15%
08
Energy Use Intensity (EUI)
Total site energy consumption (kBtu) per gross square foot per year. Benchmarked against ENERGY STAR medians for building type. A rising EUI signals equipment degradation, deferred maintenance, or operational inefficiency. Critical for ESG reporting and BPS compliance.
ENERGY STAR baseline: Building-type specific median
OxMaint tracks all 8 executive KPIs live across your entire portfolio and exports a board-ready report in under 5 minutes.
No manual compilation. No stale data. FCI, PM compliance, emergency ratio, deferred liability, compliance status, and CapEx forecast all updated in real time from work order data.
Executive Dashboard vs. Operational Dashboard: What Goes Where
Dashboard overload is a real failure mode. Executives presented with technician-level data disengage. Technicians given only executive KPIs cannot action their work. Design two views from the same data source.
Why FM Executive Dashboards Fail (and How to Fix Each One)
Most FM executive dashboards are built by FM teams, not for executive audiences. Four patterns cause failure repeatedly across facilities operations of every size.
01
Too Many Metrics With No Decision Attached
A dashboard showing 40 KPIs answers nothing. Executives leave every metric asking "so what?" Every data point on an executive dashboard must answer a named decision: this KPI going red triggers this specific action or escalation. Build the decision tree before building the dashboard.
Fix: Define the action triggered by each metric before adding it to the dashboard. Remove any metric that produces no action when it changes.
02
Stale Data Presented as Current Intelligence
67% of FM directors compile board reports from spreadsheets that are 4 to 6 weeks out of date. Capital decisions made on last month's numbers are made on the wrong numbers. A building that scored green on the last report may have had three critical failures since then.
Fix: Live CMMS connection. OxMaint updates FCI, PM compliance, and emergency ratio in real time as work orders close. The executive dashboard always reflects today.
03
No Context or Benchmark for Numbers Shown
A PM compliance rate of 73% means nothing to a CFO who has never managed a maintenance programme. Is 73% good, average, or a crisis? Executive dashboards must provide context: benchmark comparison, trend direction, and a clear threshold that defines red, amber, and green status for every metric.
Fix: Include IFMA, BOMA, and industry benchmarks alongside every KPI. Show 12-week trend direction. Color-code by threshold, not just absolute value.
04
Operational Detail That Buries Strategic Signal
Work order counts, technician hours, and parts usage are operational metrics. Presenting them to a CFO or board creates confusion, not insight. The strategic view requires one layer of abstraction above operations: what is the portfolio condition trend, not which technician fixed which asset last Tuesday.
Fix: Two separate views from the same data. OxMaint serves the Executive AI Briefing and the operational dashboard from one live dataset, each showing only what its audience needs to act.
How OxMaint's Executive AI Briefing Works
OxMaint automatically generates a board-ready executive summary from live work order and asset data. No manual report. No data consolidation. Preparation time drops from 8 to 12 hours to under 5 minutes.
1
Live Data From All Sites
Every work order completion, PM compliance record, asset condition update, and energy reading from every building in the portfolio feeds into OxMaint in real time. No manual data entry, no monthly upload, no email from site managers.
↓
2
AI Briefing Layer Calculates Executive KPIs
OxMaint calculates FCI, PM compliance rate, emergency ratio, deferred maintenance liability, CapEx forecast variance, and compliance status automatically from work order data. No formulas to maintain. No manual calculation. Every number is current as of the moment the dashboard is opened.
↓
3
Role-Based Dashboard Views
CFOs see financial exposure and budget variance. COOs see operational risk and compliance status. The board sees portfolio FCI and CapEx forecast. Each role logs in to a view designed for their decisions, not a universal screen designed for no one.
↓
4
One-Click Board Report Export
One click generates a board-ready PDF: portfolio FCI, PM compliance rate, total maintenance spend vs. budget, top risk assets, and upcoming CapEx requirements. The same report that previously took 8 to 12 hours of manual data assembly is ready before the meeting starts.
5 min
Board Report Time
From 8 to 12 hours of manual spreadsheet assembly to a one-click OxMaint Executive AI Briefing export, formatted for the board pack.
40-65%
CapEx Variance Without Live Data
Operations relying on age-based capital plans show 40 to 65% variance versus actual spend. Condition-data-driven OxMaint forecasts consistently achieve under 15%.
4.8x
Emergency vs. Planned Cost Premium
The metric that proves FM dashboard ROI to any CFO: every reactive repair costs 4.8x more than the same work done on a planned PM schedule.
84%
PM Compliance With Dashboard Visibility
PM compliance rises from 54% industry average to 84% when facility teams have live compliance tracking and executives can see the rate in real time.
Frequently Asked Questions
What KPIs should be on a facility management executive dashboard for a CFO?
CFOs need total maintenance spend vs. budget variance, emergency vs. planned repair ratio (cost premium exposure), cost per square foot vs. IFMA benchmarks, deferred maintenance liability value, and the 5-year CapEx forecast. These six metrics let a CFO evaluate FM budget efficiency and defend or challenge capital allocation in one view.
Sign up free or
book a demo to see the CFO dashboard in OxMaint.
How is an executive FM dashboard different from an operational maintenance dashboard?
Executive dashboards show portfolio-level condition trends, financial exposure, and compliance status at monthly or weekly cadence. Operational dashboards show real-time work order queues, technician assignments, and daily task status. Both should be generated from the same live CMMS data, just at different levels of abstraction.
Book a demo or
sign up free.
How long does it take to generate a board-ready FM report in OxMaint?
OxMaint's Executive AI Briefing generates a board-ready PDF with FCI, PM compliance, budget variance, top risk assets, and CapEx forecast in under 5 minutes. The same report previously required 8 to 12 hours of manual data assembly from spreadsheets across multiple sites.
Start free or
book a demo.
What is the Facility Condition Index and why do boards care about it?
FCI equals total deferred maintenance cost divided by current replacement value. Below 0.10 is good condition; above 0.30 is critical deterioration. Boards care because it translates asset maintenance status into a single ratio that communicates portfolio risk in language that property investors, lenders, and insurers understand.
Book a demo or
sign up free.
OxMaint · Executive AI Briefing
Stop Compiling Board Reports Manually. Start Generating Them in One Click.
Continue Reading
Explore more from the Industry-Specific FM cluster to build a complete picture of how executive FM intelligence applies across different facility types.
OxMaint · Executive AI Briefing · Portfolio Intelligence
Your C-Suite Should Be Making Decisions on Live Data. OxMaint Delivers It in Under 5 Minutes, Across Every Building in Your Portfolio.
5 minBoard report
84%PM compliance
ZeroManual assembly
DaysTo deploy