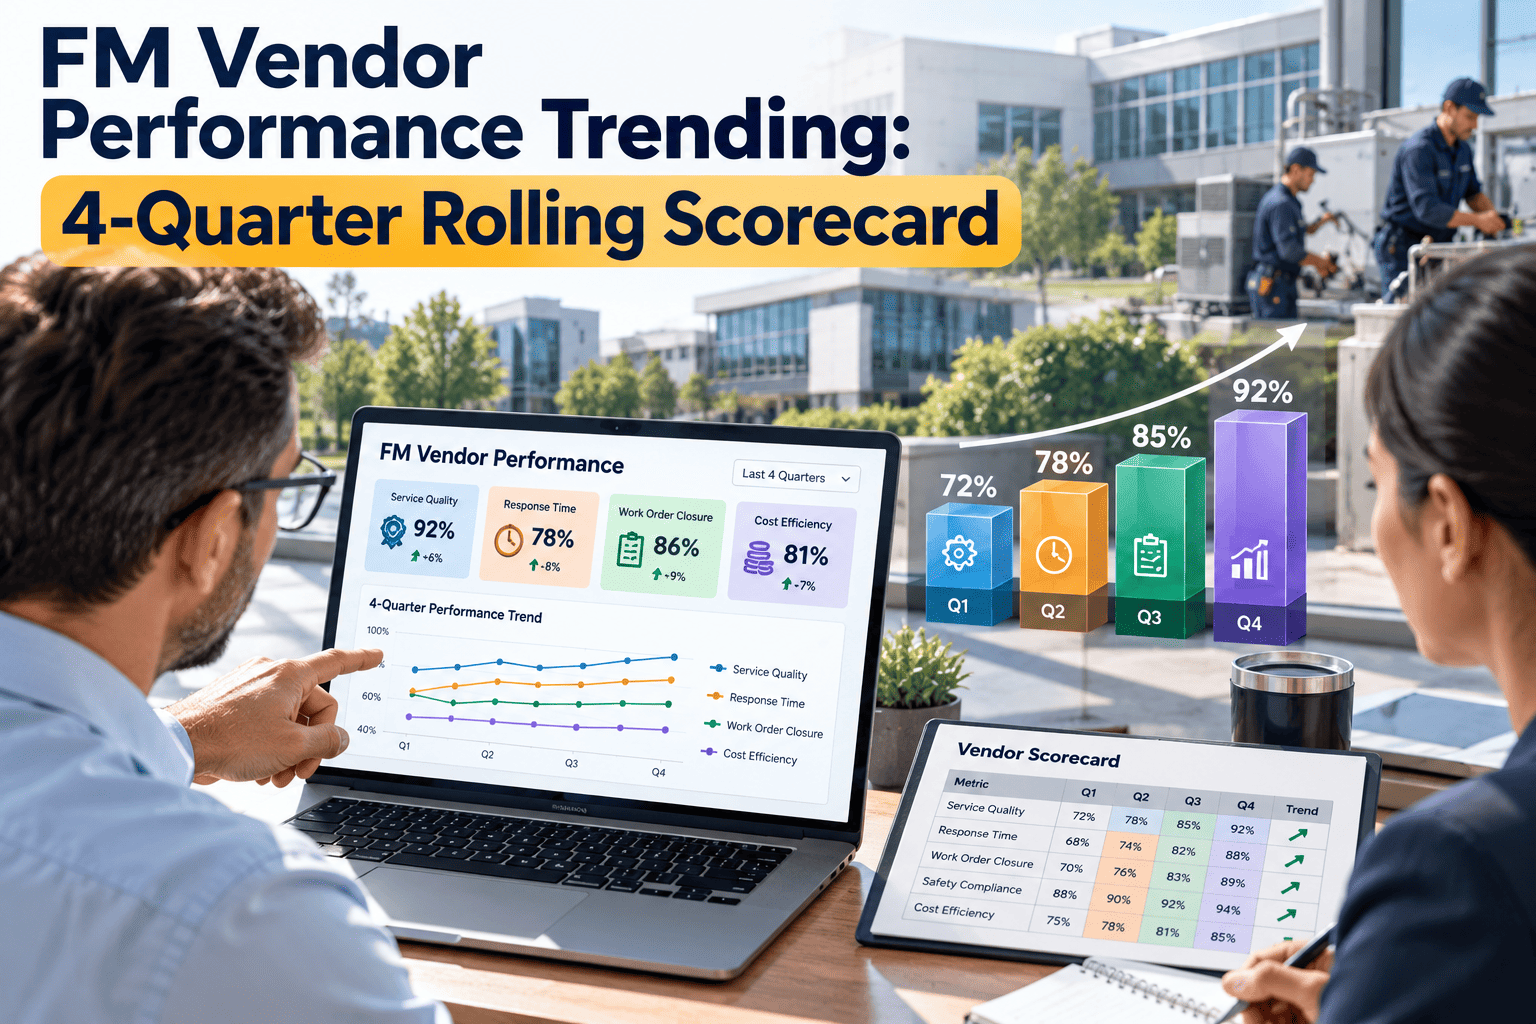
A vendor can pass every quarterly review and still be drifting toward a bad renewal. Each snapshot looks acceptable on its own, yet response times lengthen, repeat visits creep up, and preventive tasks slip by small margins. Because no one compares quarters side by side, the pattern surfaces only when complaints arrive. A four-quarter rolling scorecard exposes direction as well as position, and a CMMS with vendor work order reporting supplies the data it needs.
FM Vendor Performance Trending: 4-Quarter Rolling Scorecard
Snapshots tell you where a vendor stands. A rolling window tells you where it is heading, early enough to act before the renewal decision is made for you.
Illustrative drift pattern: each quarter passes review alone, but the four-quarter line shows a steady decline.
The blind spot inside quarterly vendor reviews
Single-quarter review
- Compares performance to target only
- Treats every pass as equal, however narrow
- Resets the conversation each quarter
- Hides slow decline behind a green status
- Raises concerns after SLA breaches
Four-quarter rolling view
- Compares each quarter to its own recent history
- Separates a narrow pass from a comfortable one
- Carries context forward into every review
- Shows gradual decline while it is still cheap to fix
- Raises concerns while the vendor is still meeting SLA
How the rolling window works
The scorecard always shows the latest four quarters. When a new quarter closes, the oldest drops off and the window slides forward.
Oldest period
Second period
Third period
Latest period
Plot each metric as a four-point line, then add a one-word direction label: improving, stable, slipping, or volatile.
Seven measures that trend well for facility vendors
Choose measures you can capture consistently from work orders. A trend built from inconsistent data is worse than no trend.
| Measure | How to calculate | Good direction | Typical drift signal |
|---|---|---|---|
| Response time compliance | Work orders acknowledged within agreed window, divided by total | Up or flat | Gradual decline in the share meeting the window |
| Completion time | Median time from request to completion by priority | Down or flat | Median creeping up while averages stay hidden |
| First-time fix rate | Jobs closed without a return visit, divided by total jobs | Up or flat | Rising repeat visits on the same asset |
| Preventive task completion | PM tasks finished by due date, divided by scheduled | Up or flat | Small monthly slips that compound |
| Backlog age | Open work orders older than a set threshold | Down | Aging tail growing while new tickets close quickly |
| Documentation quality | Work orders with notes, photos, and sign-off | Up | Thinner close-out notes over time |
| Customer satisfaction | Occupant or site feedback on completed work | Up or flat | Declining comments before scores fall |
Five drift shapes and what usually sits behind them
The shape of the line often points to the cause. Treat these as prompts for a question, not as conclusions.
| Shape | What it looks like | Possible cause | First response |
|---|---|---|---|
| Steady slide | Each quarter slightly worse | Staffing attrition or reduced supervision | Ask for a staffing and turnover update |
| Cliff drop | Sudden fall in one quarter | Account manager change, system change, or lost subcontractor | Request a recovery plan with dates |
| Recovery after review | Dips, then improves briefly | Performance managed to the meeting, not the contract | Move to monthly check-ins |
| Seesaw | Alternating good and poor quarters | Seasonal demand or inconsistent resourcing | Compare against workload and plan capacity |
| Flat but narrow | Always just above target | Vendor optimizing to the minimum | Tighten targets or add stretch measures |
See vendor drift while you can still fix it
Using the trend to run the six months before renewal
A rolling scorecard is most useful when it is tied to dates. Work backward from the renewal decision.
Share the trend
Agree recovery actions
Verify movement
Decide the posture
Prepare the paperwork
What every vendor page on the scorecard should show
- Four-point trend line
- One line per metric, with the contract target drawn as a reference.
- Direction label
- A plain word beside each line so readers do not interpret the slope differently.
- Volume context
- Work order count per quarter, so a metric moving on tiny volume is not over-read.
- Exceptions note
- One or two sentences on events that distorted a quarter, such as a storm or a site closure.
- Open commitments
- Actions promised in the last review, with status and due date.
Normalizing the data before you trend it
A vendor should never be penalized, or flattered, by changes that are not its doing. Normalize before you compare.
Hold definitions constant
Segment by priority
Adjust for volume
Separate causes
Keep one source
Checklist before the scorecard goes to the vendor
How Oxmaint supports a rolling vendor scorecard
Trending depends on consistent records. When vendor technicians work from the same system, the scorecard builds itself from daily activity.
- Corrective and preventive work orders in one record, so repeat visits are visible.
- Mobile completion with photos and notes to support documentation scoring.
- Asset-level history that links vendor performance to specific equipment.
- Reports that can be filtered by site, vendor, priority, and period.
Common mistakes when trending vendor performance
Too many measures
Trending without context
Surprise delivery
Rewarding only improvement
FM vendor performance trending FAQ
Why four quarters instead of two or six?
Four quarters cover a full seasonal cycle and give enough points to see direction without burying recent change.
Can I trend a vendor with limited data?
Yes, but show work order counts beside every percentage and avoid conclusions from very small volumes.
Where does the data come from?
From work order timestamps, completion records, and preventive schedules. Start a free account to see how vendor reports are built.
How often should the scorecard be refreshed?
Update monthly for internal awareness and formally each quarter. A monthly view helps catch sharp drops earlier.
Should vendors see their own scorecard?
Yes. Shared definitions and data build trust and give vendors time to correct course. Book a demo to see report sharing.
Scope the scorecard by risk and spend
Trending every supplier equally spreads effort too thin. Group vendors by how much damage a decline would cause.
Critical service vendors
Integrated or bundled contracts
Specialist contractors
Low-value routine vendors
Interpreting a single metric across four quarters
Direction matters, but so does the size of each move. Use consistent rules so different reviewers reach the same conclusion.
| Pattern | Rule of thumb | Suggested label | Action |
|---|---|---|---|
| Two moves up, one flat | Positive trend sustained | Improving | Acknowledge and share the result |
| Within a narrow band all year | Movement smaller than normal variation | Stable | Continue routine review |
| Two consecutive declines | Same direction twice in a row | Slipping | Raise at the next review with data |
| Large swings both ways | Alternating gains and losses | Volatile | Check workload, staffing, and data quality |
| One sharp fall after steady results | Single unusual quarter | Event-driven | Ask for cause and recovery plan |
Agree the thresholds with the vendor in advance, so labels are not argued each quarter.
A conversation guide for the vendor meeting
Lead with agreed facts
Show the whole window
Ask before concluding
Agree one or two actions
Set the next checkpoint
Situations that need extra care
- New vendors
- With fewer than four quarters, show what you have and label it as an early view. Compare to onboarding targets, not a mature baseline.
- Seasonal services
- Heating, cooling, and grounds work vary by season. Compare each quarter with the same quarter last year where possible.
- Scope changes
- When service lines are added or removed, annotate the break and avoid comparing unlike periods without adjustment.
- Site closures and projects
- Major works can distort response and completion. Record the event and exclude or flag affected work orders.
Linking trend findings to contract options
A trend only matters if it changes a decision. Match each finding to the lever the contract already gives you.
| Finding | Contract lever | Evidence to prepare |
|---|---|---|
| Sustained decline in one metric | Formal improvement plan with milestones | Four-quarter view, work order references, agreed definitions |
| Repeated breaches of the same SLA | Service credits or remedies in the agreement | Breach list with dates and recorded causes |
| Strong improvement after intervention | Recognition, term extension, or incentive | Trend line and independent confirmation |
| Decline with no recovery | Escalation, performance notice, or market testing | Scorecards, minutes, action log, and exported records |
A four-week setup plan
Choose measures
Clean the data
Back-fill quarters
Share and agree
Starting with imperfect history is better than waiting for a full year of clean data. Label early quarters honestly and improve them as records mature.
What the numbers do not capture
Metrics lag behavior. Pair the scorecard with observations from the people who work alongside the vendor every day.
- Site managers noticing more handovers, new faces, or changing supervisors.
- Tenants or occupants reporting slower responses before figures change.
- Technicians arriving without the right parts or access information.
- Reports becoming shorter, later, or less specific over several months.
- Vendor staff raising fewer proactive improvement suggestions than before.
Record these observations in a short note beside each quarter. They often explain a drift before the data can.
Choosing early indicators over late ones
| Indicator type | Examples | Strength | Weakness |
|---|---|---|---|
| Leading | Acknowledgment time, preventive task start dates, backlog age | Moves before service visibly suffers | Needs consistent timestamps |
| Lagging | Repeat visits, SLA breaches, complaints, failures | Reflects real outcomes | Arrives after the damage is done |
| Behavioral | Report quality, proactive suggestions, attendance at reviews | Signals engagement | Subjective and harder to compare |
A balanced scorecard includes at least one leading indicator for each major service line.