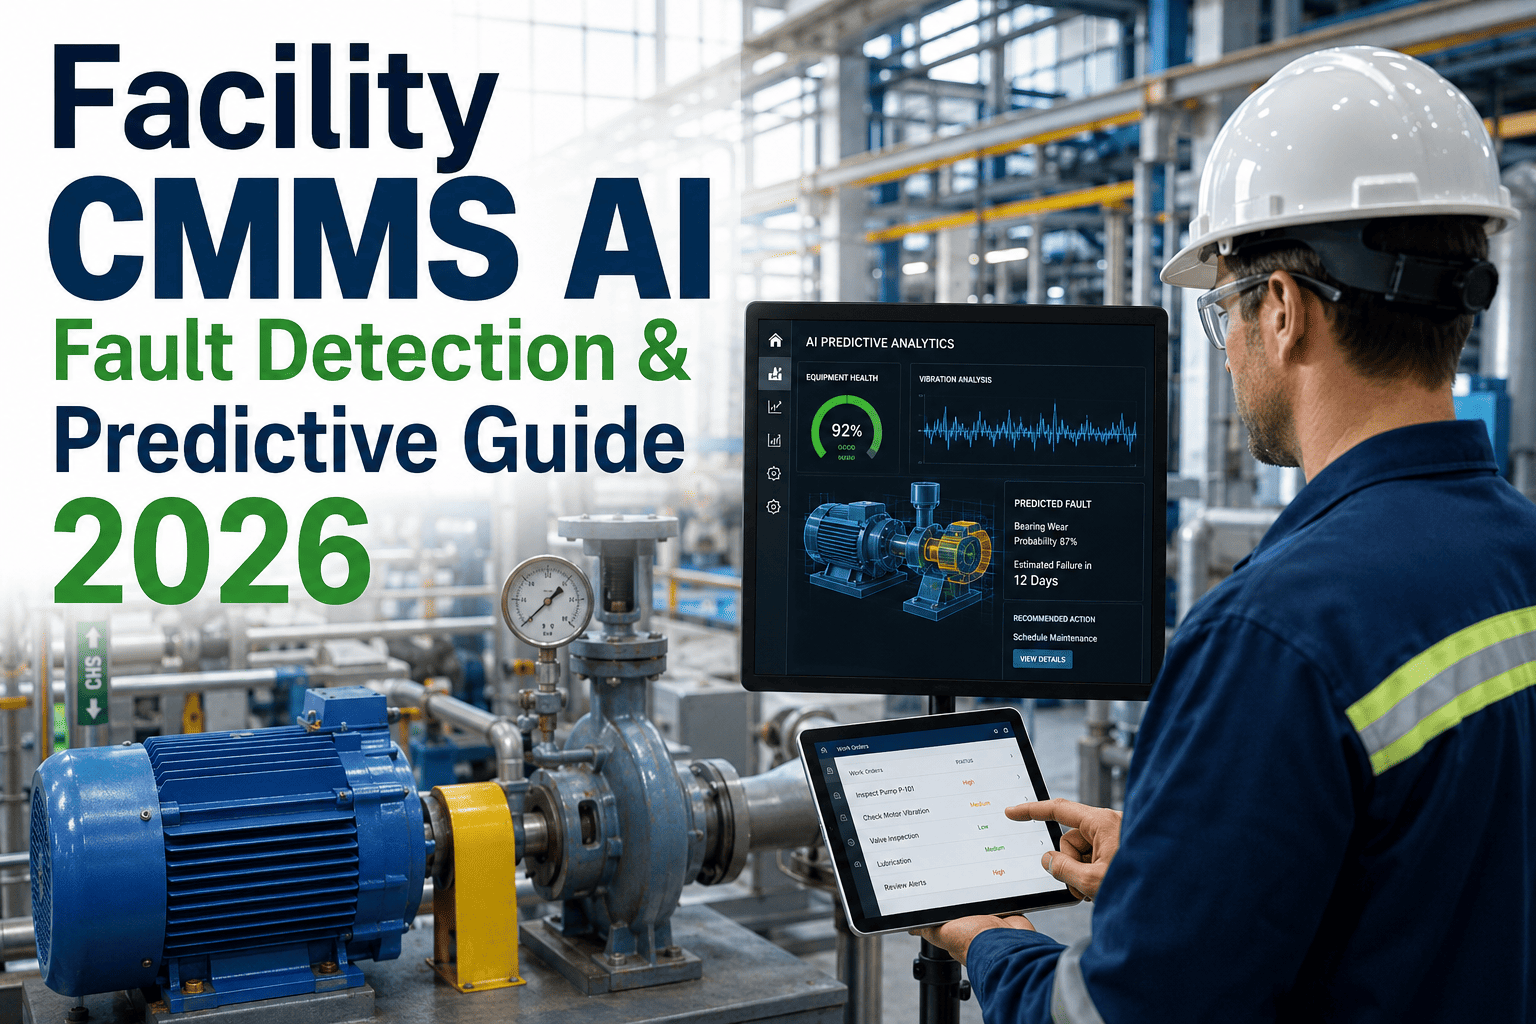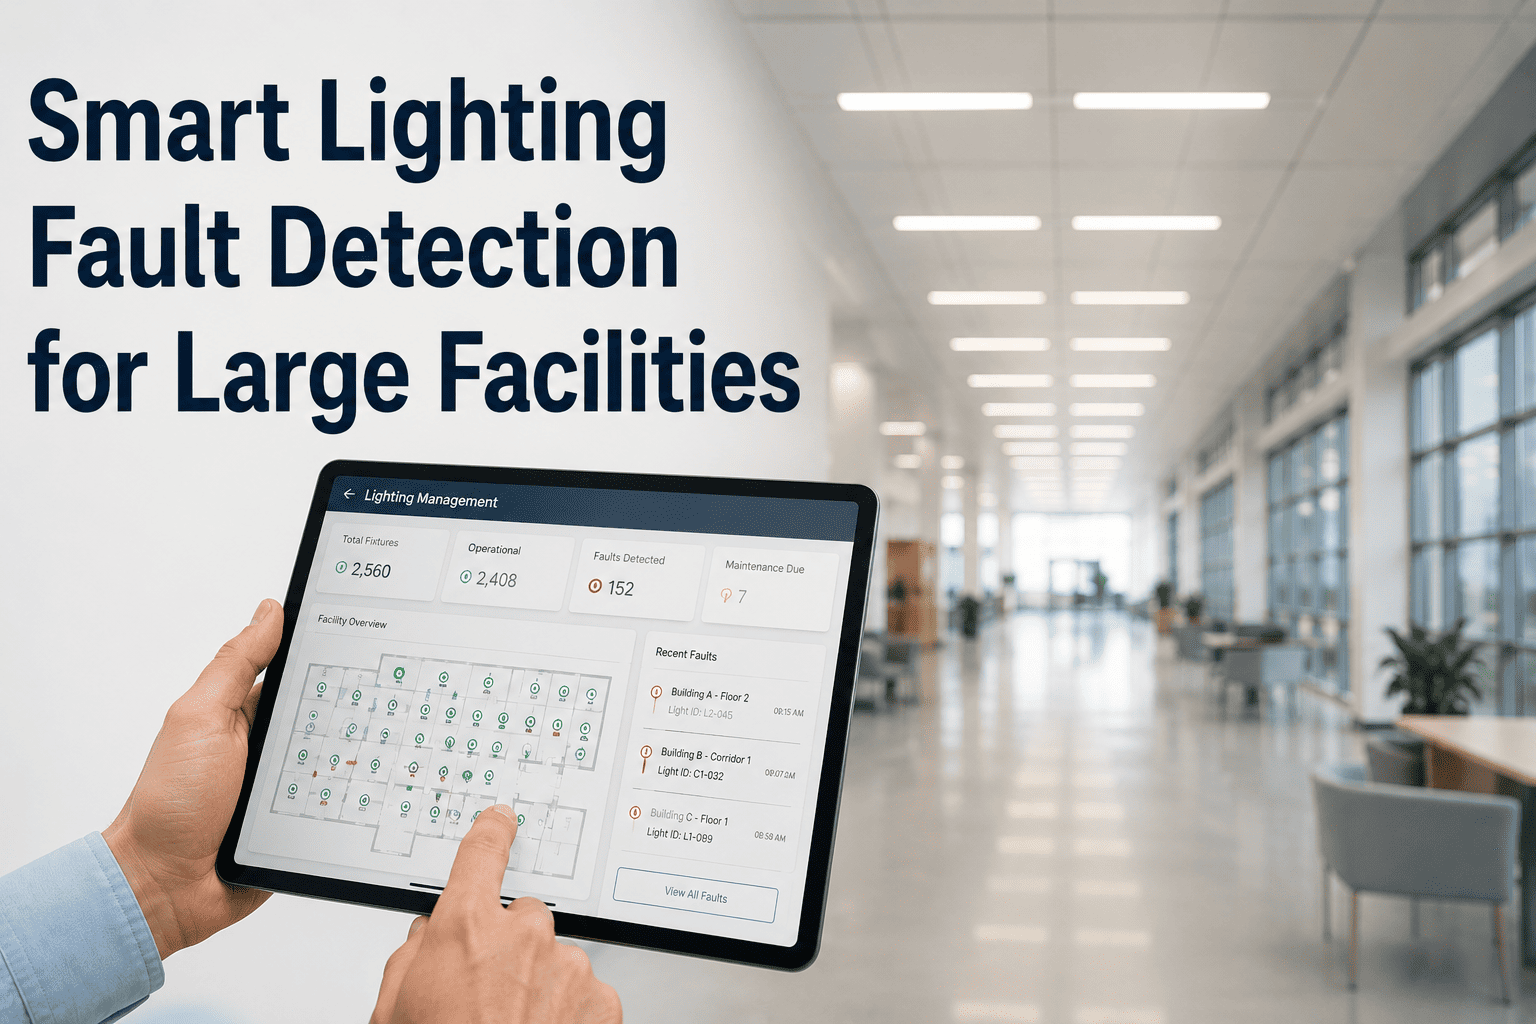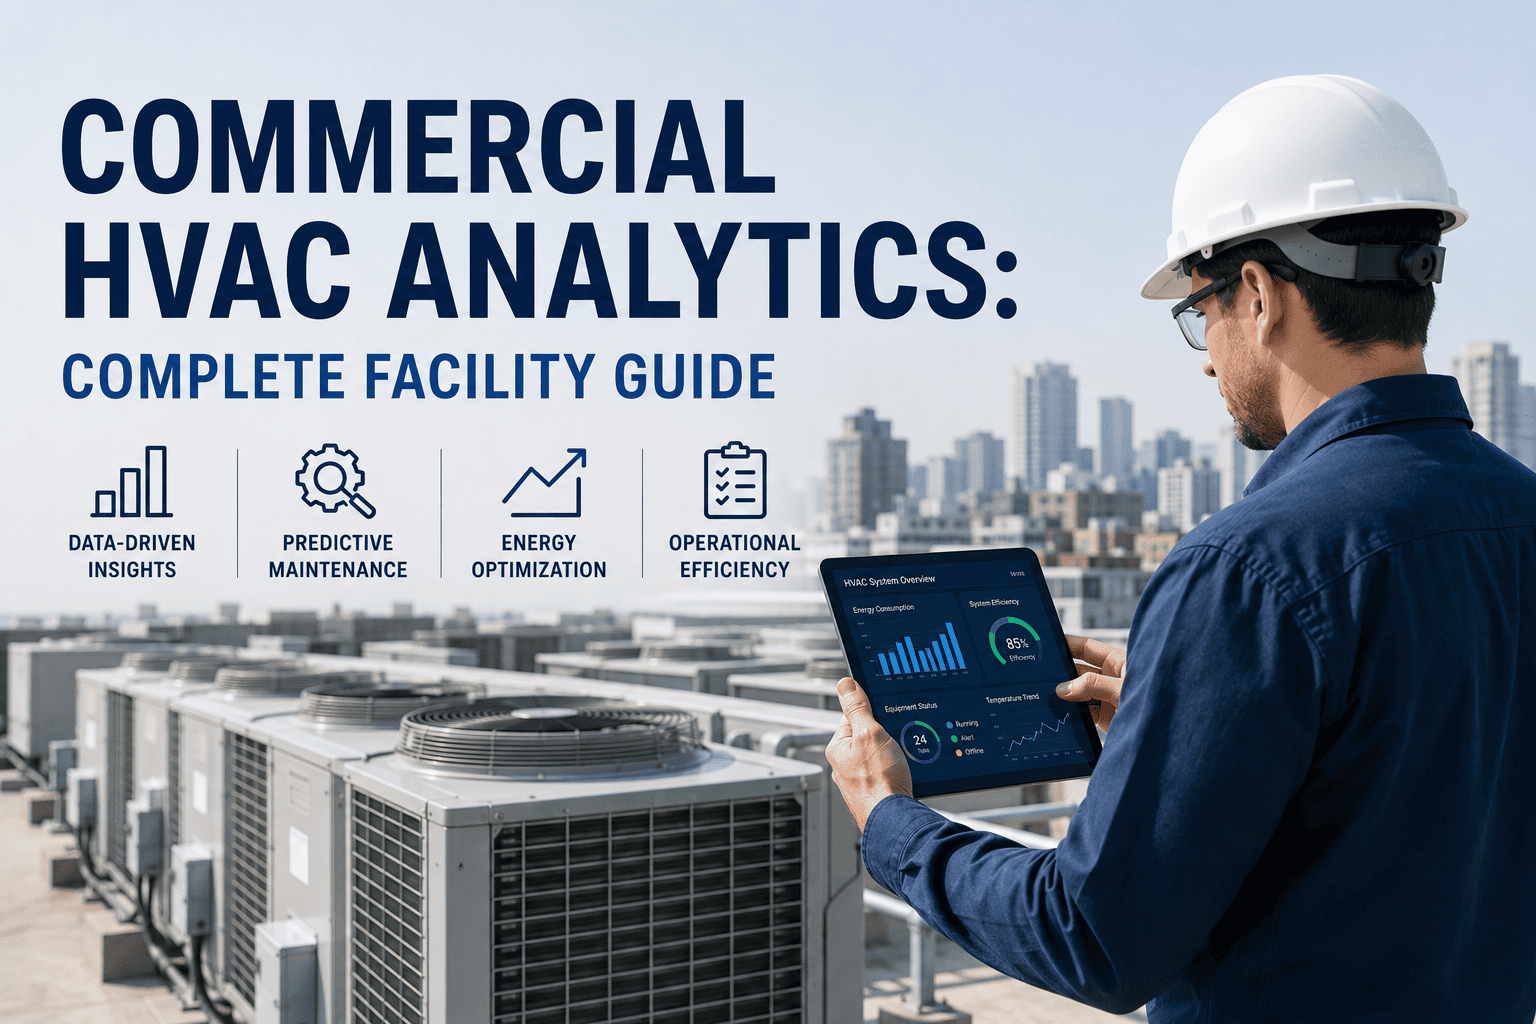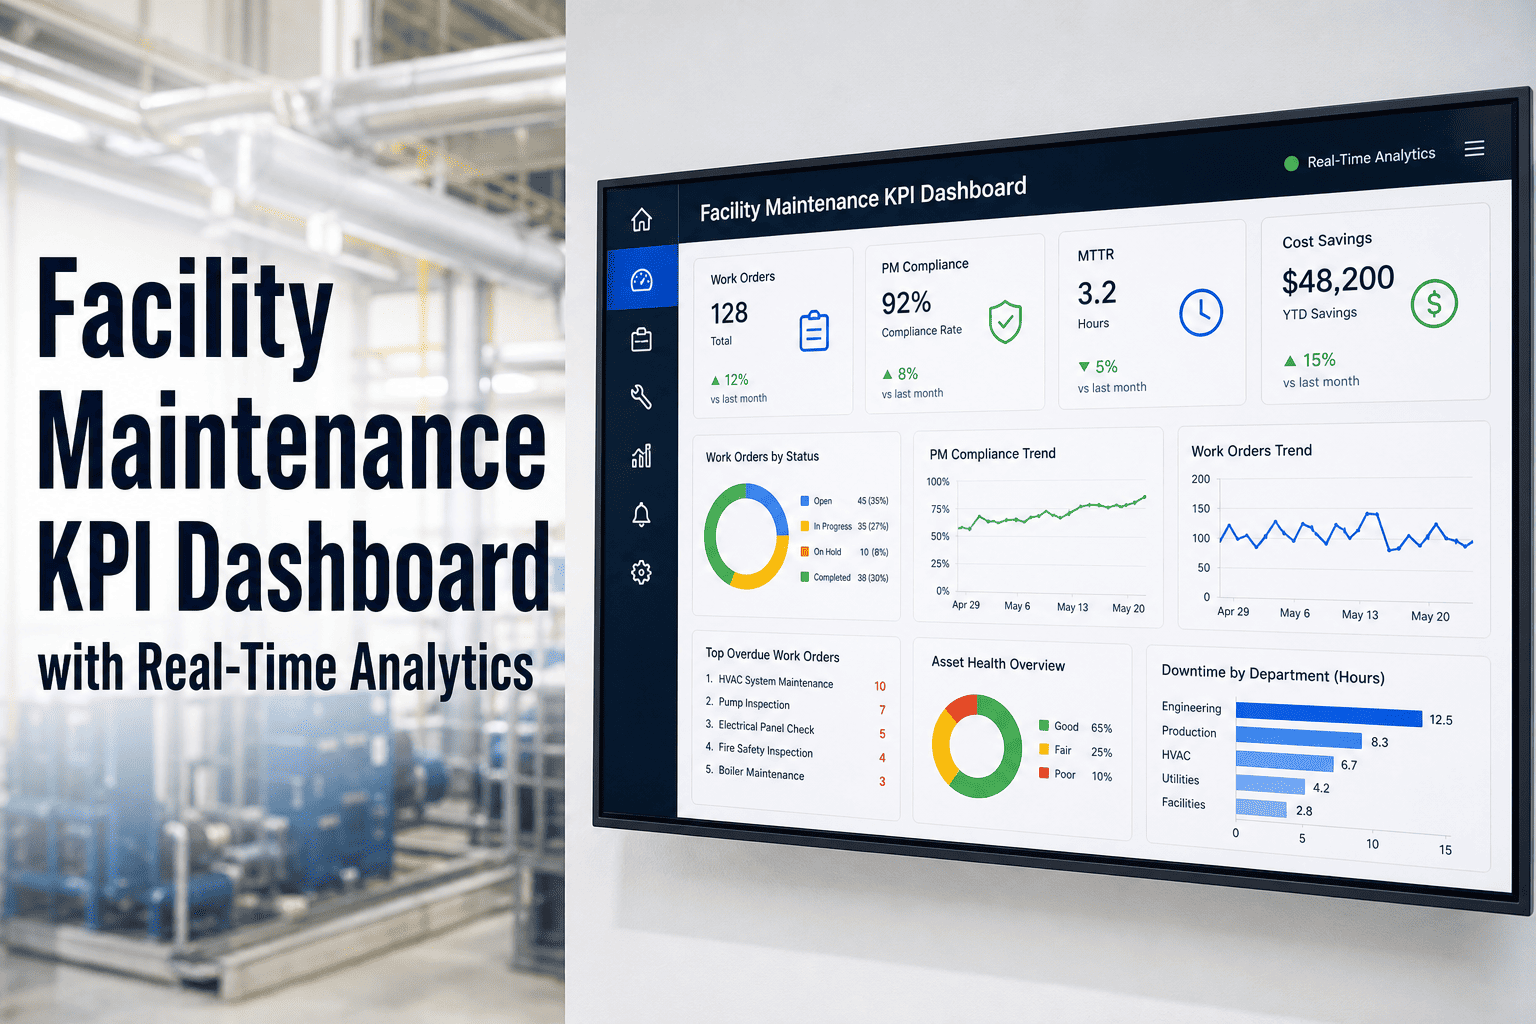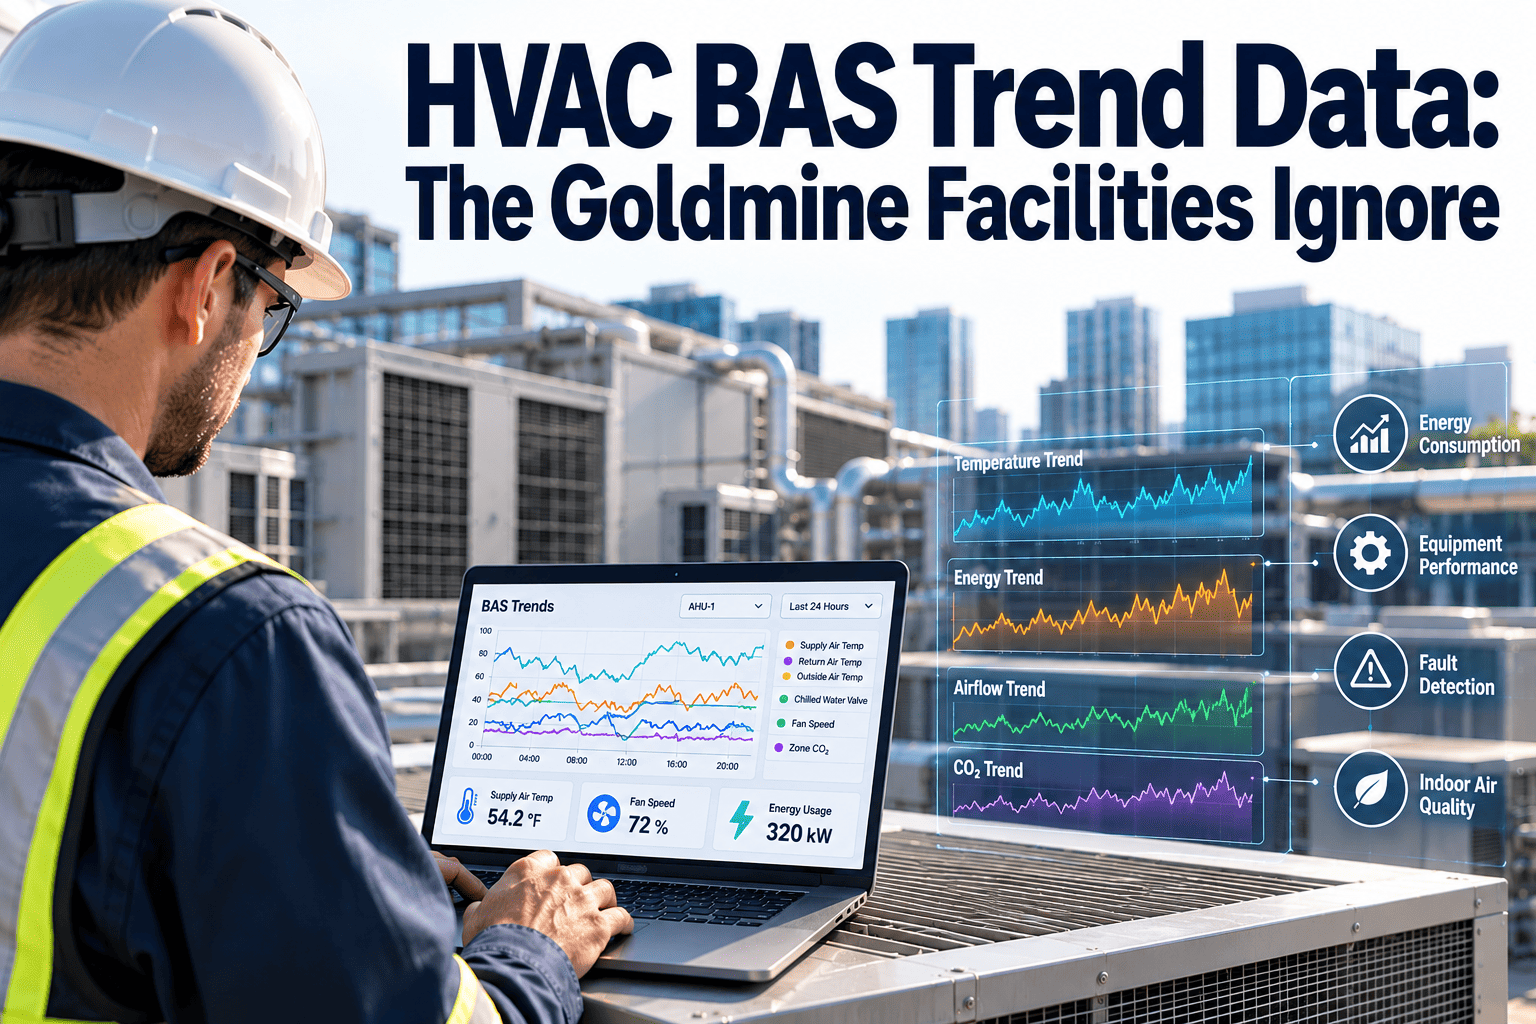
Most commercial buildings already log thousands of HVAC points, yet the trend logs sit in a controller buffer or a forgotten export folder until someone needs evidence after a complaint. That history holds early fault signals: valves that leak by, dampers that stick, sensors that drift, and loops that hunt all day. This article explains how BACnet trend data is structured, which patterns are worth mining, and how to turn each finding into a tracked repair. Sites that route findings into maintenance management software close the gap between a detected fault and a finished job.
HVAC BAS Trend Data: The Goldmine Facilities Ignore
Your building automation system already records what every fan, valve, damper, and sensor is doing. The value is in reading those trends systematically and sending the exceptions to the people who can fix them.
Why trend data goes unread
The data is rarely missing. The problem is that nobody owns the review step. Four patterns explain most of the neglect.
Alarms get attention, trends do not
Operators respond to alarms because alarms interrupt. A slow drift never crosses an alarm limit, so it never interrupts anyone.
Logs are configured once and forgotten
Intervals, buffer sizes, and point lists are set at commissioning and rarely revisited as equipment changes.
Graphs need an expert eye
Reading raw trend charts takes experience and time that most small teams do not have during a busy week.
Findings have nowhere to go
Even when someone spots a fault, it ends up in an email or a hallway conversation instead of a tracked job.
How BACnet trend data is stored
ASHRAE 135, the BACnet standard, defines trend log objects that record property values over time. Knowing how they behave helps you avoid gaps and false conclusions.
- A trend log object samples a point on a fixed interval or records a value when it changes by a set amount, known as change of value.
- A trend log multiple object can record several properties together, which keeps related values on the same timestamp.
- Each log has a finite buffer. When it fills, it either stops or overwrites the oldest records, depending on configuration.
- Records can carry status flags and error entries, so a gap in the data can be told apart from a flat value.
The practical lesson is that controller buffers are short-term storage. Mining trends for months requires regularly offloading the data to a historian, database, or analytics platform.
Choosing a sample interval
| Point type | Typical interval | Reason |
|---|---|---|
| Fast control loops such as static pressure or valve position | 1 to 5 minutes | Needed to see hunting and oscillation |
| Air temperatures: supply, return, mixed | 5 to 15 minutes | Balances detail with storage |
| Space temperatures and setpoints | 15 minutes | Slow-moving, good for comfort analysis |
| Power and energy meters | 15 minutes, matching the utility interval | Aligns with demand data |
| Status and schedule points | Change of value | Captures every transition without wasted samples |
The fault pattern library
Each pattern below can be detected with simple rules on trended data. Start with the ones that waste the most energy or cause the most complaints.
| Fault pattern | Points to trend | Rule logic | Typical work order |
|---|---|---|---|
| Simultaneous heating and cooling | Heating valve, cooling valve | Both positions above a small threshold at the same time | Inspect valves, actuators, and sequence logic |
| Leaking valve | Valve command, coil discharge temperature | Valve commanded closed while discharge temperature still shifts | Test and replace valve or actuator |
| Stuck or failed economizer | Outdoor, return, and mixed air temperature, damper command | Mixed air temperature inconsistent with damper position and the two inlet temperatures | Check damper linkage, actuator, and sensors |
| Hunting control loop | Controlled variable, output | Repeated reversals of output within a short period | Retune the loop or inspect the actuator |
| Sensor drift | Redundant or related sensors | Persistent offset against a reference or against expected physics | Calibrate or replace the sensor |
| Short cycling | Equipment status, run command | Starts per hour above a limit | Check controls, differentials, and capacity |
| Schedule override left active | Occupancy schedule, status, command source | Equipment running outside scheduled hours for extended periods | Clear the override and review the schedule |
| Zone damper pinned open | Damper position, zone temperature | Position near full open for long periods while temperature misses setpoint | Check airflow, supply conditions, and zone load |
For sequences of operation that reduce many of these faults at the design stage, many teams reference ASHRAE Guideline 36, which describes high-performance control sequences for HVAC systems.
Query patterns that find real problems
Whether your data sits in a historian, a database, or a spreadsheet export, the same query shapes repeat. These plain-language patterns show the logic.
Persistent offset
For each air handler, compute the average of
(mixed air temp minus the weighted blend of
return and outdoor temp) over the last 7 days.
Flag units where the average error exceeds a limit.
Run-time outside schedule
For each fan, sum hours with status = on
while the occupancy schedule = off.
Rank by hours per week, highest first.
Loop reversal count
For each valve output, count direction changes
per hour. Flag any loop above a set count for
three or more consecutive days.
Stuck value
For each analog sensor, flag any point with
zero change over 24 hours while related
points continue to move.
The thresholds are site-specific. Start loose, review the first batch of flags with technicians, and tighten the rules as false positives are removed.
Turn a flagged trend into a finished repair
Send each confirmed finding to a work order with the trend evidence attached, so nothing depends on someone remembering to follow up.
A dashboard built for exceptions, not for decoration
A useful BAS analytics view answers one question: what needs attention today? Structure it so the answer is obvious in seconds.
- Rank exceptions by consequence, such as wasted energy, occupant complaints, or equipment risk.
- Show age so stale faults are as visible as new ones.
- Let a technician open the related equipment record from the same row.
Data quality comes before analytics
Rules built on poor data create noise that teaches people to ignore the output. Check these items first.
Consistent point names
Use a structured naming convention or a semantic model such as Project Haystack or Brick so rules apply across many units.
Synchronized clocks
Controllers with drifting time make cross-equipment comparisons unreliable.
Correct units and scaling
A sensor reported in the wrong unit can create false faults across a whole fleet.
Gap handling
Distinguish communication loss from a flat reading before flagging a stuck sensor.
Offload and retention
Move data off controllers on a schedule and keep enough history to compare seasons.
From viewing graphs to predicting failures
Most sites progress through stages. Knowing where you are helps you choose the next investment.
Reactive viewing
Trends are opened after a complaint to explain what happened.
Scheduled review
A named person reviews a short list of reports weekly.
Rule-based detection
Automated rules flag faults and open tracked jobs.
Condition-based maintenance
Trend features such as run-time, starts, and loop effort inform when to service equipment.
Even stage two delivers value if the review is consistent and each finding becomes a work order.
A 30-day plan to start mining your trends
Pick the scope
Choose one equipment type, such as air handlers, and confirm which points are already trended.
Fix the data
Correct names, units, intervals, and buffers, and set up regular data offload.
Run three rules
Start with simultaneous heating and cooling, off-schedule run-time, and stuck sensors. Review results with technicians.
Route findings to work orders
Create a standard request format and measure how many flags become verified repairs.
Where Oxmaint fits in the workflow
A BAS or analytics platform detects the pattern. A maintenance system makes sure someone fixes it and learns from the result. Oxmaint covers that second half.
- Work orders capture the finding, the evidence, the assigned technician, and the closing notes.
- Asset records link each air handler, valve, and sensor to its repair history so repeat faults stand out.
- Preventive maintenance schedules include calibration checks, actuator inspections, and sensor verification.
- Mobile workflows let technicians confirm the fault at the unit and attach photos.
- Reports show recurring fault types, time to repair, and repeat failures by equipment class.
How data reaches the maintenance system depends on your BAS and analytics tools. Confirm the integration approach for your platform before planning the rollout.
KPIs that prove the program is working
Reading a trend chart like a technician
Rules find candidates. A person still confirms the diagnosis. These visual cues speed up that confirmation when you open a flagged unit.
- Overlay the command and the feedback for the same device. A valve that is commanded to move while the temperature does not respond points to a stuck or leaking device.
- Compare weekday and weekend profiles. Matching profiles on an unoccupied weekend suggest schedules or overrides are not doing their job.
- Plot against outdoor temperature. Many faults only appear in a certain weather range, such as economizer problems in mild conditions.
- Look at start and stop times across several days. Creeping start times often indicate optimal start logic or a changed setpoint nobody documented.
Three flags worth confirming at the unit
Mixed air temperature that never moves with damper position suggests a failed damper actuator or a disconnected linkage.
- Discharge temperature drifting warm while the cooling valve is closed suggests the valve is not sealing.
- Static pressure sitting at a limit with fans at full speed suggests a restriction, a failed sensor, or a stuck zone damper.
Turning findings into good work orders
A flagged fault only helps if the work order is specific enough for a technician to act on without re-investigating from scratch.
Equipment and location
Name the exact unit, floor, and zone, tied to the asset record rather than a free-text description.
Observed pattern
State the rule that fired, the time window, and a link or snapshot of the trend.
Suspected cause
Give a short suggested starting point, such as inspect the actuator or verify the sensor against a reference.
Priority and impact
Indicate whether the risk is comfort, energy, or equipment protection so scheduling is rational.
Closing evidence
Require a note on what was found and a post-repair trend check, so the loop truly closes.
The post-repair check matters most. If the rule stops firing after the repair, you have proof of the fix. If it keeps firing, you caught an incomplete repair early.
Common mistakes in BAS trend analytics
- Trending everything at the fastest interval. It fills buffers quickly and hides useful signals in noise.
- Launching dozens of rules at once. Teams cannot validate that many, and false positives destroy trust.
- Ignoring seasonal context. A rule that works in summer may flag normal winter behavior.
- Skipping point verification. Mislabeled or miswired points create convincing but false faults.
- Not closing the loop. Findings without owners and deadlines simply move the unread pile to a new place.
A smaller set of trusted rules that technicians believe will outperform a large set nobody checks. Add rules only as fast as the team can review the output.
Who should own the review
Trend mining fails when it is everyone's job. Name an owner for each site and agree a short routine.
- The controls lead maintains point lists, intervals, and rule logic.
- A maintenance planner reviews the exception list at a fixed time each week and releases work orders.
- Technicians confirm faults at the unit and record what they found, which feeds back into rule tuning.
- The facility manager reviews the repeat-fault and time-to-closure figures monthly.
A one-page routine with these four roles is usually enough to move a site from occasional viewing to a steady review habit.
HVAC BAS trend data questions
How long should I keep BAS trend data?
Keep at least a full year so you can compare seasons. Longer history helps with equipment aging and retrofit verification.
Do I need new sensors to start?
Usually not. Many useful rules use points your controllers already trend, such as valve positions, temperatures, and status.
Is interval or change of value better for logging?
Use fixed intervals for analog values and change of value for status points. Mixing both is normal and recommended.
Who should review the exception list?
Assign one named owner per site, then book a demo to see how findings become assigned work orders.
Can findings be tracked as maintenance tasks?
Yes. You can create work orders from each fault and keep the repair history on the asset.
Stop letting building data sit unread
Connect the faults your BAS can show to the maintenance workflow that fixes them, with a clear record from detection to closure.