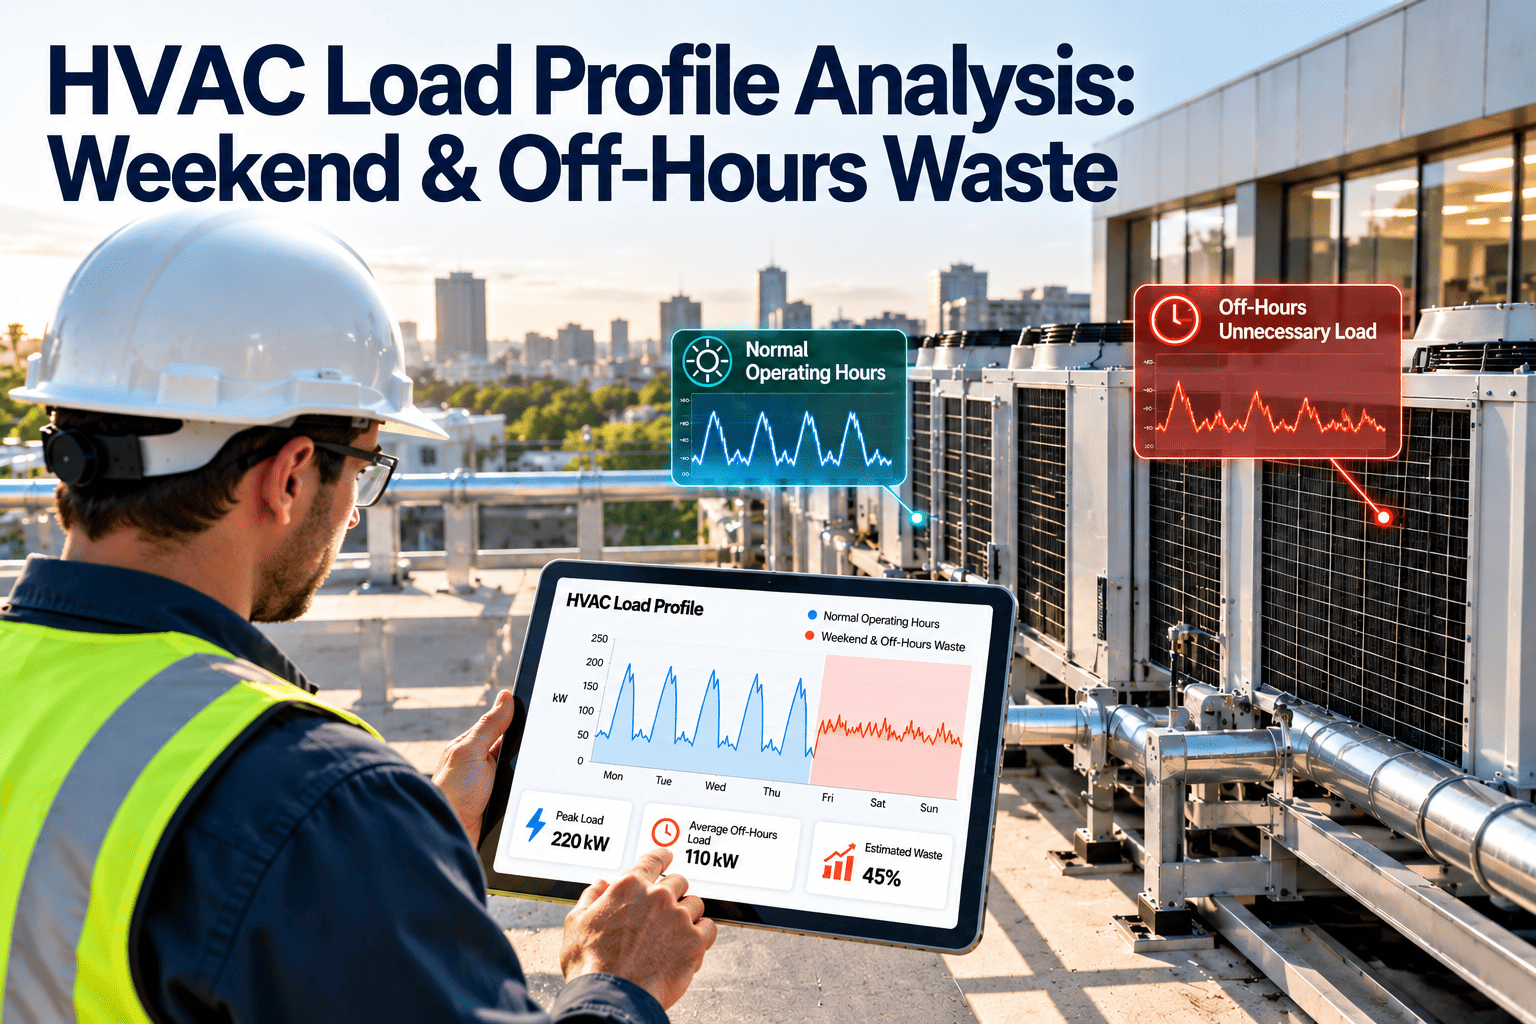
On a Saturday afternoon, an empty office building should look very different on the meter than it does on a Tuesday. In many commercial buildings it does not, because schedules were overridden years ago, dampers stick open, or pumps and fans never get the stop command. HVAC load profile analysis plots demand by hour and day to expose that gap. This guide explains how to build the profile, read the patterns, quantify the waste, and turn findings into tracked fixes using a maintenance management platform instead of a one-time report.
HVAC Load Profile Analysis: Weekend and Off-Hours Waste
Compare how your building actually runs after hours with how it should run, then fix the difference.
What a Load Profile Actually Shows
A load profile is a plot of electricity, chilled water, or heating demand against time, built from interval meter or building automation data. It turns a monthly bill into a daily story.
Data sources to combine
- Utility interval data or submeter readings, ideally 15-minute resolution.
- BAS trends for fan status, valve position, and supply temperatures.
- Occupancy schedules, badge data, or lease hours for context.
- Weather data, so weather-driven load is not mistaken for waste.
Benchmarking Context: ENERGY STAR and Portfolio Manager
The U.S. EPA's ENERGY STAR Portfolio Manager, supported by DOE programs, gives owners a way to track energy use over time and compare buildings on a weather-normalized basis.
Using both together
- Benchmark the portfolio and flag buildings with high or rising intensity.
- Pull interval data for those buildings first.
- Build weekday, Saturday, and Sunday profiles separately.
- Investigate the largest off-hours gaps before small daytime tuning.
Measuring the Off-Hours Gap
Compare this ratio to your own design intent. A large drop is often expected for an empty building, but the right target depends on tenants, data rooms, and ventilation needs, so set it per building.
Companion measures
- Night baseload as a share of peak weekday load.
- Start-up time compared with first occupancy.
- Shutdown time compared with last occupancy.
- Hours of operation per week for major fans and pumps.
Reading the Pattern: Symptom to Likely Cause
| Profile pattern | Likely cause | First check |
|---|---|---|
| Flat load all weekend | Schedule overridden to continuous or on hand | Review BAS schedules and override log |
| Early morning ramp before occupancy | Start time set far too early, or no optimal start | Compare ramp time with first arrivals |
| Load stays high long after closing | Late shutdown or cleaning-hour overrides | Check end times and zone overrides |
| High night baseload | Pumps, fans, or reheat running unnecessarily | Walk the plant after hours |
| Cooling load in winter nights | Economizer faults or simultaneous heating and cooling | Inspect dampers and valve positions |
| Weekend load jumps at fixed times | Unsynchronized equipment or tenant timers | Match jump times to equipment start logs |
Turn Every After-Hours Finding Into a Tracked Work Order
Common Causes of Off-Hours HVAC Waste
From Data to Fix: A Six-Step Analysis Flow
Collect
Normalize
Profile
Diagnose
Correct
Verify
Worked Example: Estimating the Waste
Turning Findings Into Maintenance Work
- Correct schedules and release stale overrides.
- Restore setback setpoints.
- Enable optimal start and stop where supported.
- Repair stuck dampers and failed actuators.
- Replace drifting sensors.
- Service leaking valves causing simultaneous heating and cooling.
How Oxmaint supports the follow-through
- Work orders assign each finding with priority, due date, and technician.
- Preventive maintenance tasks can verify schedules and actuator operation on a recurring basis.
- Asset records link repeat HVAC problems to specific equipment.
- Mobile workflows let technicians document findings during after-hours walks.
- Reports track completion so savings projects do not stall.
Off-Hours Audit Checklist
- Weekday, Saturday, and Sunday profiles plotted separately.
- Weekend load ratio calculated and compared with a target.
- All BAS overrides and hand-mode points listed.
- Start and stop times compared with real occupancy.
- Night baseload source identified.
- Weather and holidays accounted for.
- Fixes assigned as work orders with owners.
- Profile re-checked after each fix.