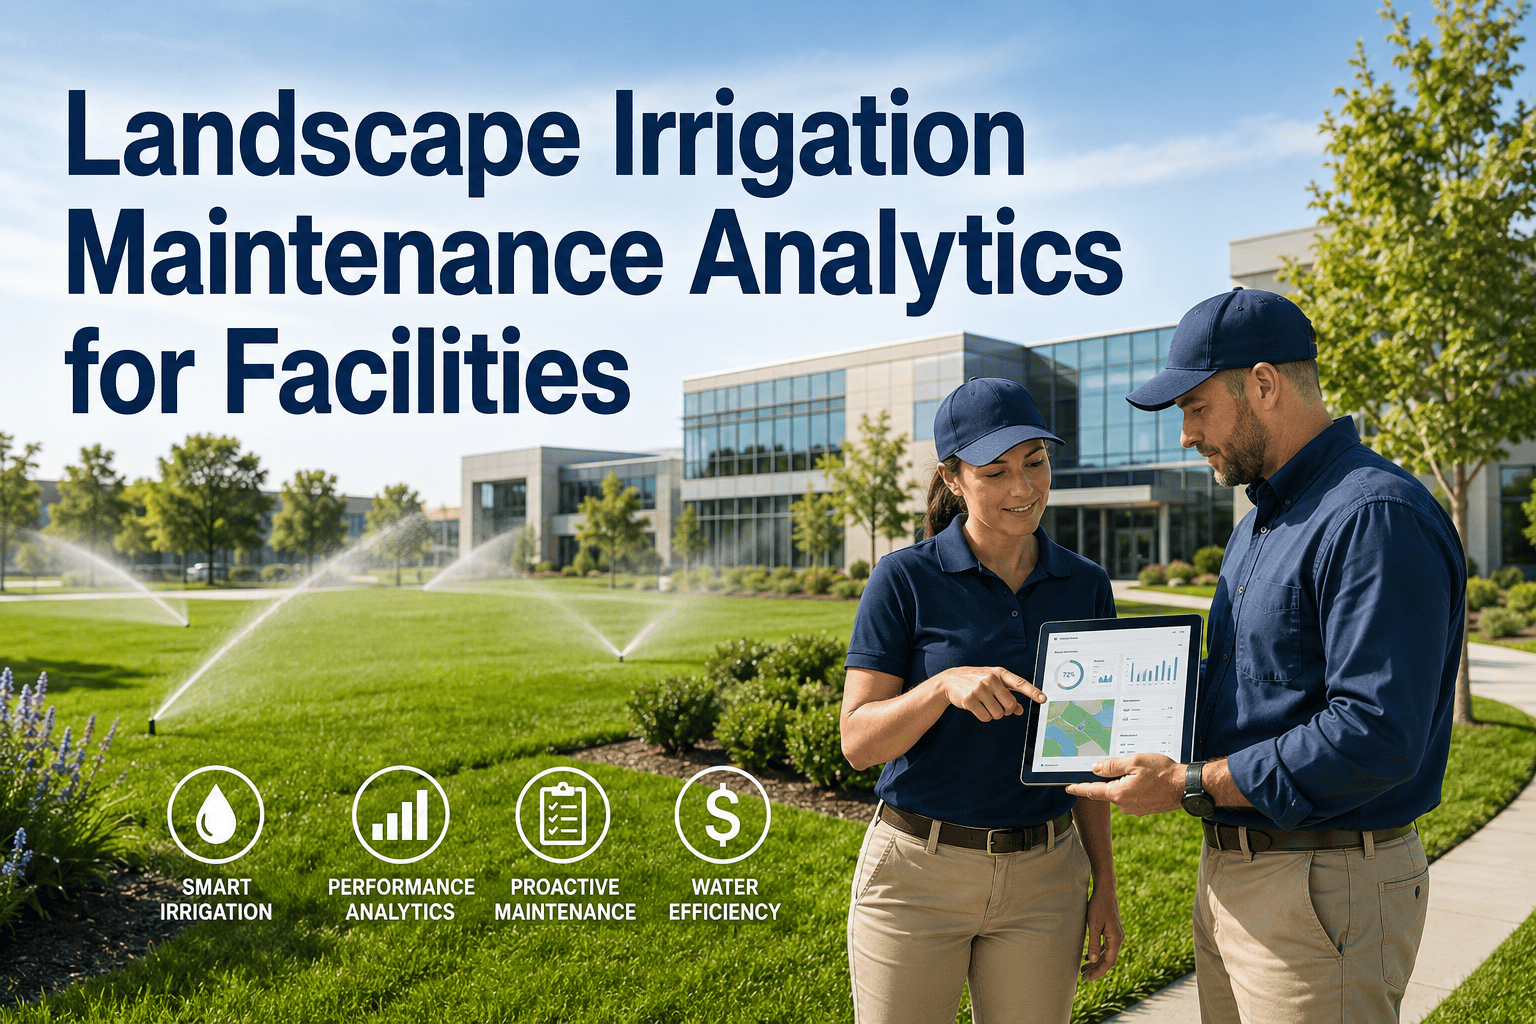
Landscape irrigation accounts for up to 30% of commercial facility water consumption — yet most facility managers have zero visibility into whether their systems are running efficiently, leaking underground, or wasting thousands of dollars annually on misconfigured schedules. Irrigation maintenance analytics bridges that gap by turning raw equipment data into actionable insights across every zone, controller, and water meter on your property. Book a Demo to see how Oxmaint monitors irrigation assets and drives measurable water savings across your portfolio.
30%
Water Used by Irrigation
$8K
Annual Overspend per Site
40%
Savings with Smart Scheduling
Why Irrigation Data Gets Ignored — and What It Costs
Commercial irrigation systems are installed and largely forgotten. Seasonal contractors set schedules in spring that run unchanged through fall droughts and winter freeze risks. Emitters clog, zone valves fail, and backflow preventers go untested for years. The result is a silent budget leak: water bills climb, turf dies in patchy zones, and ESG sustainability reports show embarrassing consumption numbers. Facilities that track irrigation as a managed asset category instead of a background utility consistently outperform on water costs and environmental metrics.
Without Analytics
Fixed seasonal schedules regardless of rainfall
Leaks discovered only after water bill spikes
No zone-level visibility into water consumption
Equipment failures found during landscaper visits
Zero data for ESG or sustainability reporting
With Oxmaint Analytics
Weather-adjusted schedules reduce overwatering
Anomaly detection flags leaks within 24 hours
Zone-level water use tracked per square foot
Automated PM triggers for valves, heads, controllers
Real-time data feeds ESG and utility reports
ESG & ENERGY REPORTING
Turn Water Waste Into a Measurable, Managed Asset
Oxmaint tracks irrigation equipment health, water consumption by zone, leak alerts, and sustainability KPIs — all in one platform. Your water bill will thank you.
Key Metrics Every Facility Should Track
| Metric |
Benchmark |
Poor Performance Signal |
Oxmaint Alert |
| Gallons per Irrigation Cycle | Stable ±5% | >15% variance from baseline | Leak or valve fault |
| Zone Runtime vs Schedule | 100% match | Zones skipping or repeating | Controller fault |
| Monthly Water Use per Acre | Site-specific target | >25% above seasonal norm | Scheduling review |
| Backflow Test Date | Annual | Test overdue by 30+ days | Compliance alert |
| Emitter/Head Replacement Rate | <5% per season | >10% in single quarter | System audit needed |
Expert Review
Priya Nair, LEED AP
Sustainability Director, Multi-Site Commercial Real Estate — 16 Years
"We were spending over $200,000 annually across our portfolio on landscape water costs with almost no data on where it was going. When we implemented irrigation analytics, we discovered three properties had zone valves stuck open that had been running full-flow for months. Within one season, we recovered $44,000 in water costs and generated the utility reduction data we needed for our LEED recertification. Tracking irrigation as a real asset with maintenance history and consumption metrics changed how our entire team thinks about water. It's not a utility — it's a system that needs to be managed."
Frequently Asked Questions
What irrigation equipment can Oxmaint track and schedule maintenance for?
Oxmaint tracks all major irrigation components as individual assets: smart controllers, zone valves, backflow preventers, rain sensors, emitters, drip lines, and pump stations. Each asset gets its own maintenance history, inspection schedule, and replacement timeline. You can link water meter readings directly to zones and flag consumption anomalies automatically through the
Oxmaint platform. This gives facility managers complete visibility from water source to individual emitter.
How does irrigation analytics support ESG and sustainability reporting?
Oxmaint generates utility consumption reports that break down water use by zone, property, and time period — exactly the format needed for LEED, ENERGY STAR, and corporate ESG reporting. The platform tracks year-over-year water reduction trends and can benchmark properties against industry standards. This data is increasingly required by institutional investors and tenants and is difficult to produce without asset-level tracking.
Book a demo to see the ESG reporting module in action.
Can Oxmaint detect irrigation leaks before they show up on a water bill?
Yes. By establishing consumption baselines per zone and comparing real-time meter data against scheduled run times, Oxmaint flags anomalies that indicate underground leaks, stuck-open valves, or broken laterals typically within 24–48 hours of the issue beginning. Most facilities without analytics discover irrigation leaks only when the monthly water bill arrives — by which point 30 days of loss has already occurred. Early detection consistently recovers 3–5x the cost of the platform in water savings alone.
What is the ROI of implementing irrigation maintenance analytics?
Industry data from the EPA WaterSense program and facility management research indicates commercial properties implementing smart irrigation management achieve 15–40% water use reductions within the first year. For a mid-size commercial campus spending $50,000 annually on landscape water, that represents $7,500–$20,000 in direct savings. Add avoided leak damage, reduced contractor callouts, and ESG reporting value, and the payback period for most facilities is under 6 months.
Start your free trial and run the numbers for your property.
WATER SAVINGS START HERE
See Every Zone. Measure Every Gallon. Stop Every Leak.
Oxmaint's irrigation analytics module gives facility teams the data they need to reduce costs, achieve sustainability targets, and keep equipment running year-round.