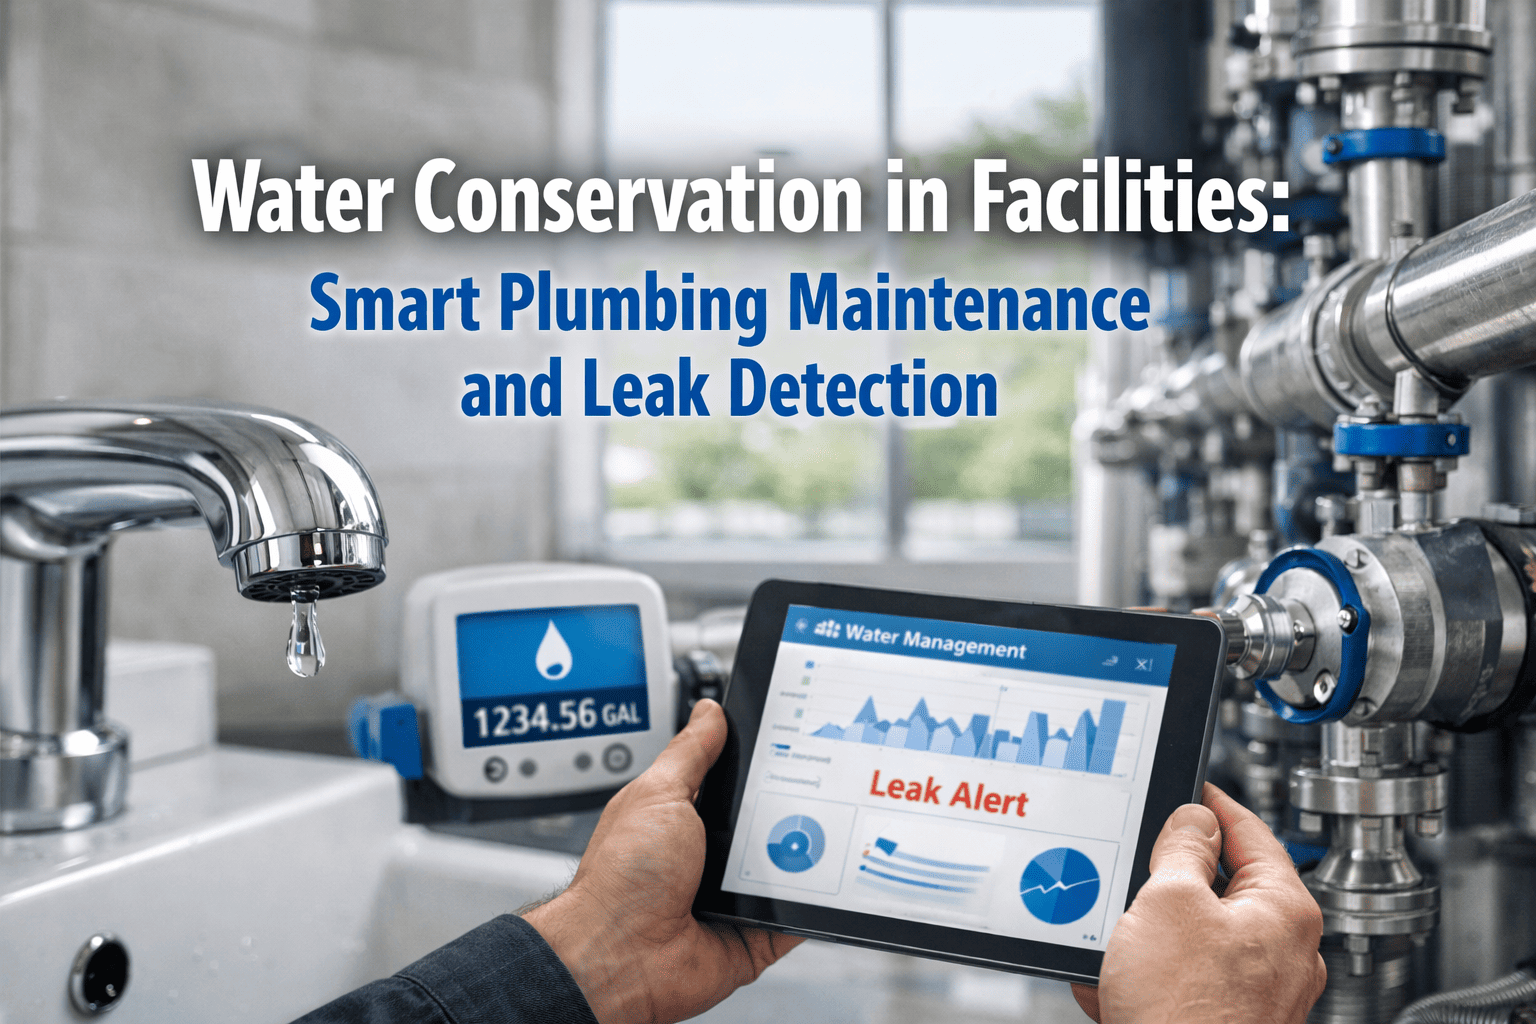
US households and commercial facilities waste nearly 900 billion gallons of water annually from leaks alone — enough to supply 11 million homes for a year, according to the EPA. In a facility context, that waste is almost entirely invisible: a running toilet flapper on the sixth floor, an HVAC make-up water valve that never fully closes, an irrigation solenoid stuck open overnight. None of these generate an alarm. All of them show up as a slow rise in the monthly water bill that gets attributed to occupancy changes rather than fixable plumbing failures. Most buildings have a single incoming meter, which means all consumption is one number with no system-level visibility. OxMaint's preventive maintenance platform connects plumbing PM schedules, consumption baselines, smart sensor alerts, and work order history into a single water management workflow — so leaks are found in hours rather than billing cycles, and conservation targets are tracked against real sub-meter data rather than estimates.
Water Conservation in Facilities: Smart Plumbing Maintenance and Leak Detection
01 — Facility Water Audit: Establishing Your Consumption Baseline
You cannot reduce what you cannot measure. A water audit establishes consumption baselines by system — HVAC, restroom fixtures, irrigation, process cooling — so that anomalies trigger investigation rather than surprise. Without sub-meter data, a 15% rise in monthly consumption could be a new tenant, a seasonal irrigation cycle, or a failed toilet fill valve running continuously. There is no way to distinguish them from a single incoming meter reading.
The EPA recommends investigating any facility showing more than 12,000 gallons per occupant per month as a potential leak indicator. For most office and institutional buildings, actual consumption should be significantly lower. Benchmark data shows 15–30% reductions from baseline are consistently achievable through leak repair and fixture upgrades alone, before any behavioural or process changes are implemented.
Pull 24 months of utility bills. Calculate monthly consumption per occupied sqft and per occupant. Plot the trend and flag any month more than 10% above seasonal average. Compare same-month prior year, not month-over-month, to remove seasonal variation from the analysis.
At 02:00–04:00 when occupancy is zero, record the main meter reading at 30-minute intervals. Any consumption above 0.1 GPM is an active leak. This single test catches continuous-running toilets, dripping valves, and slow pipe leaks that monthly billing data obscures in the average.
Document every fixture by location, type, and age. Measure actual flow rate with a bucket test against EPA WaterSense standards: 1.5 GPM for faucets, 1.28 GPF for toilets, 2.0 GPM for showerheads. Any fixture above standard is a replacement candidate with a quantifiable savings calculation.
Install pulse-output sub-meters on HVAC make-up water, irrigation supply, and restroom risers. This converts water consumption from one monthly number into four or five trackable streams, each with its own baseline, anomaly threshold, and conservation target. Sub-metering typically pays back within 12–18 months from leak detection value alone.
02 — Leak Detection: Finding What the Bill Cannot Tell You
The most expensive plumbing failures are the ones that go undetected for months. A running toilet wastes 3,000–6,000 gallons per month with no visible symptom until a maintenance team happens to notice it. A slow pinhole leak in a concealed pipe joint produces no alarm until the ceiling tile below discolours — by which point the damage has already reached Category 1 or Category 2 severity. Commercial property insurers report that water damage accounts for 42% of all property claims, with the average claim at $13,954.
Structured detection combines four layers: daily visual inspection, automated sensor alerting, periodic pressure testing, and consumption anomaly detection from sub-meter data. Each layer catches a different failure mode. Visual inspection catches visible drips but misses concealed and silent leaks. Sensors catch active flow events instantly. Consumption anomaly detection is the only layer that catches slow, continuous waste invisible to all other methods.
03 — Plumbing PM Checklist: Monthly, Quarterly, and Annual Tasks
A compliant plumbing preventive maintenance programme spans three cadences. Monthly tasks are rapid visual inspections that catch active issues before they become damage events. Quarterly tasks cover mechanical systems, water heating, and distribution components that degrade over weeks. Annual tasks are comprehensive audits covering the full plumbing system, backflow preventer testing (required in most jurisdictions), and fixture efficiency reviews.
Turn Your Plumbing PM Schedule into a Live Water Conservation Record
OxMaint assigns monthly, quarterly, and annual plumbing PM tasks per building with timestamped digital completion, photo evidence, and automated escalation when tasks are overdue — building the audit trail that ESG and LEED reporting requires.
04 — Smart Sensors: What to Deploy and Where
IoT water sensors have reached price points where deployment across an entire commercial building is economically justified by leak prevention value alone. The ROI calculation is direct: a single concealed pipe leak caught within 24 hours versus discovered after three weeks of damage represents a cost difference of $15,000–$40,000 in restoration. A floor-drain moisture sensor installed for $150 has a payback period measured in the first leak it catches.
The deployment priority follows consequence severity, not convenience. The highest value locations are those where a leak causes the most damage before discovery: server rooms, electrical rooms, occupied ceilings above tenant spaces, and mechanical rooms. Secondary priority goes to high-consumption monitoring points where sub-metered data enables conservation analysis: irrigation supply, cooling tower make-up, and domestic hot water recirculation.
05 — ESG and LEED: Water as a Reportable Asset
Water consumption has moved from an operational cost line to a disclosed sustainability metric. GRI 303 (Water and Effluents) requires organisations to report total water withdrawal by source, water recycled and reused, and an intensity metric (litres per sqft or per unit of output). LEED v4.1 Water Efficiency credits require buildings to demonstrate percentage reductions against a documented baseline through sub-meter evidence. ISO 14001 requires water to be identified as a significant environmental aspect with operational controls and measurable annual targets.
The practical gap for most facility managers is that ESG reporting asks for data their systems cannot produce: sub-metered by system type, compared against a documented baseline, with corrective action evidence for anomalies. OxMaint connects plumbing PM records, sub-meter readings, sensor alert history, and work order outcomes into a water management record that feeds ESG reports directly rather than requiring a separate data collection exercise at year-end.
06 — Cost Model: What Water Conservation Is Actually Worth
Water conservation ROI comes from three distinct value streams: direct water cost savings, avoided water damage restoration costs, and deferred capital expenditure from extended fixture and system life. Most facility managers focus only on the first, which significantly understates the financial case. The avoided damage cost from catching a single concealed pipe leak before structural damage occurs typically exceeds the entire annual budget for the sensor and PM programme that caught it.
How do I know if my facility has undetected leaks without installing sensors?
The night-flow test requires no sensor investment. At 02:00–04:00 when occupancy is confirmed to be zero, record your main meter reading at 30-minute intervals. Any measurable consumption above 0.1 GPM indicates an active leak. The toilet dye test (food colouring in the tank, wait 10 minutes, check bowl) is a zero-cost method for detecting the most common and wasteful fixture leak. For multi-floor buildings, isolation valve testing narrows the source to a specific riser zone. OxMaint's monthly PM template includes both tests as standard checklist items — start your free trial to deploy the plumbing PM template across your portfolio.
What are the most cost-effective fixture upgrades for water conservation?
Toilet flappers and fill valves are the highest-ROI single fixes — a failed flapper costs under $10 in parts and ends 3,000–6,000 gallons per month of waste immediately. WaterSense-labelled toilet replacements (1.28 GPF from legacy 3.5–5.0 GPF fixtures) deliver the largest volumetric reduction per fixture — nearly 13,000 gallons per year saved per toilet, worth approximately $140 in water and sewer costs annually (EPA). Faucet aerators (1.5 GPM from 2.2 GPM legacy) are low-cost retrofits with a payback period under 12 months in high-traffic commercial restrooms. A structured fixture audit capturing current GPM against WaterSense targets, combined with occupancy data, produces a prioritised replacement list with calculated payback for each fixture class.
How does water consumption data integrate with ESG and LEED reporting?
GRI 303 requires water withdrawal by source and intensity metrics. LEED v4.1 WE credits require sub-meter evidence of percentage reductions versus a documented baseline. Both require the same underlying data: monthly consumption by system type, a baseline for comparison, and corrective action records for anomalies. OxMaint maintains this record automatically from PM task completions, sub-meter readings, and work order history — making year-end ESG reporting a data export rather than a manual reconstruction. The setup step is configuring sub-meters per system category and entering the baseline figures from the initial water audit. Book a demo to see how OxMaint structures water data for GRI and LEED documentation.
Is backflow preventer testing legally required and how often?
Yes. In most US jurisdictions backflow preventer testing is a legal requirement under local cross-connection control programmes, typically administered by the water utility. The standard frequency is annual testing by a state-certified tester for all devices protecting against health hazards. Failed devices must be repaired and retested before return to service. Non-compliance can result in water service disconnection or fines. This is one of the most commonly missed compliance items in multi-tenant commercial buildings where maintenance responsibility is unclear between landlord and tenant plumbing systems. Records must be submitted to the utility within a specified window after the test date.
Can OxMaint track water consumption data alongside maintenance records?
Yes. OxMaint allows manual meter readings to be entered as part of scheduled PM task completions, and supports integration with pulse-output sub-meters and IoT sensor platforms via REST API. Consumption readings are stored against the asset record and trended over time, with configurable alerts when readings exceed baseline thresholds. When an anomaly triggers an alert, OxMaint auto-generates a work order for investigation and links it to the consumption record — so the full chain of detection, investigation, repair, and resolution is documented in one place for ESG and LEED audit purposes.