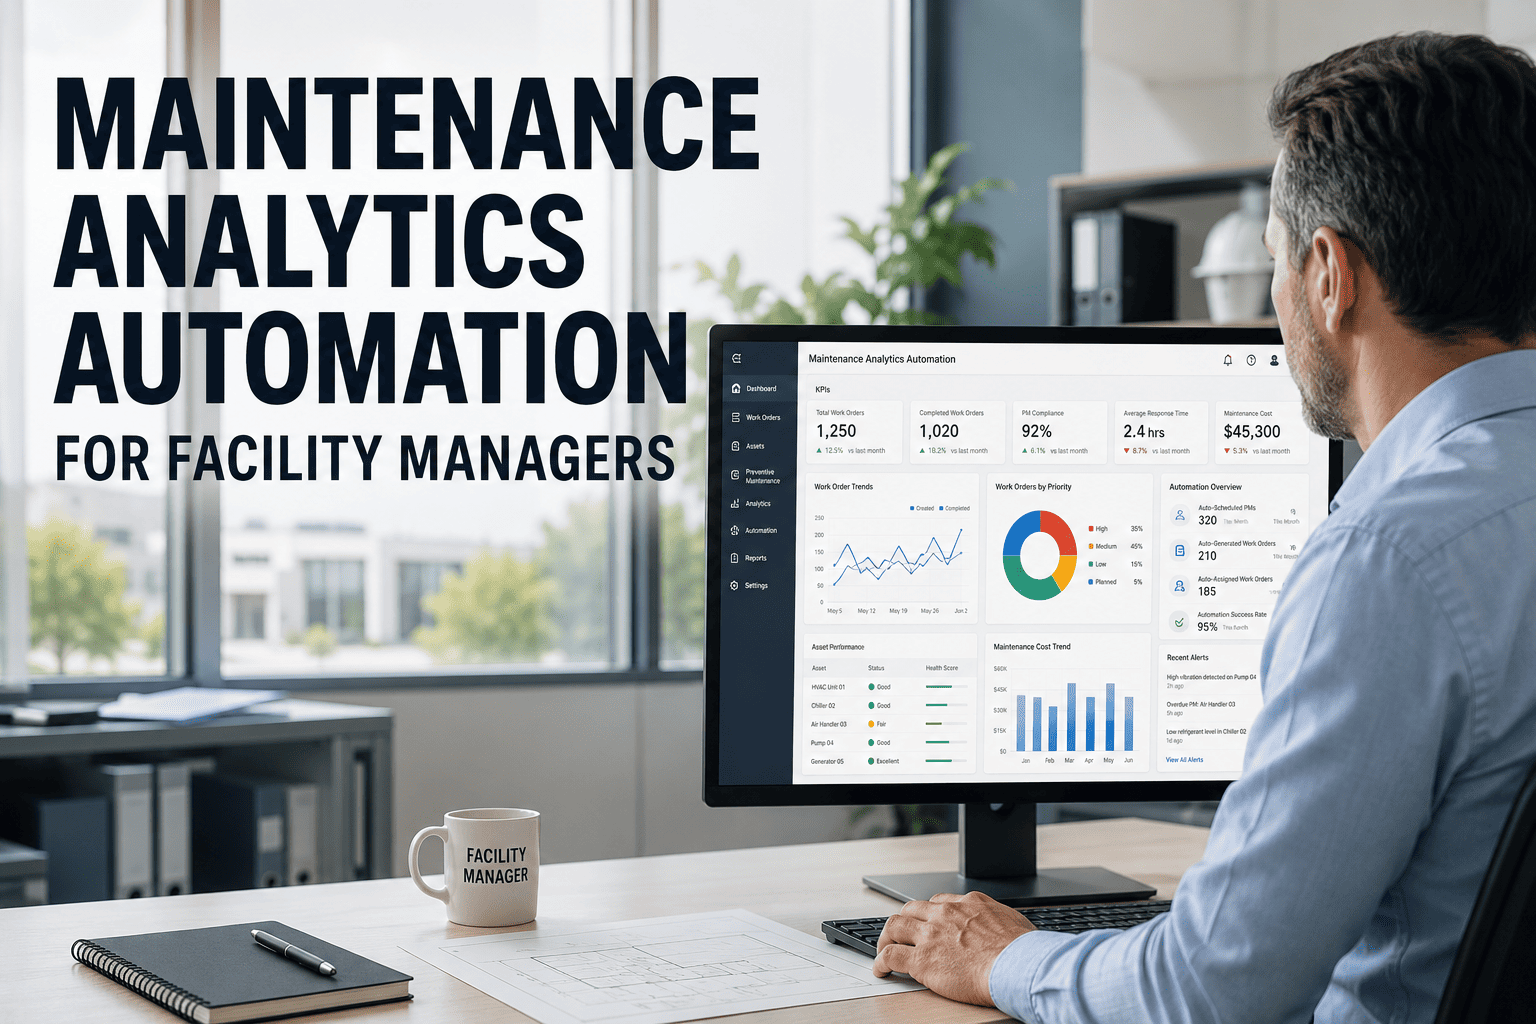
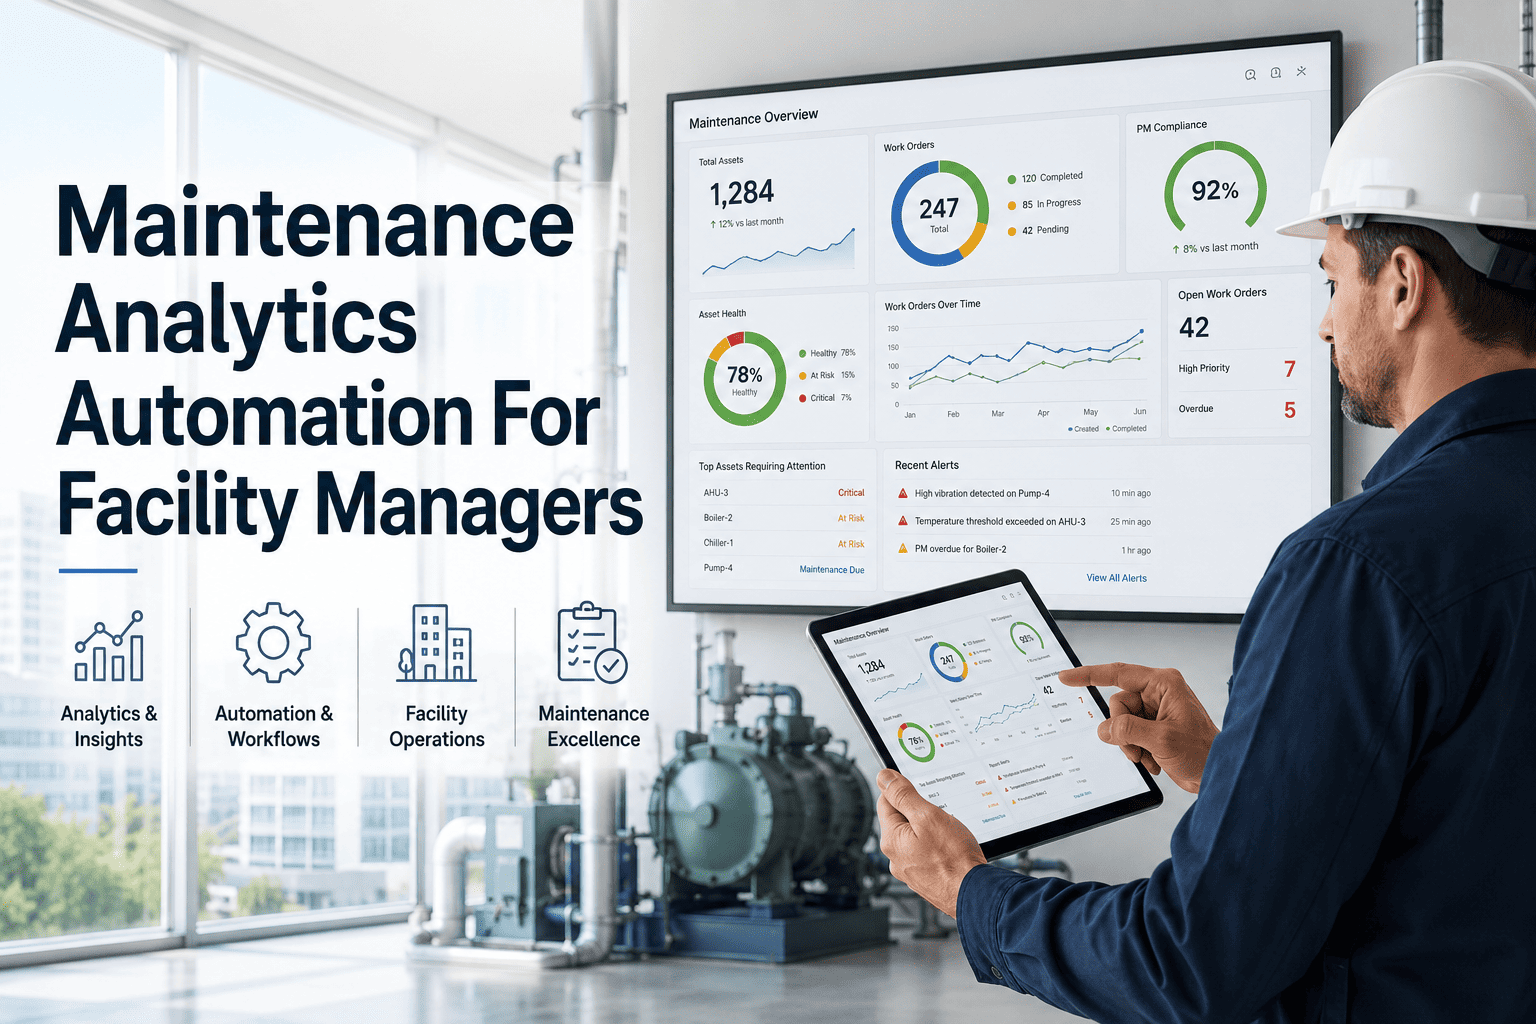
Maintenance Analytics Automation For Facility Managers

By Lewis Abbott on June 26, 2026

maintenance-analytics-automation-for-facility-managers

Most facility teams already have plenty of data — work order logs, inspection checklists, PM histories — and almost no time to turn it into a decision before the next walkthrough or board meeting. Maintenance analytics automation pulls all of that into one continuously updated view, so a manager sees work orders, inspections, asset reliability, and compliance status without exporting five reports into one spreadsheet first. This page shows how that automation runs inside OxMaint, or book a demo to see it pull from your own data.

Dashboards & Analytics / Facility CMMS

Maintenance Analytics Automation for Facility Managers

See work orders, inspections, asset reliability, and compliance status in one continuously updated view — no manual report building.

5 → 1
Separate reports consolidated into one view
Live
Compliance status updates as records close
0
Spreadsheets needed to compile the numbers

From five exports to one dashboard

Building a leadership report by hand usually means pulling work order logs, inspection sheets, and asset histories into one document — and the numbers are already a week old by the time anyone reads it.

What matters Manual reporting Automated analytics
Data sources Pulled from separate exports Pulled from live system records
Update frequency Weekly or monthly Continuous
Time to compile Hours per report None — already compiled
Risk of stale numbers High by the time it's read Low — reflects the latest record

What's tracked automatically

Four numbers cover most of what a leadership review or audit actually asks for — each one calculated continuously instead of pulled together once a month.

88%
PM Compliance
95%
Inspection Completion
81%
Asset Reliability Score
90%
Work Order SLA

See your own numbers in one view

Bring your current work order, inspection, and asset data and we'll show you what the dashboard would surface on day one.

Where the saved time actually goes

Weekly leadership reporting
Walk into the review with current numbers instead of spending the morning building slides.
Budget & capital planning
Back a capital request with asset reliability and cost trends instead of a one-time estimate.
Compliance audits
Pull a complete, timestamped record of inspections and PM history instead of reconstructing it.
Performance reviews
Compare vendor and technician completion rates without compiling separate spreadsheets per person.

Compliance over the last six months

The same automation that powers a live dashboard also keeps a running trend, so a manager can see whether compliance is actually improving, not just where it sits today.


Jan

Feb

Mar

Apr

May

Jun
Expert Review

"The teams that get the most out of analytics aren't the ones with the fanciest dashboard — they're the ones who stopped treating reporting as a once-a-month event. When compliance and reliability numbers update continuously, a manager catches a slipping trend in week three instead of finding out at month-end that the quarter already went sideways. The automation itself isn't the win; the win is having the conversation two weeks earlier than you used to."

Reviewed by a Facility Maintenance Manager, building reporting and KPI programs across commercial portfolios for 13+ years.

Stop building reports the numbers already exist for

Walk through live compliance, reliability, and SLA metrics pulled directly from your own OxMaint workspace.

Frequently asked questions

What is maintenance analytics automation?
It's a continuously updated view that pulls work order, inspection, and asset data directly from the CMMS into compliance and reliability metrics, instead of someone exporting and combining reports by hand each month. See it built from your own data in OxMaint.
How current are the numbers on the dashboard?
Metrics reflect work orders and inspections as they're closed, so PM compliance and SLA performance shown today already include this morning's activity rather than last week's export. Book a demo to see it update live.
Can the analytics be filtered by building, asset type, or technician?
Yes. The same underlying metrics can be sliced by site, asset category, or assigned technician, which makes it possible to spot a specific source of slipping compliance instead of just a portfolio-wide number. Explore filtering in OxMaint.
Does it replace audit documentation?
It pulls together the timestamped inspection and PM records an audit typically asks for, which significantly cuts prep time, though most auditors will still want the underlying records available alongside the summary view. See audit reporting in a demo.
Can I track trends over time, not just current status?
Yes. Compliance, reliability, and SLA metrics are tracked historically, so a manager can see whether a number is actually improving or just looks fine in isolation. Try trend views in OxMaint.
How long does it take to start seeing useful analytics?
Since the metrics are calculated from work orders and inspections already happening in the system, most teams see a useful view within days of connecting their data, with trend lines building out over the following weeks. Start with a free trial.

Turn facility data into a decision, not a report

See work orders, inspections, reliability, and compliance in one place — updated continuously, not once a month.
Share This Story, Choose Your Platform!