Property maintenance expenses quietly consume 15 to 35 percent of total operating budgets across commercial and industrial facilities in the US and UAE. Most facility teams still run on spreadsheets, phone calls, and paper work orders. That is not just an operational problem, it is a financial one. Unplanned downtime costs US facilities an average of $260,000 per hour. Fortune 500 companies lose $1.4 trillion annually to unplanned equipment failures.Facilities deploying modern CMMS and AI analytics in 2026 are documenting 30 to 45 percent lower total maintenance costs, 89 percent PM compliance rates, and CFO-ready CapEx forecasts within the first year. This guide covers exactly where the savings come from, what they cost to implement, how OxMaint delivers every capability, and how US and UAE facility teams are using automation to cut costs without cutting corners. Sign up free or book a demo to see OxMaint's cost reduction framework configured for your facility.
Facility Management
Reduce Facility Maintenance Costs by 30% with CMMS Automation
9-11 min read
30-45%
Total maintenance cost reduction documented by facilities deploying CMMS and AI in 2026
$260K
Average cost per hour of unplanned downtime across US commercial and industrial facilities
80%
Of facilities still operating with reactive maintenance cultures as of 2024 Plant Engineering report
40%
Reduction in maintenance backlog achievable in year one with automated work order management
OxMaint Delivers 30% Maintenance Cost Reduction from Day One. No Implementation Consultants. No Credit Card Required.
Automated work orders. AI preventive maintenance scheduling. Spare parts inventory optimization. Real-time asset condition scoring. CapEx forecasting. All in one platform designed for US and UAE facility teams managing real budgets under real compliance pressure.
Where Facility Maintenance Costs Actually Come From
Most facility managers know their total maintenance budget. Few know the breakdown. The six cost drivers below account for over 90 percent of controllable maintenance spend across US and UAE commercial facilities. Each one is directly addressed by structured CMMS automation.
38%
Emergency and Reactive Repairs
Emergency repairs cost 4.8x more than planned work for the same task. Emergency contractor call-out rates, after-hours premiums, and expedited parts sourcing inflate what should be a $400 planned repair into a $1,900 emergency event. Every reactive repair that could have been prevented as a scheduled PM is direct budget waste.
Average EM vs PM cost ratio: 4.8x
24%
Labor Inefficiency and Time Waste
Technicians in reactive facilities spend 40 to 50 percent of working hours on non-productive activities: hunting for asset information, waiting for parts, travelling between sites for work that could be batched, and completing manual paperwork. CMMS work order automation eliminates each of these time sinks, recovering 15 to 25 percent of labor productivity.
McKinsey 2025: 15% labor cost reduction via CMMS
18%
MRO Parts Overspending and Stockouts
Facilities without CMMS inventory tracking simultaneously overstock slow-moving parts and stock out on fast-moving consumables. Stockouts cause repair delays and emergency sourcing premiums. Overstocking ties up capital in obsolete inventory. CMMS min-max automation eliminates both conditions, reducing MRO spending by 15 percent on average per McKinsey 2025 data.
MRO cost reduction with CMMS: 15% average
10%
Premature Asset Replacement
Assets replaced on fixed calendar intervals rather than actual condition data are retired at 60 to 75 percent of their serviceable life. A structured PM program with condition scoring extends average asset service life by 20 percent, directly reducing the CapEx requirement. Without CMMS condition tracking, replacement decisions are driven by failure or guesswork, never by evidence.
CMMS extends asset life by 20%: Deloitte 2024
6%
Contractor Overspending
Without CMMS vendor performance tracking, facilities have no mechanism to route work orders to preferred vendors, measure contractor completion quality, or enforce competitive quote requirements above defined thresholds. Facilities implementing CMMS vendor performance tracking reduce contractor costs by 12 to 20 percent within 18 months.
Contractor savings with CMMS vendor tracking: 12-20%
4%
Compliance Penalties and Audit Costs
Lapsed statutory inspections, missing audit documentation, and non-compliant maintenance records generate enforcement notices, remediation costs, and legal liability. In the US, OSHA and state building code penalties range from $15,000 to $156,259 per violation. In the UAE, non-compliance with DEWA and Civil Defence requirements triggers operating licence suspension. CMMS automation eliminates all lapse risk.
OSHA penalties per violation: up to $156,259 in 2026
The 6 CMMS Automation Capabilities That Cut Costs by 30%
CMMS cost reduction does not come from a single feature. It comes from six automation capabilities working together to eliminate the waste that drives each cost category above. OxMaint delivers all six in one platform.
01
Automated Work Order Management
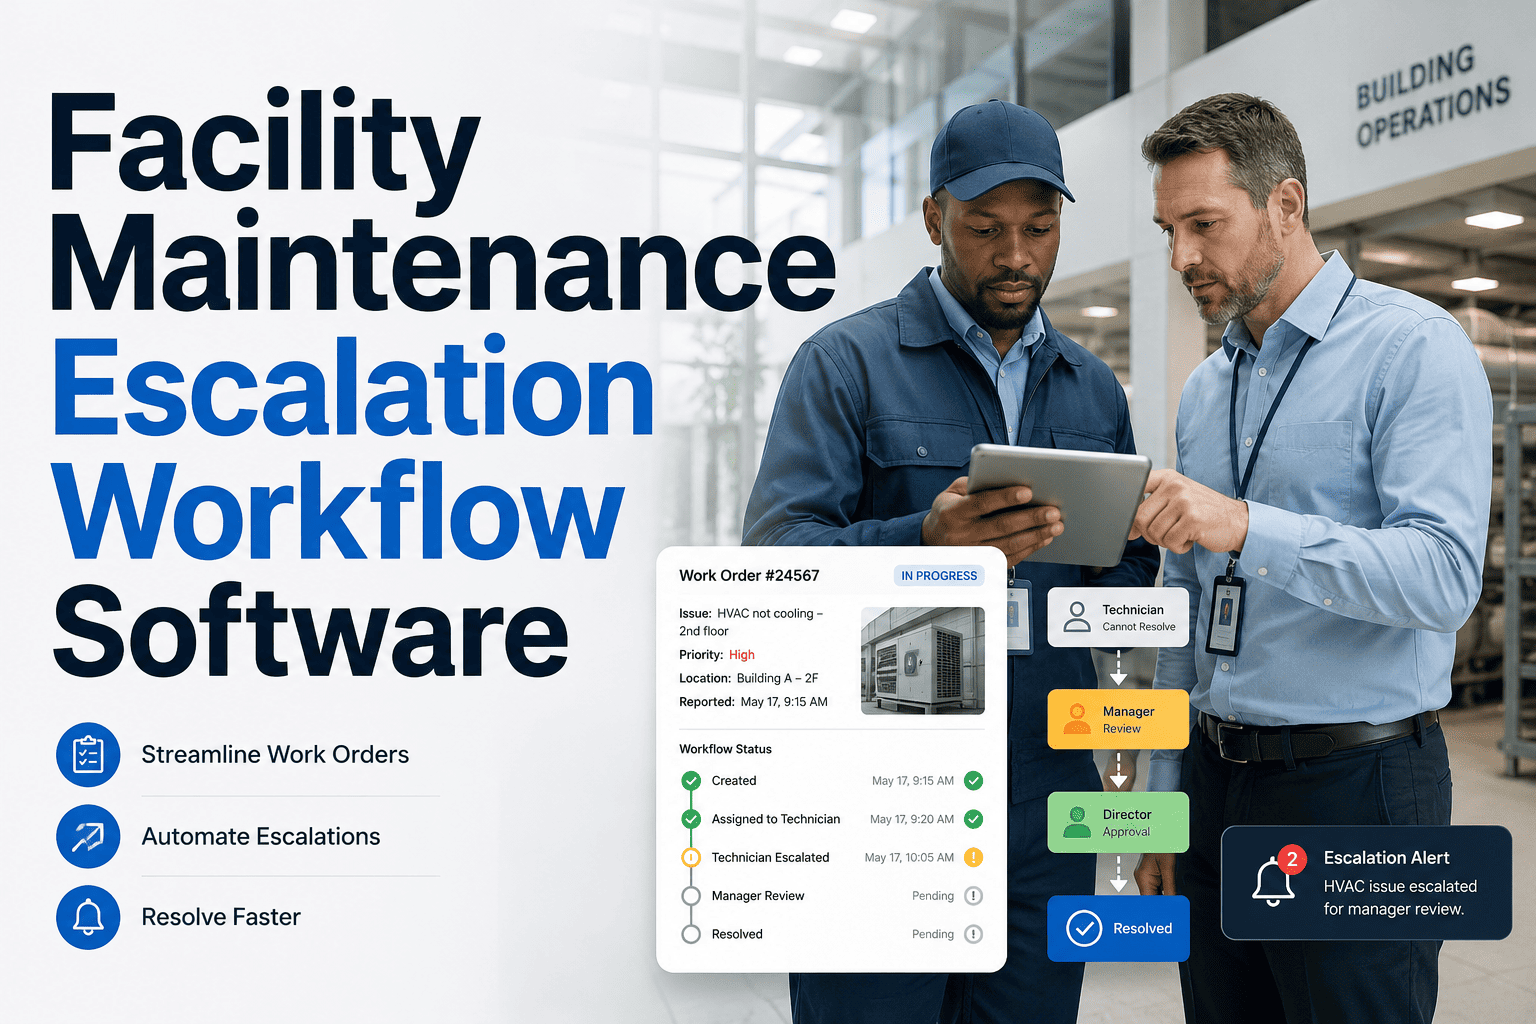
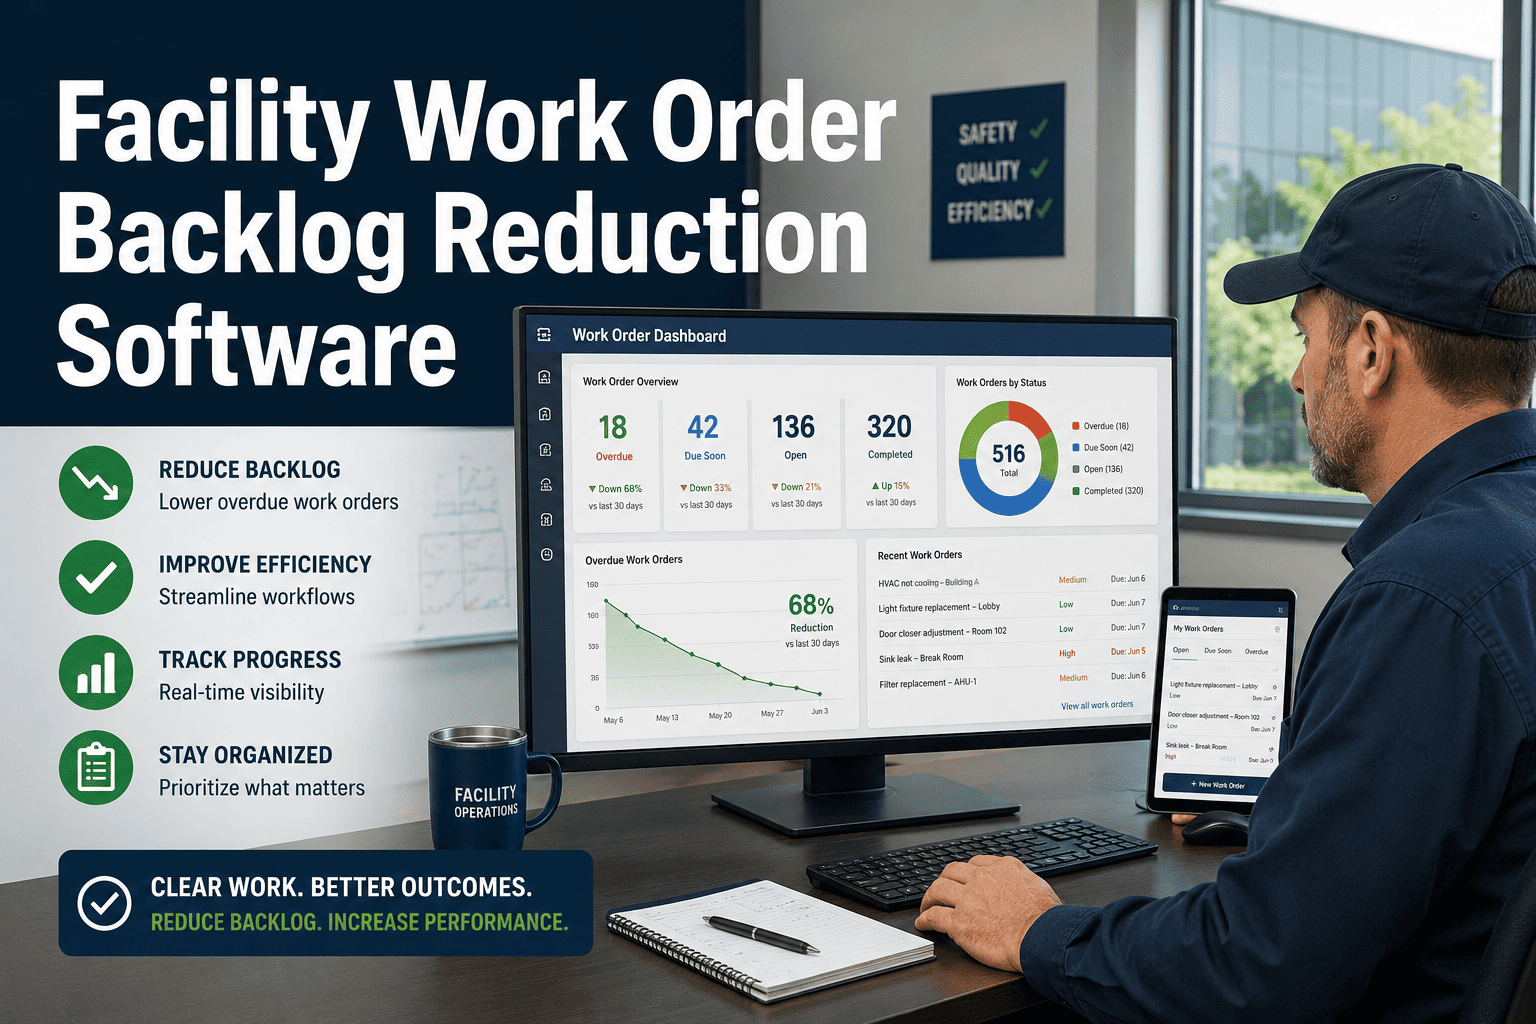
Every maintenance request, inspection, and PM task flows through a single automated work order system. Technicians receive assignments on mobile, log time and parts in real time, and close work orders with photo documentation. Supervisors see live status across every open job. Labor hours tracked to individual assets reveal which equipment consumes disproportionate technician time, driving evidence-based CapEx decisions. Work order automation reduces maintenance backlog by over 40 percent in year one.
Backlog reduction: 40%+ in year one
02
AI Predictive Maintenance Scheduling
OxMaint shifts maintenance from calendar-based scheduling to condition-triggered intervention. When vibration spikes, temperature drifts, or runtime hits a threshold, the system generates a work order automatically. No supervisor intervention required between sensor alert and maintenance response. Predictive maintenance early adopters report 75 percent reduction in unplanned downtime. Deloitte 2024 data documents 18 to 25 percent reduction in unplanned maintenance spend within 12 months of full adoption.
Unplanned downtime reduction: 75% for early AI adopters
03
Spare Parts and MRO Inventory Automation
OxMaint links every work order to parts consumption records, automatically triggers reorder alerts at minimum stock thresholds, and generates bulk purchasing data from actual consumption patterns rather than estimates. Parts reserved against upcoming PMs prevent stockouts during planned maintenance windows. The result is a 15 percent reduction in MRO spending and the elimination of emergency parts sourcing premiums that inflate reactive repair costs by an additional 30 to 50 percent per event.
MRO cost reduction: 15% average (McKinsey 2025)
04
Asset Condition Scoring and Lifecycle Tracking
Every asset in OxMaint carries a condition score updated with each maintenance event, inspection, and sensor reading. The condition score drives replacement forecasting, PM interval adjustment, and CapEx prioritization. Assets approaching end-of-life are flagged 12 to 18 months before failure probability crosses the replacement threshold, enabling planned procurement at standard pricing rather than emergency replacement at 28 to 45 percent premium. Asset life extends by 20 percent on average.
Asset lifespan extension: 20% with condition-based management
05
Rolling CapEx Forecasting from Live Condition Data
OxMaint generates rolling 5 to 10 year CapEx forecasts per asset, per building, and per portfolio from live condition scores and maintenance cost trajectories. Finance receives CFO-defensible capital budget documentation with Remaining Useful Life data per asset, replacing annual guesswork with data-driven replacement timing. Emergency CapEx requests drop by 38 percent when replacement decisions are driven by condition data rather than failure events or fixed depreciation schedules.
Emergency CapEx reduction: 38% with condition-based forecasting
06
Compliance Documentation Automation
Every completed maintenance task on a compliance-relevant asset generates a timestamped, technician-attributed record automatically. OSHA inspection logs, DEWA compliance records, Civil Defence safety documentation, and building code inspection evidence all generated from the same work order system. Audit preparation time drops from 2 to 4 weeks to under 5 minutes. Compliance penalty exposure is eliminated. Insurance premiums improve when auditable PM programs are demonstrated to underwriters.
Audit prep time: reduced from 2-4 weeks to under 5 minutes
OxMaint vs Competitors: Feature and Cost Comparison
Not all CMMS platforms deliver the same cost reduction capabilities. The comparison below covers the features that matter most for US and UAE facility teams focused on measurable maintenance cost reduction, not just work order tracking.
Region-by-Region Cost Reduction Benchmarks
Maintenance cost reduction potential and the compliance frameworks driving CMMS adoption vary significantly by region. The table below maps the key cost drivers, regulatory requirements, and OxMaint capabilities for each major market.
Region
Primary Cost Drivers
Key Regulations
Avg Maintenance Cost/Sq Ft
OxMaint Savings Target
USA
Aging infrastructure (avg 24yr asset age), labor shortages, 80% reactive culture, OSHA compliance costs
OSHA 1910, ADA compliance, state building codes, ASHRAE energy standards, Joint Commission (healthcare)
$3.00-$4.50/sq ft annually for reactive operations
30-40% reduction, $0.90-$1.80/sq ft savings
UAE
Vision 2030 digital compliance mandate, IS2030 requirements, extreme heat HVAC overload, paper register enforcement risk
DEWA regulations, Civil Defence inspection codes, UAE IS2030, Trakhees standards, SIRA security compliance
AED 18-34/sq ft annually, premium for non-compliant buildings
35-45% reduction, full IS2030 digital compliance from day one
UK
Building Safety Act 2022 compliance burden, NHS facility requirements, high contractor labor rates
Building Safety Act, PSSR, PUWER, HSE inspection standards, NHS SHTM standards, NFPA equivalents
GBP 2.80-4.20/sq ft annually
25-35% reduction, audit-ready BSA compliance documentation
Canada
High labor costs, aging commercial real estate portfolio, provincial building code compliance, ESG reporting pressure
Provincial building codes, OHS Act requirements, ASHRAE 189.1, BOMA BESt certification
CAD 3.50-5.00/sq ft annually
25-35% reduction, BOMA BESt and ESG documentation automated
Europe
EU EED energy reporting requirements, strict industrial safety regulations, decarbonization compliance costs
EU Energy Efficiency Directive, BetrSichV (Germany), DGUV regulations, ISO 45001, REACH compliance
EUR 25-42/sq ft annually for industrial facilities
28-38% reduction, EU EED PUE and WUE reporting automated
OxMaint Delivers Documented Cost Reduction Across Every Region.
US OSHA compliance, UAE IS2030 digital documentation, UK Building Safety Act audit trails, EU EED energy reporting. All generated automatically from live work order data. Free to start. No implementation project required. Measurable ROI within 90 days.
Reactive vs CMMS-Automated: The Full Cost Comparison
The table below uses real cost data from facilities transitioning from reactive operations to OxMaint-automated programs. The financial gap between these two operating modes is the business case for every facility manager facing budget pressure in 2026.
30-45%
Total maintenance cost reduction documented by facility teams deploying OxMaint CMMS with AI within 12 months
89%
PM compliance rate achieved by OxMaint facility teams in 2026 versus 58% industry average for reactive programs
90 days
Typical time to first measurable ROI after OxMaint deployment for US and UAE commercial facility teams
4.8x
Cost multiplier for emergency vs planned repairs, the single largest preventable waste in facility maintenance budgets
Start Cutting Facility Maintenance Costs with OxMaint Today. Free Account. No Time Limit.
Automated work orders. AI preventive maintenance scheduling. MRO inventory automation. CapEx forecasting from condition data. OSHA and IS2030 compliance documentation. Portfolio-level reporting for US and UAE operations. All in one platform. Free to start with no credit card required.
Frequently Asked Questions
QHow quickly can a US or UAE facility start seeing cost reductions after OxMaint deployment?
Facilities typically see measurable cost reduction within 60 to 90 days. Tier 1 no-cost savings from BAS scheduling corrections and work order automation appear within the first 30 days. Emergency repair rate reduction follows at 60 to 90 days as PM compliance builds.
Sign up free to start your baseline, or
book a demo for a custom ROI model using your current maintenance spend.
QDoes OxMaint generate OSHA compliance documentation automatically for US facilities?
Yes. Every completed maintenance task on an OSHA-relevant asset generates a timestamped, technician-attributed compliance record. Inspection logs, safety check records, and equipment maintenance documentation export audit-ready in under 5 minutes.
Book a demo to see the OSHA compliance module, or
sign up free today.
QCan OxMaint handle UAE IS2030 digital maintenance documentation requirements for facilities in Dubai and Abu Dhabi?
Yes. OxMaint generates IS2030-ready digital PM records, DEWA compliance documentation, and Civil Defence inspection logs automatically with every work order completion. Arabic-language interface is available for UAE site teams.
Sign up free or
book a demo to see the UAE compliance configuration.
QHow does OxMaint's MRO inventory automation reduce spare parts costs without creating new stockouts?
OxMaint links every work order to parts consumption records, auto-triggers reorder alerts at configurable minimum stock thresholds, and reserves parts against upcoming planned PMs before work begins. Emergency sourcing premiums are eliminated and overstock is prevented simultaneously.
Book a demo or
sign up free to configure inventory automation for your facility.
Every Dollar of Maintenance Budget Waste Is Recoverable. OxMaint Shows You Exactly Where to Start.
Work order automation. AI-triggered preventive maintenance. MRO inventory optimization. CapEx forecasting from live condition data. OSHA, IS2030, EU EED compliance documentation. All operational from day one. Start free, no credit card required, your first cost reduction appears within 30 days of account activation.