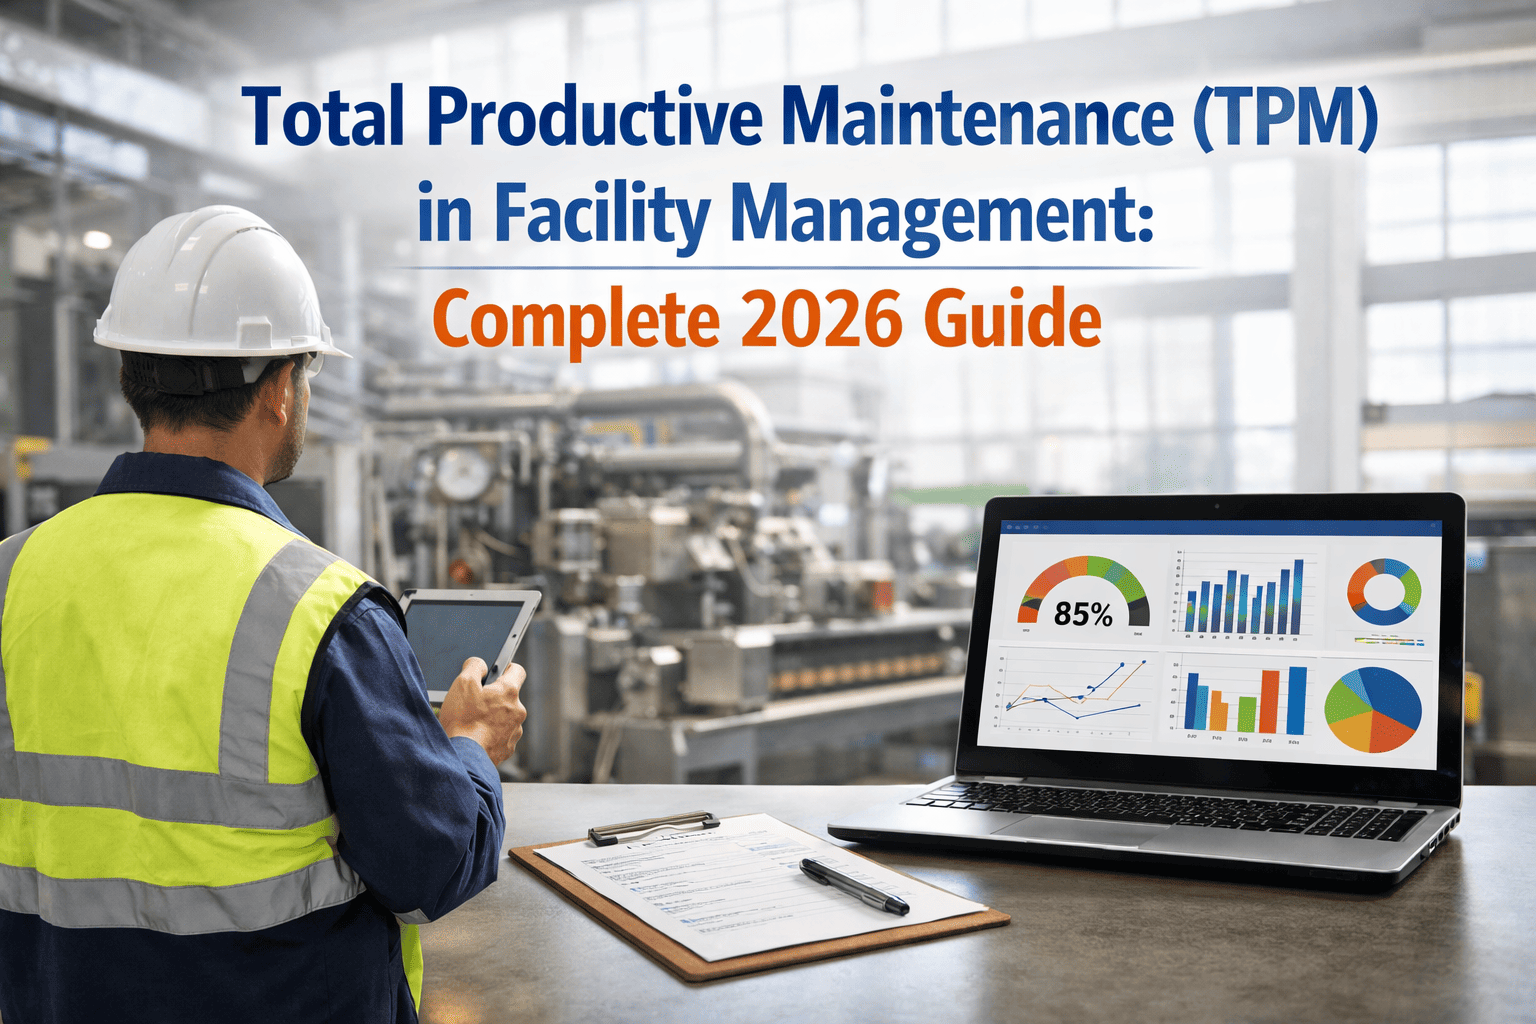
Most facilities run at 40–60% OEE — meaning nearly half of every scheduled production hour is lost to breakdowns, slow performance, or quality defects. World-class TPM implementations consistently reach 85–95% OEE. That gap is not a technology problem — it is a maintenance strategy problem. Total Productive Maintenance, pioneered at Toyota's supplier Nippondenso in the 1970s and refined across global industry over 50 years, treats equipment reliability as a shared competitive advantage that every operator, technician, and manager owns simultaneously. Facilities that implement TPM with a CMMS backend see PM completion rates climb from below 50% to above 79% within the first year. This guide covers the complete 2026 TPM framework — 8 pillars, OEE measurement, implementation roadmap, and how AI-powered CMMS turns TPM from a wall poster into a working system. Book a demo to see how Oxmaint powers TPM across your facility.
Maintenance Strategy
Analytics & Reporting
2026 Guide
Where Does Your Facility Currently Stand?
OEE = Availability × Performance × Quality — the single metric that quantifies TPM progress
What TPM Actually Is
The Mental Model Shift: From "I Operate, You Fix" to Shared Ownership
Reactive Model
Operator runs equipment until it breaks
Maintenance firefights breakdown
Emergency parts, overtime, missed output
Failure costs never appear on one P&L line
OEE: 40–60% — hidden capacity wasted daily
→
TPM Model
Operators own daily cleaning, lubrication, inspection
Technicians focus on planned and predictive work
Failures prevented before they reach production
Every OEE loss tracked, categorized, and eliminated
OEE: 85%+ — hidden capacity recovered systematically
The 8 Pillars
TPM's Eight Pillars — What Each One Does and Why None Can Be Skipped
01
Autonomous Maintenance
Operators perform daily cleaning, lubrication, inspection, and abnormality detection. Frees technicians for complex planned work. Builds operator pride and equipment ownership.
CMMS tool: Digital AM checklists with mobile sign-off
02
Planned Maintenance
Shift from reactive breakdown repair to condition-based and scheduled maintenance driven by equipment history and failure pattern data from CMMS.
CMMS tool: PM scheduling, condition-based triggers
03
Focused Improvement
Cross-functional teams use PDCA, root cause analysis, and why-why analysis to systematically eliminate the Six Big Losses identified in OEE data.
CMMS tool: OEE dashboards, loss categorization
04
Quality Maintenance
Link equipment conditions directly to defect generation. Identify the maintenance-preventable root causes of quality failures, not just the defect symptoms.
CMMS tool: Quality flag linkage to work orders
05
Early Equipment Management
Apply maintenance knowledge to new equipment design. Use failure history to specify equipment that is easier to maintain, inspect, and lubricate from day one.
CMMS tool: Asset commissioning records, MTBF baselines
06
Training & Education
Develop multi-skilled operators and technicians. Map skill gaps against equipment requirements. Track training completion rates and competency assessments in CMMS.
CMMS tool: Technician competency tracking
07
Safety, Health & Environment
Eliminate accident and incident risks from equipment condition and maintenance practices. Zero accidents is as achievable as zero breakdowns — both require the same systematic discipline.
CMMS tool: Safety inspection tracking, compliance records
08
Administrative TPM
Extend TPM principles beyond the production floor to support functions — procurement, planning, and logistics. Administrative waste that delays parts availability is a hidden OEE loss.
CMMS tool: Parts inventory, purchasing integration
Oxmaint Puts All 8 TPM Pillars in One Platform
Digital AM checklists, planned maintenance scheduling, OEE dashboards, work order analytics, and competency tracking — built for facilities teams implementing TPM with real data, not clipboards.
OEE Breakdown
The Six Big Losses — Where OEE Is Actually Being Destroyed
Implementation Roadmap
4-Phase TPM Implementation with CMMS Support
Phase 1
Foundation — 5S + Baseline OEE
Weeks 1–8
Deploy 5S across pilot area. Measure baseline OEE for all candidate equipment. Identify Six Big Losses driving largest OEE gap. Select pilot area: small, visible, self-contained cell where success is achievable and visible.
Phase 2
Pilot — Autonomous + Planned Maintenance
Weeks 8–24
Launch AM checklists for pilot equipment operators. Build planned maintenance schedules in CMMS based on OEE-identified failure modes. Run focused improvement kaizens on top two OEE losses.
Phase 3
Expansion — All 8 Pillars + Rollout
Months 6–18
Activate remaining TPM pillars. Roll out to additional equipment based on pilot OEE improvement evidence. Train maintenance team and operators. Connect CMMS OEE data to management reporting.
Phase 4
Maturity — Continuous Improvement
Month 18+
OEE trending above 79% on pilot assets. PM completion rate >79%. Zero breakdown targets for critical equipment. AI predictive maintenance integrated with condition monitoring for top-tier reliability.
Expert Review
What Facility Maintenance Leaders Say About TPM
"The most common reason TPM implementations fail — and over half do fail — is that organizations treat it as a maintenance department initiative. TPM is a production system. The moment maintenance managers stop briefing operations managers on OEE data and the moment operators stop owning their AM checklists, TPM becomes a documentation exercise. The CMMS is the accountability layer — it shows you exactly who completed what, and exactly where the OEE losses are accumulating."
Director of Maintenance Excellence
Multi-Site Manufacturing Facility — 8 Plants, Asia Pacific
"We went from 54% OEE to 71.9% in eight months on our pilot line. The gain didn't come from buying new equipment — it came from autonomous maintenance checklists that operators actually completed, and from using our CMMS work order data to find the three failure modes that accounted for 60% of our breakdown hours. TPM is a structured way to use the data you already have to stop the failures you've been living with for years."
Plant Maintenance Manager
Pharmaceutical Manufacturing — ISO Class 7 Facility
Frequently Asked Questions
TPM in Facility Management — Common Questions
How long does it take to see measurable OEE improvement from TPM implementation?
Pilot line OEE improvements are typically visible within 8–16 weeks of launching autonomous maintenance checklists and focused improvement activities on the top two loss categories. A meaningful OEE gain of 10–15 percentage points on the pilot equipment is achievable within 6 months. Plant-wide TPM maturity — reaching 85%+ OEE consistently — takes 18–36 months and requires all 8 pillars active with CMMS support.
Start a free trial to establish your baseline OEE and begin tracking TPM progress in Oxmaint.
What is the difference between TPM and preventive maintenance?
Preventive maintenance is one component of TPM's second pillar (Planned Maintenance). TPM is a complete production system that integrates autonomous maintenance by operators, focused improvement kaizens, quality maintenance linkage, and safety excellence — not just scheduled maintenance tasks. A facility with a strong PM program is running one pillar of TPM. A facility with full TPM runs all eight simultaneously, with OEE as the shared measurement framework.
Book a demo to see how Oxmaint supports all 8 pillars from a single platform.
Does TPM work for non-manufacturing facility types like hospitals, campuses, or commercial buildings?
Yes — the principles apply directly to any facility where equipment availability and performance affect operations. Hospitals use TPM frameworks for critical HVAC, medical equipment, and power systems. Campuses apply it to HVAC, elevators, and lab equipment. Commercial buildings use TPM to manage chiller availability, BMS performance, and lighting system uptime. The OEE metric adapts to any availability-performance-quality framework relevant to the facility type.
Start a free trial to adapt the TPM framework to your facility type in Oxmaint.
How does a CMMS support TPM implementation compared to spreadsheets?
Spreadsheets track tasks. A CMMS tracks outcomes. Oxmaint shows PM completion rates by asset and by technician, calculates OEE trends from work order data, generates automatic alerts when AM checklists are overdue, and links every breakdown work order to a loss category for focused improvement analysis. TPM without a CMMS is a cultural initiative. TPM with a CMMS is a measurable performance system.
Book a demo to walk through the OEE dashboard and TPM reporting in Oxmaint.
Your Facility Has the Capacity. TPM Recovers It.
Plants without TPM run at 40–60% OEE. That hidden capacity already exists inside your equipment. Oxmaint gives your team the digital tools to implement all 8 TPM pillars — AM checklists, OEE dashboards, PM scheduling, and work order analytics — in one platform.