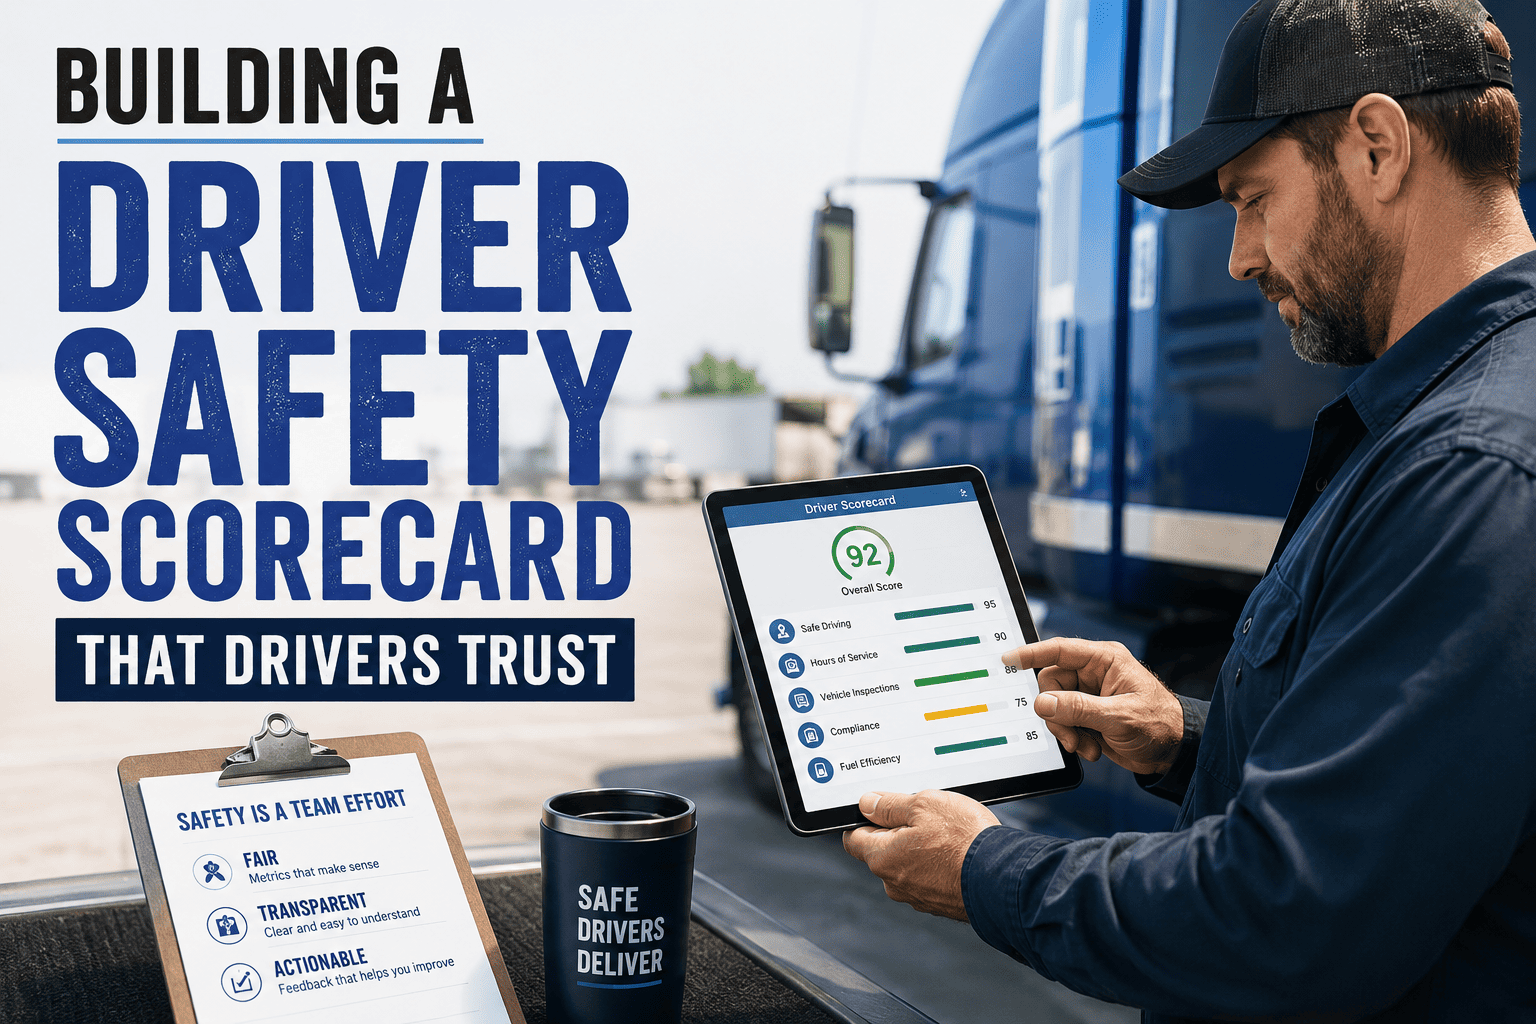
A driver safety scorecard only changes behavior when drivers believe the number is fair — and fairness is where most fleet programs quietly fail. When scores swing week to week for no obvious reason, penalize a driver for a mountain grade they had to descend, or hide behind a black-box formula, the scorecard stops being a coaching tool and becomes a grievance generator. The fleets that get this right build scorecards around five defensible components, group drivers against true peers, and tie top-quartile performance to recognition and gainshare. If you want to see how Oxmaint pulls telematics, DVIR, fuel and HOS data into one transparent score, you can Start Free Trial and configure the peer benchmarking for your own lanes.
Is your driver score the number your drivers actually defend — or the number they dispute?
A trusted scorecard combines telematics events, DVIR completion, idle time, speeding and HOS compliance into a composite 0–100 score that drivers can read, reproduce and improve. Build it wrong and you spend more time in grievance meetings than coaching sessions.
What actually goes into a composite driver safety score
Most defensible fleet scorecards roll five weighted inputs into a single 0–100 number. Safety events carry the heaviest weight because they correlate most strongly with claim frequency; DVIR and HOS act as compliance multipliers that can cap or unlock the score.
Safety events per 100 miles
Hard brakes, harsh cornering, sudden acceleration and following-distance violations, each weighted by severity. Normalizing per 100 miles removes the bias against high-mileage drivers.
Target: under 1.2 events / 100 miSpeeding events
Time spent above the posted limit, weighted by how far over. A 6-second 5-mph exceedance is not the same as a 90-second 15-mph exceedance — the formula should know the difference.
Target: under 0.4 min / 100 miIdle time
Unnecessary idle above a configurable threshold — typically 5 minutes stationary with the engine running. Excluded from winter-idle exemptions and PTO-driven idle in refrigerated units.
Target: under 5% of drive timeDVIR completion rate
The percentage of duty days with a completed Driver Vehicle Inspection Report. FMCSA requires it; the scorecard rewards drivers who file consistently — even when no defects are found.
Target: 98%+ duty days filedHOS compliance
No violations of hours-of-service rules — no form-and-manner logs, no 30-minute break violations, no 11/14-hour breaches. A single egregious violation can cap the composite score for the week.
Target: 0 log violations / 30 daysEach normalized component (E, S, I, D, H) is expressed as a 0–100 penalty against a peer-group baseline, then multiplied by its weight. The result is a defensible 0–100 composite — the same number a driver sees in their app.
Three reasons drivers stop believing the number
A scorecard does not fail because the math is wrong. It fails because drivers perceive the math as unfair. The three trust gaps below show up in nearly every fleet that has tried to roll out a scoring program and watched it stall.
Comparability — comparing apples to mountain passes
A driver running I-70 at 2 a.m. in a January storm will trigger more hard-brake events than a daytime city courier — and they should not be ranked against one another. Peer grouping by route type, terrain class and shift window fixes this. A 220-truck dry-van fleet in the Pacific Northwest saw grievance disputes drop 80% in one quarter after switching from a single national benchmark to four peer cohorts.
Transparency — the black-box problem
If a driver cannot open the app, see their 87.4 score, see the three hard-brake events driving it, and see the peer-group median of 91.2, the number is indefensible. Every event should carry a timestamp, a GPS pin and a severity tag so a driver can replay the moment and recognize their own behavior.
Actionability — a score with no next step is a verdict
Drivers need specific, coachable actions: increase following distance on US-97 descents, brake earlier at the Troutdale scales, complete DVIR before the pre-trip window closes. A black-box number that moves up or down mysteriously produces resentment, not improvement. Pair each flagged event with the 60-second coaching clip that explains it.
What changes when drivers trust the score
Fleets that move from a punitive, opaque scoring model to a transparent peer-benchmarked one typically see event frequency fall 40–60% within twelve months. The table below maps the shift across the metrics that matter to safety and operations leaders.
| Dimension | Punitive, opaque scorecard | Transparent, peer-benchmarked scorecard |
|---|---|---|
| Hard-brake frequency | Flat or rising — drivers game the sensor | Down 40–60% within 12 months |
| Driver disputes per month | 8–15 per 100 drivers, many escalations | Under 2 per 100 drivers, resolved in-app |
| DVIR completion rate | 72–80%, pencil-whipped reports | 96–99%, genuine defect capture |
| Coachable action clarity | Score drops, no explanation | Each event tagged with a next action |
| Top-quartile retention | Top drivers leave for fleets that recognize them | Gainshare bonus holds the top quartile |
| Union / grievance load | Active grievance file on the program | Program co-signed by driver committee |
Why the upside beats the stick
Behavior change is faster when there is something to gain, not just something to lose. A 350-power-unit regional carrier tied a $0.02/mile gainshare bonus to top-quartile safety scores and saw hard-brake events fall 52% in nine months — roughly $1.4M in avoided claims and brake wear over the first year.
Once we grouped drivers by route type and showed them the peer median next to their own score, the disputes stopped. The drivers started asking how to get into the top quartile — that is when the program started paying for itself.
— Director of Safety, 410-truck refrigerated carrier, Midwest regionA realistic scorecard rollout timeline
Trusted scorecards are not launched in a week. The timeline below reflects what a mid-size fleet should expect when moving from raw telematics reports to a transparent, peer-benchmarked, gainshare-ready program.
Pull 90 days of telematics, DVIR, HOS and fuel data. Identify missing fields, sensor calibration gaps and the natural peer cohorts already forming inside your lanes.
Lock the component weights with your safety committee. Build three to six peer groups by route type, terrain and shift. Run the formula in shadow mode — drivers see nothing yet.
Show each driver their own score, their event list and their peer-group median in the app. No consequences yet. Collect feedback and fix edge cases — weather exemptions, PTO idle, relay handoffs.
Safety managers begin weekly 10-minute coaching conversations with bottom-quartile drivers, each conversation anchored to two specific flagged events and one actionable next step.
Launch the top-quartile gainshare bonus. Expect a 20–30% jump in scorecard engagement in the first 60 days as drivers see the upside is real and paid on schedule.
Most fleets see a 40–60% reduction in safety-event frequency, a measurable drop in claims severity, and a top-quartile retention rate that finally outpaces industry turnover.
Turn your telematics firehose into a score drivers defend
Oxmaint integrates telematics, DVIR, fuel and HOS data into one configurable scorecard with peer benchmarking built in. Set it up in shadow mode, preview with your safety committee, and go live when the number is defensible.
Driver safety scorecard — questions fleets actually ask
How do we keep weather and terrain from unfairly hurting a driver's score?
Use peer grouping, not exemptions. Group drivers by route type, terrain class and shift window so a night mountain driver is benchmarked against other night mountain drivers. You can also apply a configurable weather flag that suppresses low-severity events during NWS-adverse conditions, but peer grouping does most of the heavy lifting and is far easier to defend in a grievance hearing.
What is a realistic weight for safety events in the composite formula?
Most defensible scorecards weight safety events between 30% and 40% of the composite, with speeding at 20–25%, idle at 10–15%, DVIR at 10–15% and HOS at 10%. Safety events carry the heaviest weight because they correlate most directly with claim frequency and severity. Document the weighting logic with your safety committee before launch so it is co-signed, not imposed.
Should we show drivers their peers' individual scores or just the median?
Show the peer-group median, not individual scores. The median gives drivers a defensible benchmark without exposing coworkers to comparison fatigue or retaliation concerns. Pair the median with the driver's own score, their event list and the coaching action for each flagged event. To see exactly how the driver-facing view looks, you can Book a Demo and we will walk through it on your lanes.
How long until we see a measurable drop in safety events?
Fleets that launch with transparent peer benchmarking and a coaching workflow typically see a 20–30% reduction in the first 90 days and 40–60% within twelve months. The acceleration happens when the gainshare bonus goes live — upside drives faster behavior change than penalties, especially for drivers already in the second quartile who can realistically reach the top.
Can a scorecard work for a mixed fleet with dry van, reefer and flatbed?
Yes, but only with separate peer groups. Reefer drivers deal with PTO-driven idle that should not count against them, flatbed drivers face load-securement stops that look like idle, and dry van is the cleanest baseline. Configure the idle threshold and exemption rules per division, then let the peer groups handle the rest. A single national benchmark across mixed equipment is the fastest way to lose driver trust.
Build a scorecard your drivers will defend — not dispute
Pull telematics, DVIR, fuel and HOS into one transparent composite score with peer benchmarking configurable per fleet. Run it in shadow mode, preview with your safety committee, and go live when the number is defensible.
Free 14-day trial · No credit card



.png)