Every fleet says it values driver safety. But only 34% of commercial fleets in 2026 have a formalized driver scorecard system that translates telematics data into actionable performance scores. The rest rely on gut feelings, occasional ride-alongs, and reactive disciplinary conversations after an incident has already occurred. A driver scorecard takes the guesswork out of performance management — converting hard braking events, speeding violations, idle time, HOS compliance, and inspection completion into a single, weighted score that every driver and manager can understand. Fleets with active scorecard programs report 28% fewer preventable accidents and 19% lower insurance premiums within 18 months of implementation. The key is connecting scorecard data to actionable coaching workflows — which is where platforms like OxMaint add a critical layer by tying driver behavior data to vehicle condition reports, inspection compliance, and maintenance cost attribution per driver-vehicle pairing.
Fleet Driver Scorecard and Performance Monitoring Guide 2026
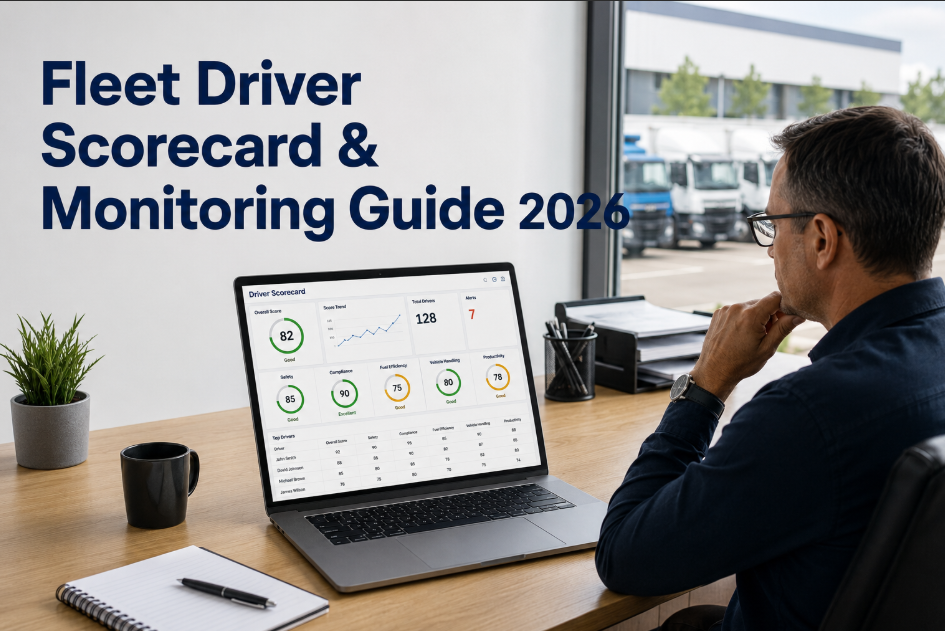
How to build, implement, and use driver scorecards to improve fleet safety, reduce insurance costs, and create a data-driven coaching culture — with telematics integration and maintenance data connections.
What Is a Driver Scorecard?
A driver scorecard is a weighted scoring system that aggregates multiple performance metrics into a single composite score per driver. It draws data from telematics, ELD systems, inspection records, and maintenance platforms to provide an objective, comparable measure of driver behavior and compliance. Unlike anecdotal performance reviews, scorecards create a consistent standard that every driver is measured against — eliminating bias and enabling early intervention before risky behavior becomes an incident.
The most effective scorecards weight metrics based on their correlation with accident risk. Hard braking events, for example, are weighted higher than average speed because telematics data shows hard braking correlates 3.2x more strongly with crash involvement. Fleets that combine driving behavior scores with vehicle condition reporting through platforms like OxMaint get a complete picture of whether a driver is safe, compliant, and protecting the asset they operate. Ready to see what a connected scorecard looks like? Start a free trial and book a demo to see the driver-vehicle pairing data.
Building a Driver Scorecard: The 6 Core KPIs
Not all metrics matter equally. The six KPIs below are ranked by their correlation with accident risk and fleet cost impact, based on 2025–2026 industry benchmarks from the National Safety Council and ATA research.
Measured as deceleration events exceeding 8.8 ft/s per second. Benchmark: fewer than 3 events per 1,000 miles. This is the single strongest predictor of crash involvement across all telematics studies.
Time spent exceeding posted speed limit by 5+ mph. Benchmark: less than 4% of driving time. Speed-related crashes are 2.3x more likely to result in fatalities than other collision types.
Percentage of required pre-trip and post-trip inspections completed on time with full checklist items. Benchmark: 95%+ completion rate. Tracked and verified through OxMaint's digital inspection platform.
Percentage of days with zero HOS violations. Benchmark: 98%+ clean days. HOS violations correlate directly with fatigue-related incidents and carry FMCSA CSA point penalties.
Idle time as percentage of total engine hours. Benchmark: below 15%. Excessive idling wastes fuel, accelerates engine wear, and is a proxy for poor route discipline.
Quality and frequency of defect reports submitted through the maintenance platform. Benchmark: at least 1 defect report per 5,000 miles. Drivers who report defects proactively prevent 60% more roadside breakdowns.
Scorecard Without vs With Coaching Workflow
How OxMaint Adds the Maintenance Layer to Driver Scorecards
Most scorecard systems track driving behavior only. OxMaint adds the equipment dimension — connecting how a driver treats their vehicle to how that vehicle performs, what it costs to maintain, and whether defects are reported proactively or discovered during breakdowns.
OxMaint tracks maintenance costs by driver-vehicle pairing. Drivers who consistently generate higher repair costs on the same vehicle type become visible — enabling targeted coaching on vehicle handling and defect prevention.
Drivers who complete thorough inspections and report defects early are scored higher than those who submit rushed, checkbox-only inspections. OxMaint measures inspection quality by the correlation between driver reports and technician findings.
OxMaint provides per-driver pre-trip and post-trip completion percentages with timestamps. This feeds directly into the scorecard inspection compliance KPI with verifiable data — not self-reported completion claims.
Track how vehicle condition scores change when assigned to different drivers. Vehicles that deteriorate faster under certain operators indicate driving behavior issues that telematics alone may not capture — like clutch abuse or tire wear from hard cornering.
Adding the maintenance dimension to your scorecard transforms it from a safety tool into a total fleet performance system. See how OxMaint connects these data points — start a free trial or book a demo to see driver-vehicle analytics in action.
Frequently Asked Questions
How often should driver scorecards be reviewed?
Should scorecard scores be public or private?
What telematics data does OxMaint use for driver performance?
Can scorecards be tied to driver compensation or bonuses?
Build Scorecards That Include the Full Picture
OxMaint adds the maintenance and inspection layer that most scorecard systems miss — connecting driver behavior to vehicle condition, repair costs, and defect reporting quality. See how it works for your fleet in a 30-minute walkthrough.