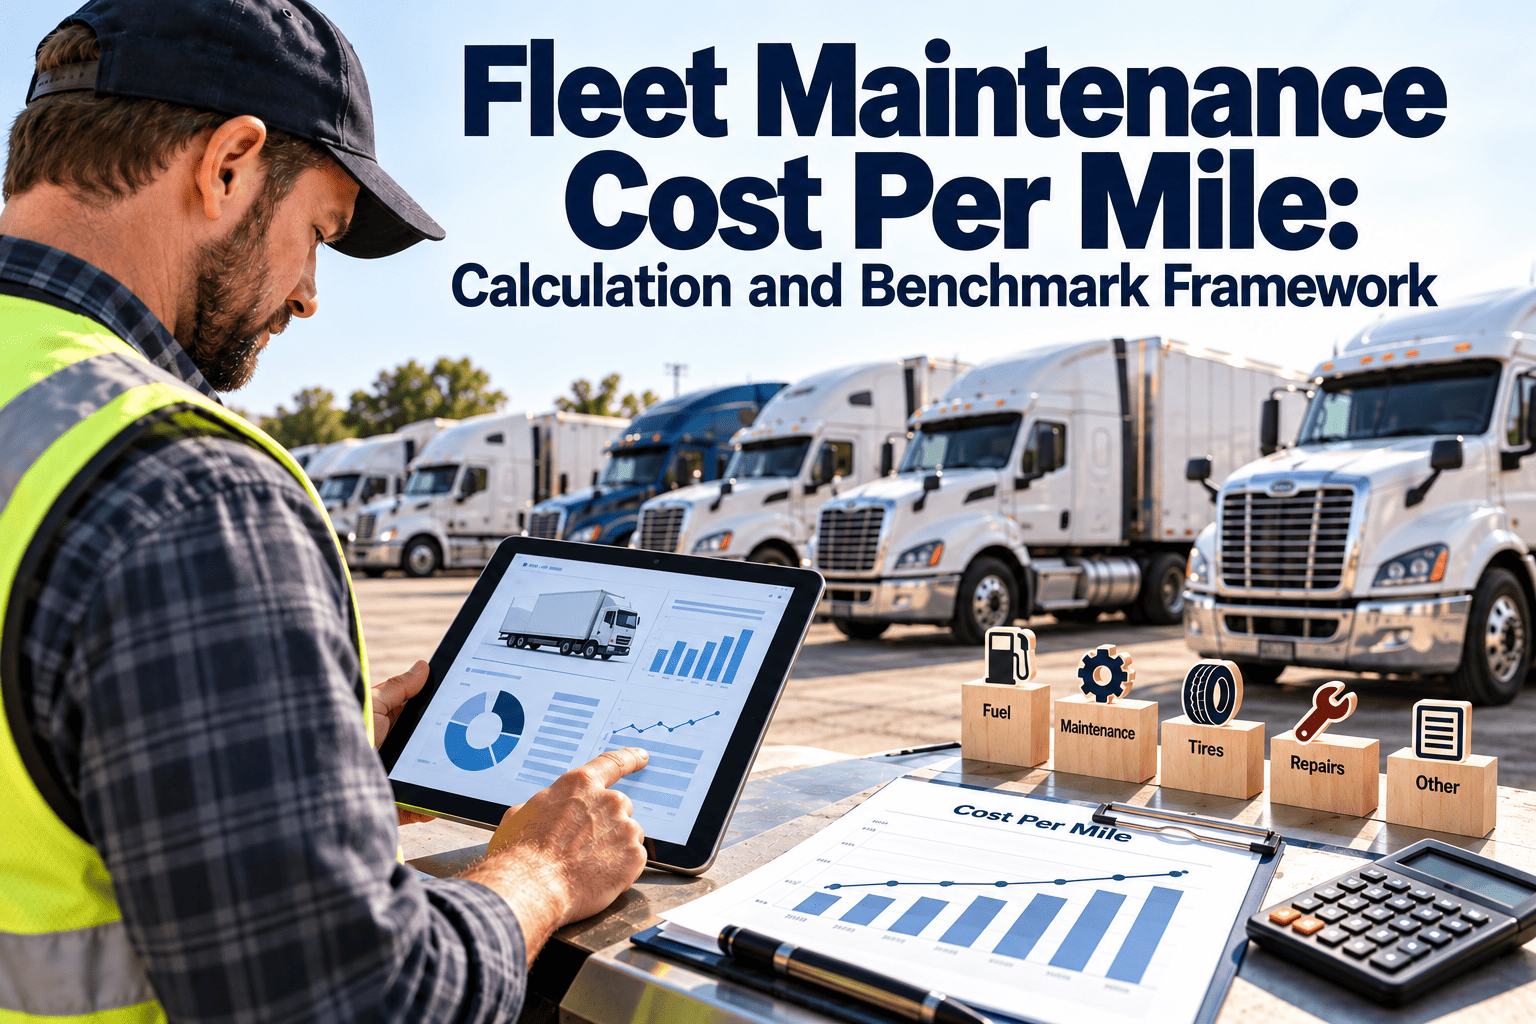
Fleet maintenance cost per mile is one of the few numbers that tells a fleet manager the truth about a vehicle, regardless of how the rest of the budget looks. A truck can appear profitable on a route-by-route basis while quietly bleeding money through rising repair costs, and cost per mile is what surfaces that pattern before it becomes a crisis. Most fleets track total maintenance spend, but far fewer normalize it against mileage in a way that allows real comparison across vehicles, vintages, and duty cycles. This framework walks through how to calculate maintenance cost per mile correctly, what the number should include, how to benchmark it, and where platforms like Oxmaint make the calculation something a fleet team can actually maintain over time rather than rebuild every quarter.
Fleet Maintenance Cost Per Mile: A Calculation and Benchmark Framework
A structured method for calculating true maintenance cost per mile, comparing it against realistic benchmarks by vehicle class, and using the number to guide repair, replace, and preventive maintenance decisions.
Why Maintenance Cost Per Mile Matters More Than Total Spend
Total maintenance spend rises and falls with fleet size, utilization, and seasonality, which makes it a poor number for comparison. Cost per mile normalizes that spend against actual usage, so a fleet manager can compare a heavily used delivery van against a lightly used backup vehicle on equal footing.
What Belongs in "Total Maintenance Cost"
The most common calculation error is scoping the numerator too narrowly. A cost-per-mile figure that only includes parts invoices will always understate the real cost of keeping a vehicle on the road.
What should generally be excluded: fuel, insurance, registration, and depreciation. These belong in a broader total cost of ownership calculation, not the maintenance cost per mile figure specifically, and mixing them in makes the number harder to benchmark against industry references.
Benchmarking by Vehicle Class
Cost per mile varies significantly by vehicle class, duty cycle, and age, which is why a single fleet-wide average is rarely useful on its own. Benchmarking works best when segmented, and compared against the fleet's own historical trend rather than treated as a fixed external target.
| Vehicle Class | Typical Cost Driver | What Pushes It Up | What Brings It Down |
|---|---|---|---|
| Light-Duty Vans | Brakes, tires, routine service intervals | Stop-and-go urban delivery routes | Consistent PM adherence, driver behavior monitoring |
| Medium-Duty Trucks | Suspension, drivetrain wear, tires | Mixed load weights and route terrain | Scheduled inspections tied to mileage triggers |
| Heavy-Duty Trucks | Engine, transmission, major component overhaul | Aging fleet segments past major overhaul mileage | Predictive component replacement before failure |
| Refrigerated Units | Reefer unit servicing, compressor wear | Continuous-run cooling cycles | Dedicated reefer PM schedule separate from chassis |
Reading the Trend, Not Just the Number
A single cost-per-mile snapshot rarely tells the full story. What matters is the trend line for each vehicle over time, since a steadily climbing figure is usually the earliest warning sign that a vehicle is approaching the point where replacement is cheaper than continued repair.
Calculate True Cost Per Mile Without Reassembling Spreadsheets Every Month
Oxmaint ties parts, labor, outside repairs, and preventive maintenance costs directly to each vehicle's mileage record, so cost-per-mile reporting stays current automatically.
Using Cost Per Mile in the Repair-Versus-Replace Decision
One of the most direct applications of this metric is deciding when a vehicle has crossed from an asset worth repairing into one that should be scheduled for replacement. Comparing a vehicle's trailing cost per mile against the depreciation-adjusted cost of a replacement vehicle gives a far more defensible answer than instinct alone.
Common Mistakes in Cost Per Mile Calculations
Building the Habit Into the Maintenance Workflow
Cost per mile is only useful if it updates automatically as work orders close, rather than requiring a manual export and spreadsheet reconciliation every reporting period. A CMMS that ties parts cost, labor time, and vendor invoices directly to each vehicle's mileage record turns this from a quarterly project into a live dashboard.
That same record also becomes the evidence base for repair-versus-replace conversations with finance, since the trend is documented rather than anecdotal.
Frequently Asked Questions
It varies widely by vehicle class, age, and duty cycle, which is why benchmarking against the fleet's own historical trend is generally more useful than a single external target figure.
No. Fuel belongs in a separate operating cost or total cost of ownership calculation, since mixing it into maintenance cost per mile makes the figure harder to compare and benchmark accurately.
Monthly at minimum for active fleets, since a quarterly or annual view can hide a developing trend until it becomes an expensive surprise. Book a demo to see automated cost-per-mile reporting in Oxmaint.
It is one of the strongest indicators available, particularly when the trend is rising steadily and preventive maintenance is no longer bringing it back down.
Consistent preventive maintenance generally keeps cost per mile lower and more stable, since it catches wear before it escalates into a corrective repair with added downtime and labor cost. Sign up to set up preventive schedules across your fleet.
Stop Estimating Maintenance Cost Per Mile. Start Measuring It Automatically.
Oxmaint connects work orders, parts cost, labor time, and mileage into one live view, so cost-per-mile reporting is always current and always accurate.