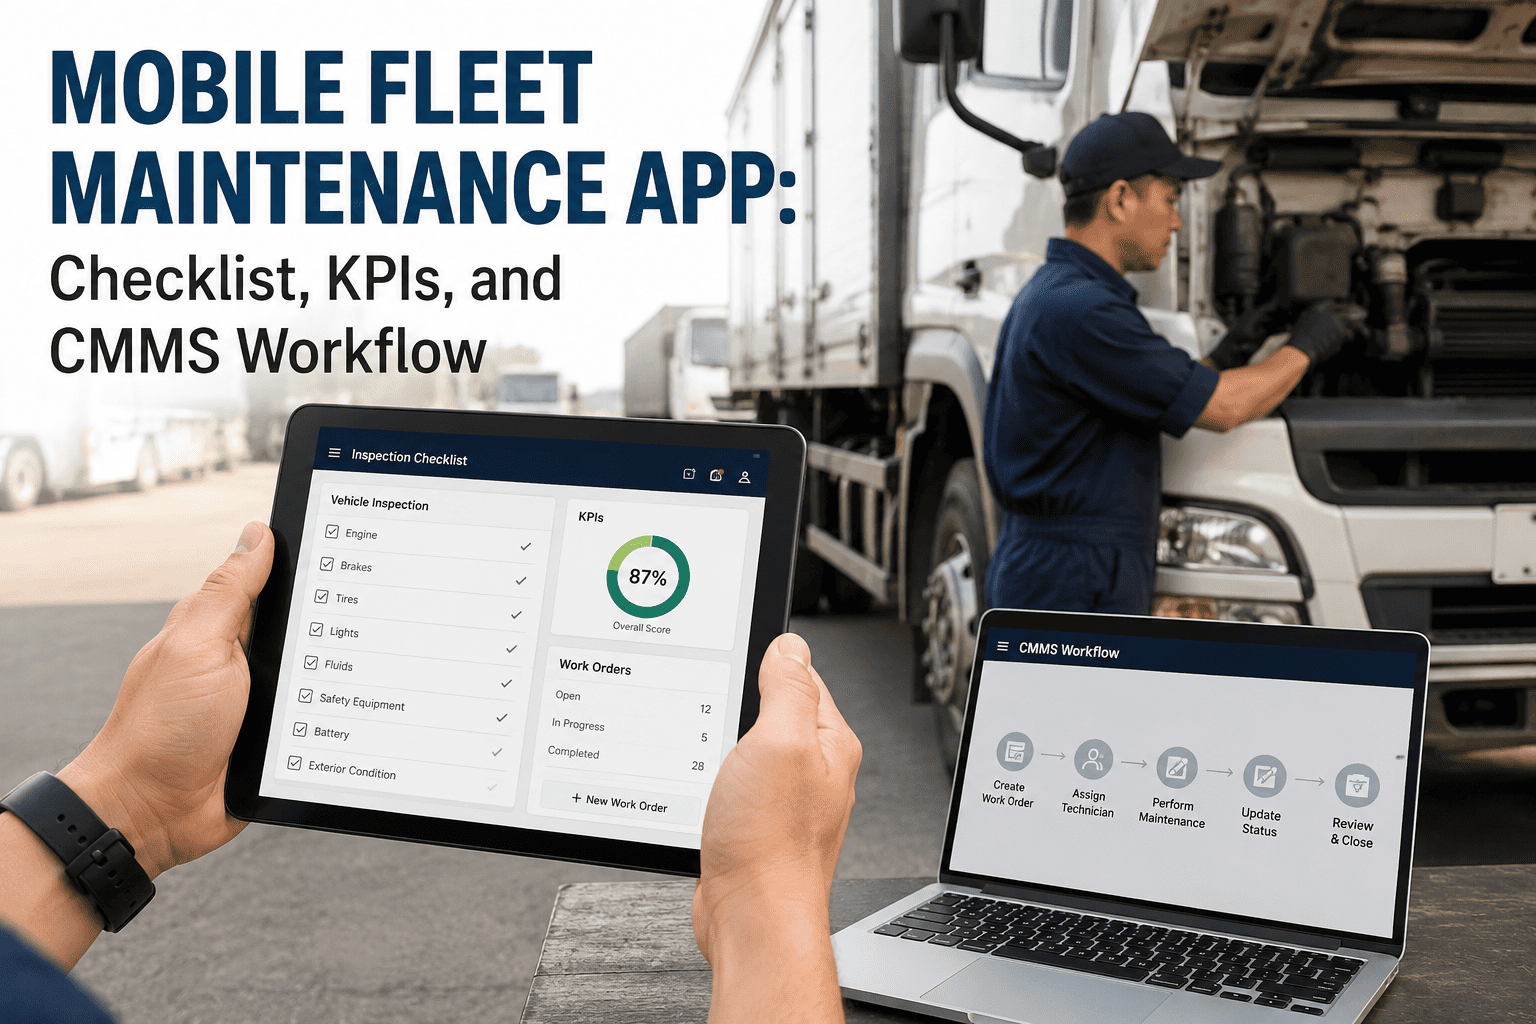
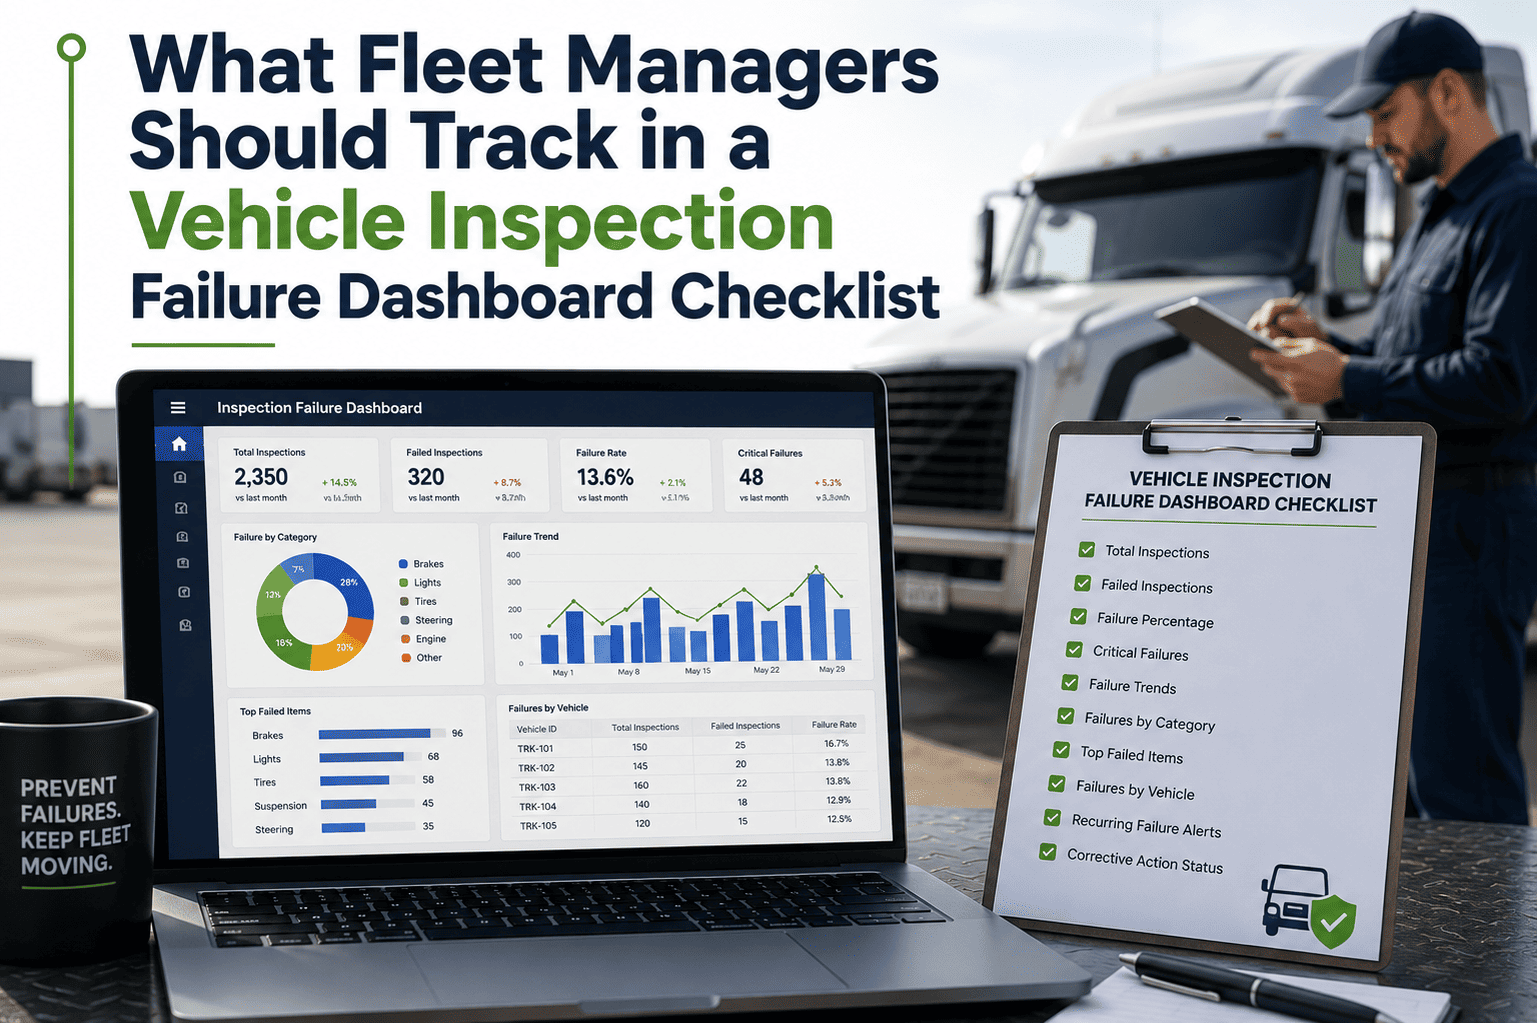
A vehicle inspection failure is not just a checkbox that got marked "defect" — it is a data point that should trigger a work order, feed a KPI, and close inside a CMMS workflow before the vehicle rolls again. Yet paper DVIRs catch only about 27% of the defects that cause mid-route failures, while the metrics that would expose the gap go unmeasured. This guide covers the checklist that catches failures, the KPIs that quantify them, and the CMMS workflow that resolves them. Sign Up Free to run all three in one system.
Turn Every Inspection Failure Into Measurable Action
OxMaint captures each failed item with photo and timestamp, auto-generates the work order, and calculates your DVIR completion, pass rate, and defect-to-repair KPIs live — so inspection failures become resolved work orders, not forgotten checkmarks.
Part 1 — The Inspection Failure Checklist
A failure is only useful if it is caught consistently. This checklist covers the component zones that generate the most out-of-service findings and mid-route breakdowns, in the order a driver should walk them. Brake defects alone account for over 40% of all vehicle out-of-service orders — so the walk-around is not busywork, it is the highest-leverage safety action of the shift. Book a Demo to see these zones as a guided mobile sequence.
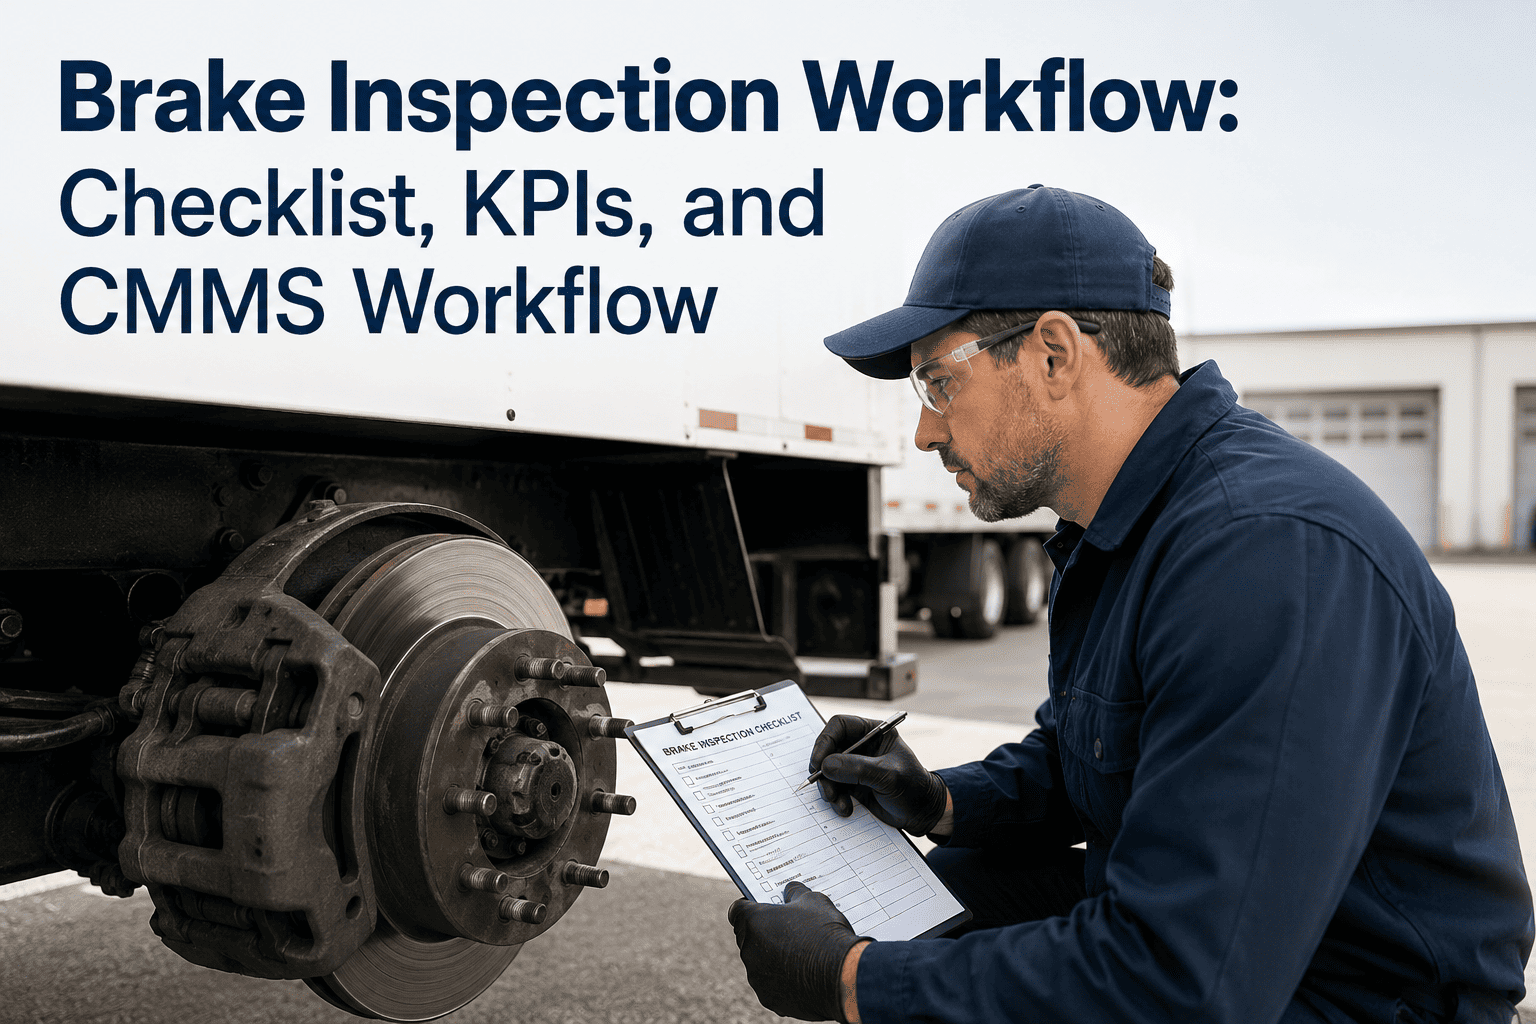
Brake system — pads, drums, hoses, air pressure, push-rod stroke
Inspect pad and lining thickness, check drums for cracks, look for chafed or leaking hoses, and run an air-system pressure test. The 20% rule applies: if 20% or more of a vehicle's brakes are defective, it is out of service. Brakes are the number-one OOS cause year after year and are catchable in a proper pre-trip pull test.
Tires — tread depth, sidewall condition, inflation, matching
Measure tread depth against the minimum, inspect sidewalls for cuts and bulges, and confirm inflation at rated pressure — not standard truck pressure. Tire violations make up 21–23% of vehicle OOS orders and cause tens of thousands of accidents a year. An under-inflated or damaged tire fails without warning at highway speed.
Lighting and electrical — headlamps, markers, signals, reflectors
Verify every headlamp, marker light, turn signal, brake light, and reflector functions. Burned-out lights rarely cause an OOS on their own, but they add inspection time, generate CSA points, and signal poor maintenance — which triggers a deeper Level 1 inspection.
Fluids and leaks — engine oil, coolant, hydraulic, fuel
Check levels and look under the vehicle for fresh leaks. Milky oil signals coolant contamination and demands immediate shutdown. Fluid and cooling issues account for roughly 15% of unplanned downtime and are almost always visible before catastrophic failure.
Steering, suspension, and coupling devices
Check for play in the steering, inspect springs and shackles, and verify fifth-wheel or coupling security on combination units. Coupling defects are a safety-critical failure that auto-grounds the vehicle — no dispatch until documented resolution.
Documentation — annual inspection, registration, ELD status
Confirm the annual inspection is current — a missing annual is the second most common FMCSA violation, near 12,000 citations a month. Expired credentials place the vehicle OOS and can trigger a full DOT audit. Set expiration alerts at 30, 60, and 90 days out.
Make the Checklist Impossible to Pencil-Whip
OxMaint's guided inspection forces a photo on every defect item, timestamps and GPS-tags each finding, and blocks close-out while a safety-critical failure stays open — closing the gap that lets 43% of critical issues slip past paper checklists.
Part 2 — The KPIs That Quantify Failure
You cannot manage what you do not measure. These are the metrics that turn scattered inspection failures into a performance picture, with the 2026 benchmarks that separate best-in-class fleets from the pack. Track operational KPIs weekly, financial KPIs monthly, and compliance quarterly — and every review should produce action items with owners and deadlines. The table scrolls sideways on mobile.
| KPI | What it measures | 2026 benchmark | Red flag |
|---|---|---|---|
| DVIR completion rate | Required inspections actually done on time | 97%+ | Below 90% |
| Inspection pass/fail rate | Defects flagged vs. clean inspections | Context-based | 100% = pencil-whipping |
| Defect-to-repair time | Defect discovery to work order to fix | Same day / 2–4 hrs | Over 48 hours |
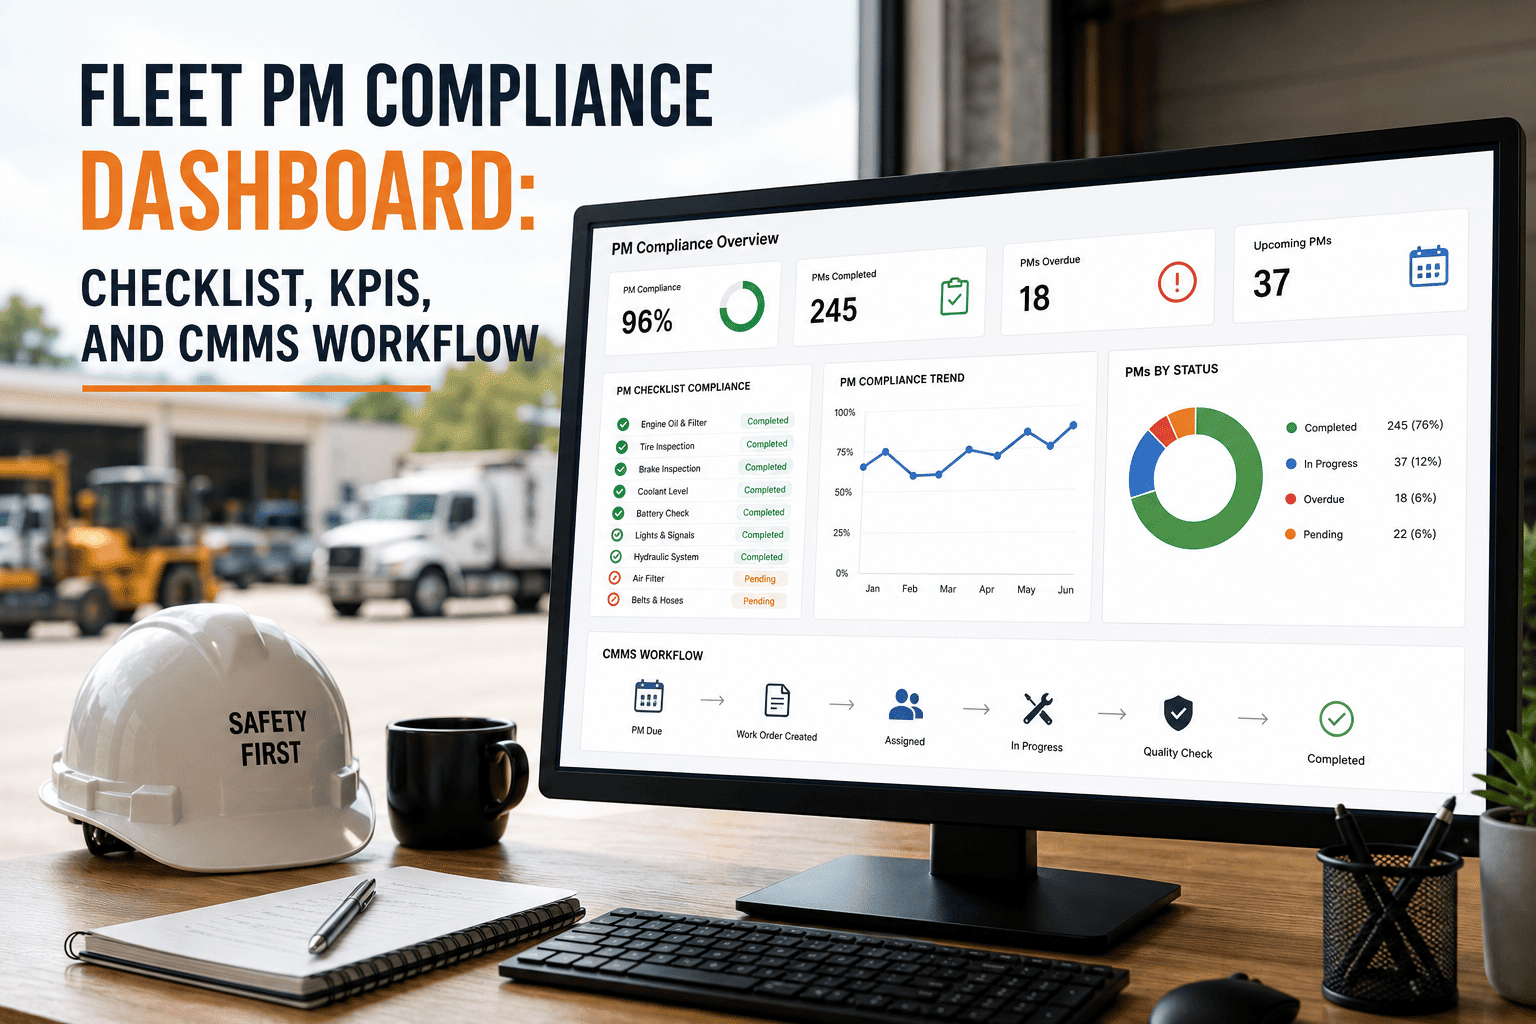
| PM compliance rate | Completed PMs vs. scheduled PMs | 95%+ | Below 85% |
| MTBF | Miles or hours between failures | 75,000+ mi top fleets | Near 10,600 mi average |
| MTTR | Average time to restore a vehicle | Under 4 hours | 12–18 hours |
| Scheduled vs. unscheduled | Planned work as share of total | 80 / 20 | Near 55 / 39 |
| Fleet availability | Available hours vs. scheduled hours | 95%+ | Below 87% |
Watch the pass rate carefully: a 100% pass rate is not a healthy fleet — it is a warning sign of pencil-whipping. A realistic failure rate proves drivers are actually inspecting. Improving PM compliance from 70% to 95% typically cuts breakdowns by around 50%.
Part 3 — The CMMS Workflow That Resolves It
A checklist finds the failure and a KPI measures it, but only the workflow closes it. Here is the loop every inspection failure should travel inside a CMMS — from the driver's phone to a verified repair — with no manual handoff where a defect can get lost. Sign Up Free to run this exact workflow.
Capture
Driver completes the guided digital DVIR. A failed item requires a photo, auto-attaches GPS and timestamp, and records the driver's signature — building an audit-ready record retrievable in seconds.
Classify
The failure is tagged Pass, Monitor, Repair, or Out of Service. Safety-critical items auto-ground the vehicle and notify the safety manager within minutes — no vehicle dispatched with an open critical defect.
Generate
Every Repair and OOS finding auto-creates a work order with parts reserved and a technician assigned. The system will not close the inspection with an unlinked failure — the loop cannot be skipped.
Resolve and verify
The technician completes the repair, logs parts and hours, and certifies the fix. Only then is the vehicle cleared. Repair certification is required before dispatch — closing the documentation gap that causes most audit violations.
Feed the KPIs
Every step feeds the dashboard automatically — DVIR completion, defect-to-repair time, MTTR, and PM compliance update with no data entry. Recurring failures surface as trends that drive preventive action.
Before the workflow was digital, we genuinely could not tell you our DVIR completion rate — the paper forms sat in a filing cabinet. Six months after switching, completion hit 96%, our defect-to-repair time dropped from three days to under a shift, and our unscheduled repair ratio fell by nearly twenty points. The KPIs finally described reality instead of paperwork.
— Fleet Operations Manager, mixed medium-duty fleet, 60 vehicles
Frequently Asked Questions
The questions fleet and maintenance managers ask most about connecting inspection failures to KPIs and a working CMMS loop.
There is no single number, but a 100% pass rate is a red flag for pencil-whipping. A realistic failure rate shows drivers are inspecting thoroughly. Watch the pattern by vehicle and component to find maintenance priorities.
Start with the big five: PM completion, MTBF, MTTR, availability, and planned-vs-unplanned ratio. Add defect-to-repair time and cost per mile once you have a few months of clean data. Sign Up Free to see them calculated automatically.
Same day for safety-critical items and within 24 hours for the rest. Digital systems cut defect-to-work-order time to 2–4 hours, while paper shops average one to three days — a gap where breakdowns are born.
Because auditors can only credit what is documented. Missing signatures, uncompleted repair certifications, and misfiled records make real work invisible. A workflow that requires complete fields eliminates that gap entirely.
Yes. Every inspection, defect, and work order feeds the dashboard automatically — DVIR completion, MTBF, MTTR, PM compliance, and cost per mile update in real time with no spreadsheets. Book a Demo to see the live dashboard.
Checklist, KPIs, and Workflow — One Connected System
OxMaint unifies the inspection checklist that catches failures, the KPI dashboard that quantifies them, and the CMMS workflow that resolves them — so every failed item flows from a driver's phone to a verified repair, and your metrics finally tell the truth about your fleet.