Most fleet acquisition decisions are made on purchase price. Most fleet replacement decisions are made on repair frequency. Neither uses the right number. Total Cost of Ownership — the complete financial cost of a vehicle from acquisition through disposal — is the only metric that allows a CFO to make defensible fleet investment decisions, compare vehicle classes fairly, or determine the optimal replacement point. A Class 8 truck purchased for $165,000 may cost $0.68 per mile to operate over its service life. A comparable leased unit at $2,400/month may cost $0.54/mile when fuel, maintenance, insurance, and residual value are properly accounted. The $28,000 purchase price difference is irrelevant without the full TCO picture. OxMaint's CMMS generates the maintenance cost inputs for every TCO calculation automatically — work order costs per vehicle, PM compliance rates, and downtime hours are available in real time without manual data extraction.
Total Cost of Ownership for Fleet Vehicles: A CFO's Framework
Acquisition through disposal — the complete TCO framework covering all 8 cost categories, calculation methods, CMMS data requirements, and technology impact analysis for defensible fleet financial decisions.
Where TCO Money Actually Goes — The 8 Cost Categories
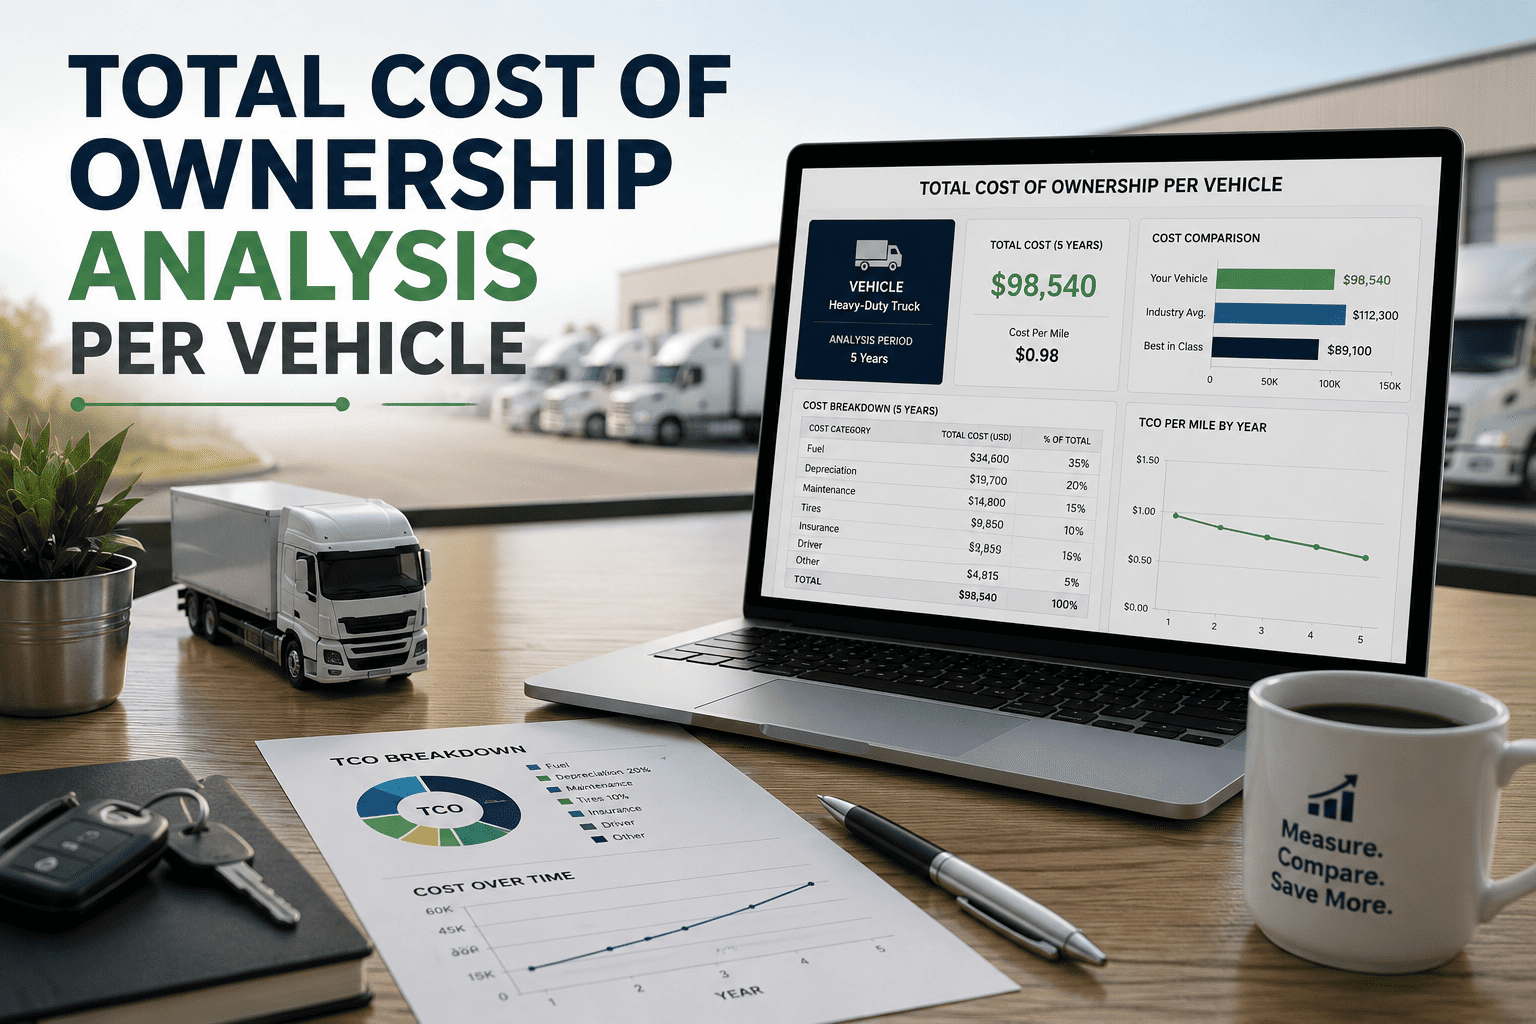
Fleet TCO is not dominated by fuel — though fuel gets the most attention in fleet management discussions. The largest single controllable cost category is maintenance, accounting for 35–42% of total operating cost on typical commercial fleets. Depreciation is the largest fixed cost. Understanding the proportion each category represents allows CFOs to prioritise which cost reduction initiatives will have the most financial impact. OxMaint provides the maintenance cost data that populates categories 3, 4, and 5 automatically from work order history.
TCO Over the Vehicle Lifecycle: When to Replace
Vehicle TCO does not remain constant across a service life — it follows a U-shaped cost curve. Early years are dominated by depreciation and finance cost. Middle years are the lowest total cost period. Late years see rapidly increasing maintenance and downtime costs as components reach end of life. The financial optimal replacement point is where the marginal cost of keeping the vehicle for one more year exceeds the annualised acquisition and ownership cost of a replacement. Most fleet CFOs replace too late — keeping vehicles into the steep cost escalation zone because replacement CapEx is visible and maintenance costs are distributed across many small invoices that never get aggregated. OxMaint generates per-vehicle lifetime cost reports that make this comparison visible and actionable.
Own vs Lease: TCO Comparison Framework
The own vs lease decision is one of the most financially significant in fleet management — and is routinely made on the wrong inputs. Lease payments are visible and predictable. Ownership costs are distributed, often untracked, and systematically underestimated. The correct comparison requires an apples-to-apples TCO calculation that includes the residual value capture of ownership, the flexibility cost of lease restrictions, and the maintenance cost differential between new leased vehicles and older owned vehicles. OxMaint's cost per vehicle reporting provides the maintenance cost input that makes this comparison accurate rather than estimated.
How Technology Reduces Fleet TCO
Technology investment in fleet management has a direct, measurable impact on TCO — but only when the savings are tracked against a baseline. OBD condition monitoring converts calendar PM to condition-based PM, eliminating premature part replacements while catching actual failures earlier. AI digital twin modelling predicts the $8,000 transmission failure 60 days before it occurs, converting it into a $1,200 planned repair. AI vision cameras eliminate the compliance violation that generates a $16,000 penalty. SAP PM integration ensures every maintenance event posts to the enterprise asset record, giving finance teams the actual cost data that populates TCO models with accuracy rather than estimation. OxMaint combines all four technology streams in one platform — so the TCO reduction is visible in one dashboard rather than scattered across multiple systems.
We built our board-level fleet replacement model for the first time using actual per-vehicle TCO data from OxMaint. For the first time we could see that 14 vehicles in our fleet were past their TCO optimal point — their annual maintenance cost alone exceeded the annualised cost of replacement. We presented this to the CFO with a 3-year CapEx plan and got immediate approval.
Your Per-Vehicle TCO Data Is Already in OxMaint. Generate It Now.
Work order cost history, PM compliance rates, downtime hours, and parts spend per vehicle — all available in real time from 90 days of operation. Free to start.
CMMS Data Requirements for Accurate TCO
A TCO model is only as accurate as its maintenance cost inputs. Most CFOs receive maintenance cost estimates that are 20–40% understated because they exclude labour hours, parts not coded to vehicle, and warranty claim administration time. OxMaint captures every cost component against the vehicle record automatically — work order labour, parts cost, sublet cost, and downtime hours are all tagged per vehicle at point of entry.
Frequently Asked Questions
What is the average total cost of ownership per mile for a Class 8 truck?
Approximately $0.62–$0.82 per mile for a Class 8 truck operated at 100,000 miles per year, depending on fuel price, maintenance programme maturity, insurance rates, and financing terms. Fleets with structured CMMS PM programmes and condition-based maintenance consistently achieve the lower end of this range. OxMaint generates your actual cost per mile from work order history.
How do I determine the optimal replacement point for a fleet vehicle?
The optimal replacement point occurs when the projected cost of keeping a vehicle for one more year — including maintenance, downtime, and declining residual value — exceeds the annualised acquisition and ownership cost of a replacement. This requires accurate per-vehicle maintenance cost history, which CMMS work order data provides. Most fleets without CMMS underestimate maintenance costs by 20–40% and replace too late.
Is owning or leasing cheaper on a full TCO basis?
It depends on fleet size, usage pattern, and maintenance programme maturity. Full-service leases typically win on TCO for fleets that lack structured PM programmes, because the lessor's maintenance cost is built in and predictable. Ownership wins when the fleet has a mature CMMS PM programme that drives maintenance costs below the lessor's margin-inclusive contract rate. The comparison must use actual per-vehicle maintenance costs, not estimates. Book a demo to see how OxMaint generates the data for this comparison.
How does a CMMS reduce total cost of ownership?
A CMMS reduces TCO through five mechanisms: structured PM reduces reactive repair frequency (reactive costs 3× planned); OBD-integrated condition monitoring extends component life 15–25%; downtime reduction through predictive maintenance preserves revenue; compliance documentation reduces penalty exposure; and accurate cost tracking enables earlier replacement of high-TCO vehicles. Average documented TCO reduction is 18–24%. Start free and generate your first TCO report after 90 days.
Know Your Real Fleet TCO. Make Better Investment Decisions.
OxMaint generates per-vehicle TCO data automatically — maintenance cost, downtime, PM compliance rate. Free to start.