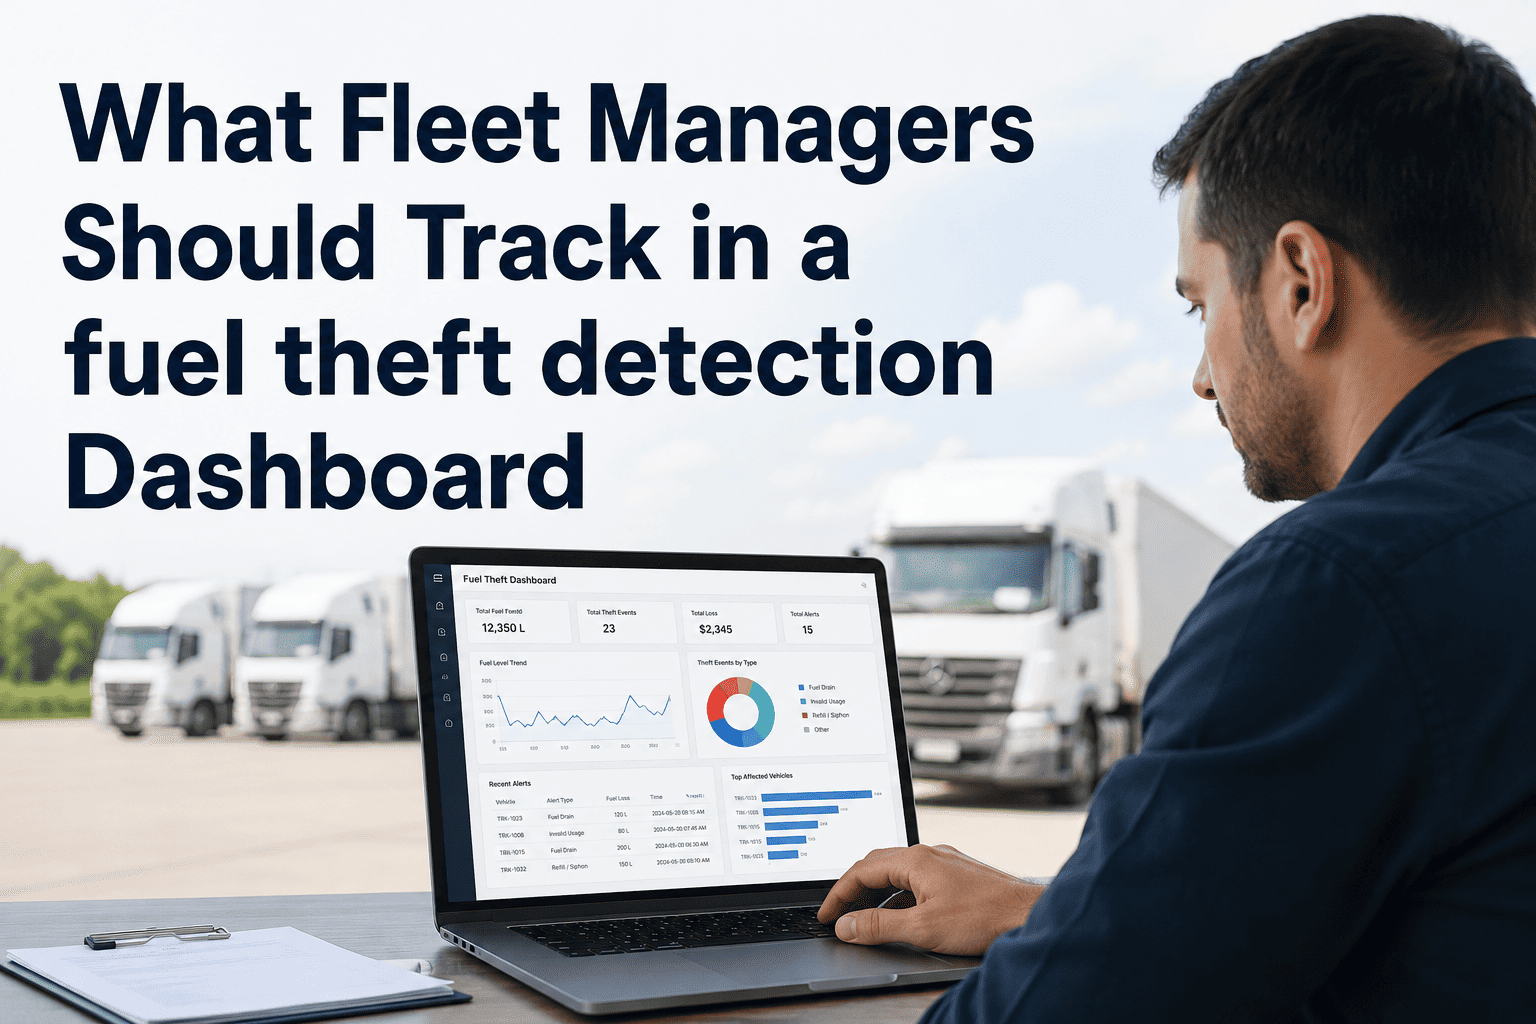
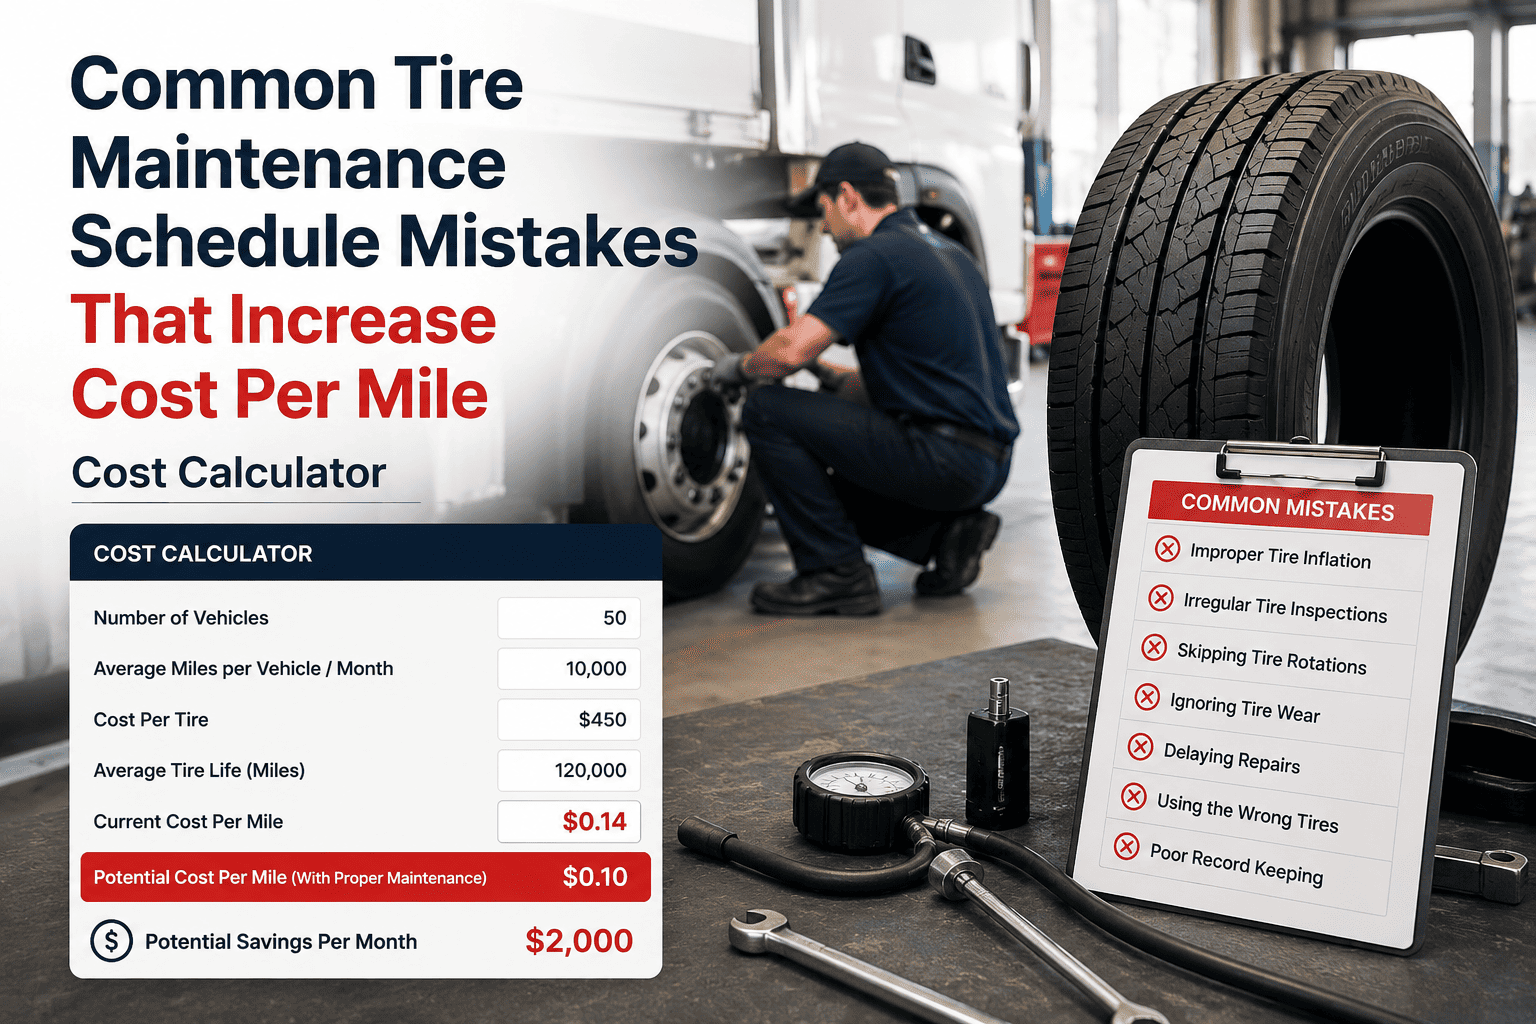
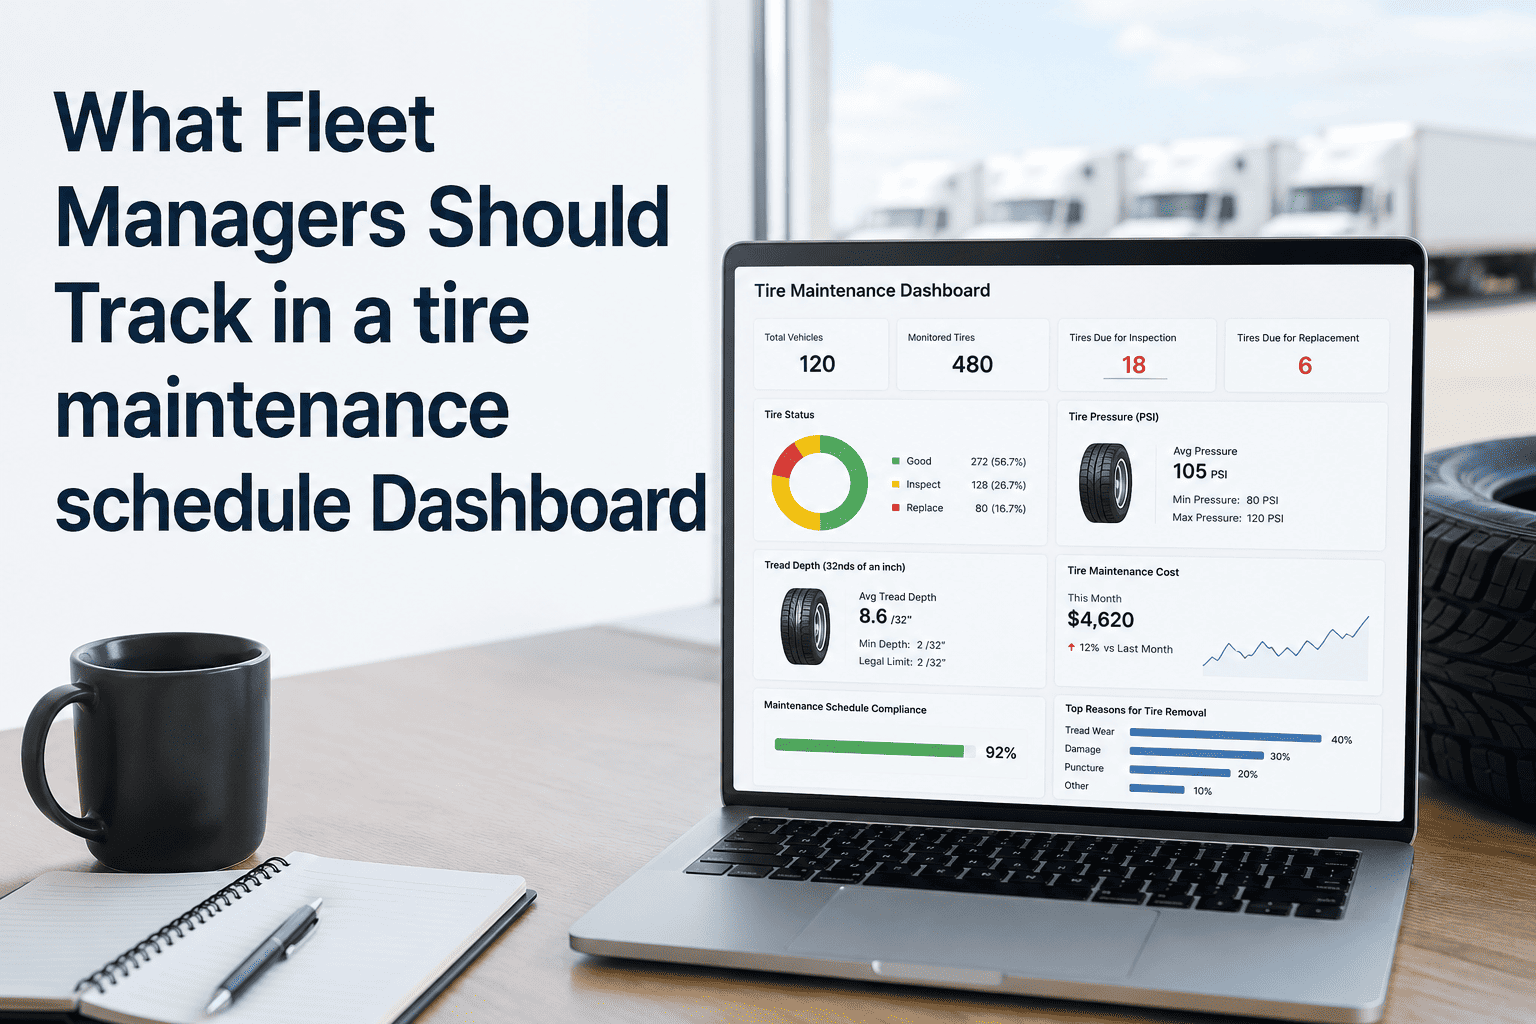
.png)
Fleet performance benchmarking has evolved from a simple cost comparison exercise into a sophisticated strategic tool that separates industry leaders from the rest. In 2026, with operating costs climbing and profit margins tightening, understanding where your fleet stands against industry standards isn't just helpful—it's essential for survival and growth.
The data paints a clear picture: fleets that actively benchmark their performance against industry peers achieve 23% higher operational efficiency and reduce costs by an average of $847 per vehicle annually. More importantly, they make faster, data-driven decisions that keep them competitive in an increasingly demanding market. Yet despite these compelling benefits, over 60% of fleet managers still rely on gut feeling rather than concrete benchmarks when evaluating their performance.
Why Fleet Performance Benchmarking Matters in 2026
The fleet management landscape has transformed dramatically over the past few years. Rising fuel costs, driver shortages, stricter environmental regulations, and increasing customer expectations have created a perfect storm of challenges. In this environment, flying blind is no longer an option. Benchmarking provides the visibility you need to identify performance gaps, validate improvement initiatives, and justify budget decisions to stakeholders.
Consider this: when you know that the industry average for vehicle downtime is 8.2%, but your fleet is experiencing 12.5%, you have concrete evidence of a problem that demands attention. More importantly, you can research how top-performing fleets achieve just 4.7% downtime and implement their proven strategies. This is the power of benchmarking—it transforms vague concerns into actionable intelligence.
Industry Insight
Top-performing fleets don't just track metrics—they compare them against industry standards quarterly and adjust strategies accordingly. This continuous improvement cycle is what separates leaders from laggards.
Critical Fleet KPIs and 2026 Industry Benchmarks
Effective benchmarking starts with tracking the right metrics. While every fleet has unique characteristics, certain key performance indicators universally indicate operational health. Understanding current industry standards for these metrics gives you a baseline for meaningful comparison.
Cost Per Mile (CPM)
Vehicle Downtime
Maintenance Cost Ratio
Fuel Efficiency (MPG)
Cost per mile remains the most comprehensive single metric, encompassing fuel, maintenance, insurance, and depreciation. The 2026 industry average of $1.82 reflects increased fuel costs and parts inflation, but top-performing fleets maintain CPM below $1.56 through aggressive preventive maintenance and route optimization. If your CPM exceeds $2.00, you're likely bleeding money on inefficiencies that competitors have already addressed.
Vehicle downtime tells an equally important story. Every day a vehicle sits idle represents lost revenue and customer dissatisfaction. The industry average of 8.2% means that out of a 30-day month, your typical vehicle is unavailable for nearly 2.5 days. Top performers cut this almost in half through predictive maintenance and efficient parts management—strategies you can implement with the right tools and processes.
Benchmarking by Fleet Segment
One-size-fits-all benchmarks can be misleading because different fleet types face unique operational challenges. A last-mile delivery fleet operates under completely different constraints than a long-haul trucking operation. Meaningful benchmarking requires comparing apples to apples—your performance against similar operations in your specific segment.
Last-mile delivery fleets face the toughest operational environment with constant stop-and-go driving, minimal highway miles, and maximum wear on brakes and transmissions. If you're managing delivery vehicles, achieving 92% utilization should be your baseline goal, while maintenance intervals need to be more aggressive than other segments due to the punishing duty cycle.
Track Your Fleet Benchmarks Automatically
Oxmaint's analytics platform automatically calculates your key performance metrics and compares them against industry standards, giving you instant visibility into performance gaps and improvement opportunities.
Identifying and Closing Performance Gaps
Discovering that your metrics fall short of industry benchmarks is just the starting point. The real value comes from systematically identifying why gaps exist and implementing targeted strategies to close them. This requires looking beyond surface-level numbers to understand the underlying operational factors driving performance.
Start with your worst-performing metrics. If your vehicle downtime significantly exceeds the 8.2% industry average, drill into the root causes. Are you experiencing frequent breakdowns due to deferred maintenance? Is your parts inventory inadequate, causing extended repair times? Are specific vehicle makes or models driving your numbers down? Each of these questions points to different solutions—from implementing preventive maintenance schedules to optimizing your parts stocking strategy to reconsidering your vehicle acquisition decisions.
Identify the Gap
Compare your metrics to industry benchmarks and quantify the difference. Focus on gaps larger than 15% from the standard.
Analyze Root Causes
Dig into your data to understand why the gap exists. Look at vehicle age, maintenance practices, driver behavior, and operational patterns.
Implement Solutions
Deploy targeted improvements based on your analysis. Set specific, measurable goals with clear timelines.
Monitor Progress
Track your metrics monthly and adjust strategies as needed. Celebrate wins and course-correct quickly when initiatives underperform.
Consider fuel efficiency gaps. If your fleet averages 6.2 MPG while the industry standard is 6.8 MPG and top performers achieve 7.4 MPG, you have a significant opportunity. On a fleet of 50 vehicles each driving 30,000 miles annually, improving from 6.2 to 6.8 MPG saves approximately $72,000 per year at current diesel prices. That single improvement justifies significant investment in driver training, aerodynamic modifications, or route optimization technology.
Best Practices from Top-Performing Fleets
Studying what separates top-performing fleets from average operations reveals consistent patterns. These industry leaders don't achieve superior results through luck or massive budgets—they follow disciplined practices that any fleet can adopt.
Proactive Maintenance Culture
Top performers maintain a preventive-to-reactive maintenance ratio of 80:20, while average fleets sit at 60:40. They catch problems before breakdowns occur.
Data-Driven Decision Making
Leading fleets review performance dashboards daily and adjust operations based on trends, not hunches. They track 15-20 KPIs consistently.
Driver Engagement Programs
Elite operations invest in continuous driver training and incentivize safe, efficient driving behaviors. Driver turnover is 40% lower than industry average.
Continuous Improvement Mindset
Top fleets conduct quarterly performance reviews against benchmarks and implement improvement initiatives systematically, measuring results rigorously.
Technology Adoption
Leaders leverage telematics, predictive analytics, and automated workflows to eliminate inefficiencies. They view technology as an investment, not an expense.
Strategic Parts Management
High performers maintain optimal parts inventory levels—enough to prevent downtime without tying up excessive capital. Average parts availability exceeds 95%.
Perhaps most importantly, top-performing fleets treat benchmarking as an ongoing process, not a one-time exercise. They establish quarterly review cycles where leadership examines key metrics against industry standards, identifies emerging trends, and adjusts strategies accordingly. This disciplined approach ensures continuous improvement rather than sporadic firefighting.
Leveraging Technology for Competitive Benchmarking
Modern fleet management platforms have revolutionized benchmarking by automating data collection, calculation, and comparison. What once required spreadsheets, manual tracking, and extensive analysis now happens in real-time with minimal effort. This technological shift democratizes benchmarking, making sophisticated performance analysis accessible to fleets of all sizes.
The right technology platform automatically captures operational data from multiple sources—telematics systems, maintenance records, fuel cards, and driver logs—then calculates your key metrics and presents them alongside industry benchmarks. This gives you instant visibility into where you stand and alerts you when metrics drift outside acceptable ranges. More advanced systems use machine learning to identify performance patterns and recommend specific improvement actions based on what works for similar fleets.
Get Industry Benchmark Insights Instantly
Stop spending hours on spreadsheets. Oxmaint automatically tracks your fleet performance against industry standards and highlights improvement opportunities in real-time.
Creating Your Benchmarking Action Plan
Armed with industry benchmarks and an understanding of best practices, you're ready to develop a concrete action plan. Successful benchmarking initiatives follow a structured approach that moves from assessment through implementation to continuous monitoring.
Baseline Assessment (Week 1-2)
Root Cause Analysis (Week 3-4)
Strategy Development (Week 5-6)
Implementation & Monitoring (Ongoing)
Remember that closing performance gaps takes time. Set realistic expectations—a 3-6 month timeline for meaningful improvement is typical for most initiatives. The key is maintaining momentum through regular progress reviews and celebrating incremental wins along the way.
Common Benchmarking Mistakes to Avoid
Even with the best intentions, fleet managers often stumble into common benchmarking pitfalls that undermine their efforts. Being aware of these mistakes helps you avoid wasted time and frustration.
The most frequent error is comparing yourself to inappropriate peer groups. Benchmarking your urban delivery fleet against long-haul trucking operations produces meaningless comparisons because the operational environments are fundamentally different. Similarly, comparing brand-new vehicles to aging equipment skews results. Always ensure you're making apples-to-apples comparisons based on fleet type, vehicle age, and operational characteristics.
Comparing different fleet types or operational profiles leads to meaningless benchmarks and misguided improvement efforts.
Tracking 50 KPIs overwhelms your team. Focus on 8-12 critical metrics that truly drive performance in your operation.
Sporadic data collection creates gaps that invalidate trend analysis. Establish regular, automated capture processes.
Identifying gaps without implementing improvements wastes effort. Always couple benchmarking with concrete action items.
Raw numbers without considering seasonal factors, route changes, or fleet composition shifts can lead to false conclusions.
Waiting for perfect data before taking action delays improvements. Start with what you have and refine as you go.
Another common mistake is tracking too many metrics without prioritizing what truly matters. While comprehensive data is valuable, focusing your improvement efforts on the vital few metrics that drive business results produces better outcomes than spreading resources across dozens of marginally important KPIs. Start with cost per mile, downtime percentage, and fuel efficiency—these three alone capture most of your operational effectiveness.
Start Benchmarking Your Fleet Performance Today
Join thousands of fleet managers using Oxmaint to track performance metrics, compare against industry standards, and implement data-driven improvements that deliver measurable results.
Frequently Asked Questions
What are the most important fleet performance benchmarks to track
The critical metrics include cost per mile (CPM), vehicle downtime percentage, maintenance cost ratio, fuel efficiency (MPG), vehicle utilization rate, preventive maintenance compliance, and mean time between failures. These KPIs provide comprehensive visibility into operational efficiency, cost management, and asset reliability across your fleet.
How often should fleet managers conduct performance benchmarking
Leading fleets review key metrics weekly for operational adjustments and conduct comprehensive benchmark comparisons quarterly against industry standards. Annual deep-dive analyses help with strategic planning and budget forecasting. The key is establishing consistent review cadences rather than sporadic assessments.
What is considered good fleet performance in 2026
Top-performing fleets in 2026 achieve cost per mile below $1.70, vehicle downtime under 6.5%, maintenance cost ratios below 11% of total operating costs, and fuel efficiency above 7.0 MPG for medium-duty trucks. However, specific benchmarks vary by fleet segment and operational characteristics.
How can small fleets compete with larger operations in benchmarking
Modern fleet management technology has leveled the playing field by automating data collection and analysis that once required dedicated staff. Small fleets can achieve competitive performance by focusing on high-impact improvements, leveraging technology platforms, and participating in industry peer groups for benchmark data sharing.
What role does technology play in fleet performance benchmarking
Technology platforms automate metric calculation, provide real-time performance dashboards, compare your data against industry standards, and identify improvement opportunities. Advanced systems use predictive analytics to forecast trends and recommend specific actions based on successful patterns from similar fleets.
How long does it take to see improvements from benchmarking initiatives
Quick wins like improved route planning or driver behavior coaching can show results within 4-6 weeks. More substantial improvements such as preventive maintenance program implementation typically demonstrate measurable impact within 3-6 months. The key is setting realistic timelines and tracking progress consistently.