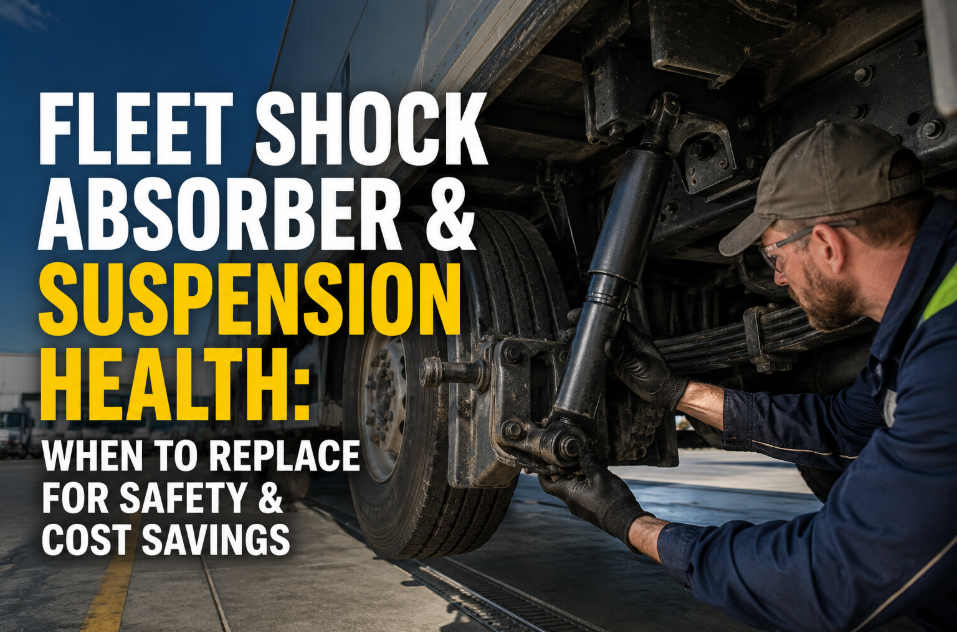
Suspension systems are the silent infrastructure of every fleet vehicle — rarely inspected until a driver complains about ride quality or a tire wears unevenly, and by then the damage to tires, brakes, steering components, and cargo is already done. Worn shock absorbers increase stopping distances by up to 20% at highway speeds, accelerate tire wear by 30%, and transfer excess stress into chassis and cab components that cost far more to replace than a pair of shocks. For commercial fleets operating heavy payloads across mixed terrain, the economics are stark: a $400 shock absorber replacement deferred for six months creates $1,800 in tire wear, $600 in brake accelerated wear, and potential liability exposure in a rear-end collision where stopping distance evidence is reviewed. Most fleet maintenance programs still treat suspension as a reactive category — shocks get replaced when drivers complain or when tires show cupping wear severe enough to be visible at the bay door. Oxmaint changes this by tracking suspension health as a scheduled PM asset, not an afterthought. Want to see how automated suspension PM scheduling works across your vehicle classes? Start a free trial or book a demo and let us show you how condition-triggered PM reduces your total suspension maintenance cost.
FLEET SUSPENSION · SHOCK ABSORBERS · CMMS TRACKING · SAFETY COMPLIANCE
Fleet Shock Absorber & Suspension Health: When to Replace for Safety & Cost Savings
Worn shocks increase stopping distance by 20%, tire wear by 30%, and transfer hidden damage into steering and chassis components. Learn the replacement indicators, testing methods, and how CMMS-tracked suspension PM protects your fleet budget and driver safety.
20%
Longer stopping distance with worn shocks at highway speed
NHTSA road test data — equivalent to one full car length at 60 mph
30%
Faster tire wear when shock absorbers are degraded
Uncontrolled wheel bounce transfers wear unevenly across tread
50K
Miles — typical shock replacement interval for commercial vehicles
Heavy-payload and off-road routes reduce this to 30–40K
4.8x
Cost multiplier — reactive suspension repairs vs scheduled replacement
Secondary damage to tires, steering, and chassis compounds rapidly
Suspension Failure Is Not a Comfort Issue — It Is a Safety and Budget Issue
Fleet managers who treat shock absorbers as a comfort upgrade rather than a safety-critical component consistently absorb their real cost through tire replacement budgets, brake pad acceleration, and driver incident reports. A structured CMMS-managed suspension PM program eliminates the reactive discovery cycle. Oxmaint tracks mileage-based suspension intervals per vehicle, generates PM work orders automatically, and links suspension findings to tire wear records for full cost visibility. Start a free trial or book a demo to see suspension tracking in action for your fleet.
Core Concepts
What Shock Absorbers Actually Do in a Commercial Fleet Vehicle
Shock absorbers — and their integrated counterpart, struts — control wheel motion by dampening the oscillation that occurs when a wheel hits a road irregularity. In a commercial vehicle, this function is not about ride comfort: it directly affects braking performance, steering response, tire contact patch consistency, and the load stress transmitted into the vehicle frame. When damping degrades, every other safety and cost system in the vehicle pays a secondary price.
01
Wheel Contact Control
Worn shocks allow wheels to bounce and skip across road surfaces — reducing tire contact patch consistency and creating uneven wear patterns that destroy tires in 60–70% of their expected service life.
02
Braking Distance Management
Effective braking requires consistent tire-to-road contact. Degraded shock damping causes wheel skip during braking — extending stopping distances up to 20% at 60 mph, a critical safety margin in emergency situations.
03
Steering Stability
Front shock and strut degradation causes steering wander, shimmy at highway speed, and delayed response to driver inputs — increasing accident risk and driver fatigue on long-haul routes.
04
Frame and Component Load Transfer
Without effective damping, road impact forces transmit directly into chassis welds, steering linkages, wheel bearings, and cargo securing points — creating hidden structural fatigue that manifests as expensive secondary failures months later.
05
Payload Stability
For payload-carrying vehicles, suspension degradation causes cargo shift, liquid surge in tankers, and increased restraint stress — with direct implications for load securement compliance under FMCSA regulations.
06
Air Suspension System Interaction
On vehicles with air suspension, worn shock absorbers cause air bags to work harder maintaining ride height — accelerating air spring degradation and compressor wear at a cost of $800–$2,400 per air spring replacement.
Replacement Indicators
Eight Indicators That Fleet Shock Absorbers Need Replacement Now
These indicators represent observable evidence of degraded damping performance — not subjective ride complaints. Each one carries measurable cost and safety implications when left unaddressed. Any two simultaneously present justify immediate replacement scheduling, regardless of mileage position.
Safety-Critical
Extended Stopping Distance
Driver-reported brake fade or delayed stop — verify with loaded brake test. Stopping distance exceeding OEM specification by more than 10% requires immediate shock inspection.
Safety-Critical
Steering Wander or Shimmy
Highway-speed steering instability or shimmy above 55 mph indicates front suspension damping loss. Particularly dangerous on multi-lane highway operations and in crosswind conditions.
Cost-Critical
Cupped or Scalloped Tire Wear
Diagonal wear patches across the tire tread indicate wheel bounce from inadequate damping. By the time cupping is visible, the tire has lost 30–40% of its remaining service life — quantifiable direct cost.
Cost-Critical
Oil Leakage from Shock Body
Hydraulic fluid seepage on the shock body indicates seal failure. A leaking shock loses damping capacity progressively — a vehicle with visibly leaking shocks has already degraded past acceptable performance thresholds.
Cost-Critical
Nose Dive Under Braking
Excessive front-end dip during normal braking indicates front shock wear. On loaded commercial vehicles, nose dive shifts weight distribution in ways that reduce rear wheel traction during the same braking event.
Cost-Critical
Body Roll in Turns
Excessive lateral body movement in cornering indicates both shock and potentially anti-roll bar link degradation. On high-center-of-gravity vehicles (box trucks, vans), this raises rollover risk on curved highway ramps.
Maintenance Indicator
Mileage-Based Interval Reached
50,000 miles for standard commercial duty; 30,000–40,000 miles for heavy payload, off-road, or municipal route vehicles. Interval-based replacement prevents the reactive discovery cycle entirely.
Maintenance Indicator
Bounce Test Failure
The standard bounce test: push down on each corner of the vehicle and release. A healthy shock stops movement within 1–2 oscillations. More than 2 bounces indicates inadequate damping and triggers replacement evaluation.
Testing Methods
Suspension Health Testing Methods for Fleet Technicians
01
Loaded Bounce Test
Test the vehicle at its normal operating payload. Push down firmly on each corner and release — count oscillations. Empty bounce tests on cargo vehicles understate actual damping degradation because payload compresses the shock travel range significantly. Document results per corner, per vehicle.
02
Road Load Dynamic Test
Controlled road test over a consistent rough surface (expansion joints, washboard section) at 35 mph. Driver records observation of wheel skip, body oscillation, and steering response. Standardized route eliminates subjective variation between drivers and creates comparable data across inspection cycles.
03
Lift Bay Visual Inspection
With vehicle on lift: check shock body for oil film or fluid accumulation, inspect mounting bushings for cracking or collapse, measure shock travel range against OEM specification, examine upper strut mount bearing for roughness or play. Document findings with photos linked to the vehicle asset record in CMMS.
04
Brake Distance Benchmark Test
On a safe, controlled surface: full brake application from 30 mph, measure stopping distance against the vehicle's baseline measurement from last PM. A 15% or greater increase in stopping distance with the same brake system condition is diagnostic evidence of shock degradation — document as a safety finding requiring immediate action.
How Oxmaint Tracks Suspension Health Across Your Fleet
Oxmaint manages fleet suspension as a scheduled maintenance asset — not an ad hoc repair category. Every vehicle carries its own shock absorber PM interval, inspection history, and tire wear correlation record. When mileage thresholds trigger, work orders generate automatically. When inspection findings identify early degradation, corrective actions link directly to the vehicle's maintenance record and cost tracking. Fleet managers ready to put suspension on a PM schedule can start a free trial or book a demo to see suspension tracking configured for their vehicle classes.
Asset Registry
Suspension as a Tracked Asset Per Vehicle
Each vehicle's shock absorber set is registered as a component-level asset with installation date, mileage at installation, OEM specification, and replacement threshold. Oxmaint tracks consumed life continuously as telematics or manual mileage entries update the asset record.
PM Scheduling
Mileage-Triggered Shock Replacement Work Orders
Configure replacement intervals by vehicle class — 50K for standard duty, 35K for heavy payload routes, 30K for off-road or municipal vehicles. Oxmaint auto-generates the PM work order at the configured threshold, eliminating calendar-based manual tracking that misses high-utilization vehicles.
Inspection Checklists
Digital Suspension Inspection with Photo Documentation
Technicians complete digital suspension inspection checklists on mobile — bounce test result, visual shock body condition, bushing inspection, and brake distance benchmark — with photo attachment and digital sign-off. Each completed inspection is timestamped and linked to the vehicle's maintenance history permanently.
Tire Correlation
Link Suspension Findings to Tire Wear Records
When a suspension inspection flags abnormal tire wear, Oxmaint links the finding to the tire asset record — creating a documented causal chain between suspension degradation and accelerated tire cost. This correlation data supports capital justification for systematic suspension PM investment.
Cost Tracking
Total Suspension Cost Per Vehicle, Per Fleet
Track parts cost, labor hours, and secondary damage costs (tires, alignment, steering components) against each vehicle's suspension maintenance record. Fleet managers see total suspension cost per vehicle per year — enabling data-driven replacement vs retire decisions at the individual unit level.
Compliance Records
DOT-Ready Suspension Maintenance Documentation
Every suspension inspection, replacement, and safety finding is stored with technician ID, date, mileage, and parts record. In a DOT roadside inspection or post-accident review, the complete suspension maintenance history is retrievable in minutes — not reconstructed from paper files.
Before vs After
Reactive vs Scheduled Suspension Management: Real Cost Difference
Reactive Suspension Program
Shocks replaced when drivers report ride quality issues
Tire cupping identified at 40% remaining tread — tires replaced early
No mileage tracking per vehicle — interval guessed at bay
Brake distance degradation discovered during incident investigation
Secondary steering and alignment damage discovered at next service
No documentation trail for DOT or insurance review
Oxmaint CMMS Suspension Program
Mileage-triggered PM work order generated automatically per vehicle
Tire wear linked to suspension record — causal chain documented
Interval configured by vehicle class, updated from telematics or odometer
Brake distance benchmark tracked at each inspection — trend visible
Secondary damage findings linked to originating suspension inspection
Full digital maintenance record retrievable in 60 seconds per vehicle
Suspension PM Program Results — What Fleets Report
30%
Tire Life Extension
Fleets managing suspension on scheduled PM intervals report 25–35% longer average tire service life versus reactive shock replacement programs
$1,400
Avg. Secondary Damage Avoided Per Vehicle
Alignment, steering component, and tire replacement costs deferred when suspension degradation is caught at the PM interval rather than at failure
20%
Braking Distance Restored
Fleet safety benchmarks show stopping distance returning to OEM specification within 5% after systematic shock replacement at mileage threshold
100%
Audit-Ready Suspension Records
Every inspection, replacement, and safety finding is permanently recorded — no paper reconstruction required for DOT or insurance review after an incident
Questions
Frequently Asked Questions
What is the correct shock absorber replacement interval for heavy-duty commercial fleet vehicles?+
Standard shock absorber replacement intervals for commercial vehicles range from 30,000 to 50,000 miles depending on vehicle class, payload, and route characteristics. Light commercial vehicles (cargo vans, pickup-based service trucks) on paved routes typically reach 50,000 miles before degradation becomes measurable. Heavy-duty vehicles (box trucks, flatbeds, dump trucks) operating with regular maximum payload on mixed or unpaved surfaces degrade significantly faster — 30,000 to 35,000 miles is a more appropriate threshold. Municipal and utility fleet vehicles with frequent pothole and rough terrain exposure should be evaluated at 25,000 to 30,000 miles. Oxmaint allows each vehicle to carry a class-specific mileage threshold — meaning a mixed fleet is managed at the correct interval for each unit rather than a one-size average that over-serves light vehicles and under-serves heavy ones.
How do I connect suspension degradation to my tire replacement cost data to build a business case for PM investment?+
The linkage is straightforward when both suspension and tire records exist in the same CMMS. In Oxmaint, the approach is: tag each tire replacement work order with the condition finding that prompted it (cupped wear, uneven wear, early replacement) and the vehicle's shock absorber mileage position at the time of replacement. Over 6 to 12 months, vehicles where shocks were within their PM interval at tire replacement will show consistently longer tire service life than vehicles where shocks were overdue. The cost delta between these two groups — calculated per vehicle class — is your business case ROI figure for the suspension PM program investment. This data is already in your Oxmaint work order history; the analysis is a standard cost-by-finding report filtered by component type.
Can Oxmaint track suspension PM across a mixed fleet with different vehicle classes and OEM specifications?+
Yes. Oxmaint's asset hierarchy allows each vehicle to carry its own PM schedule with class-specific mileage thresholds, OEM part numbers, and inspection checklist variants. A fleet with light vans, medium-duty box trucks, and heavy-duty flatbeds would configure three separate suspension PM templates — each with its own interval, inspection checklist, and parts specification. When a PM work order is generated, it includes the correct parts list and inspection procedure for that specific vehicle class. Mixed fleet managers find this particularly valuable because it eliminates the single-interval approximation that either wastes money on premature light-vehicle replacement or misses degradation on heavy-duty units.
What documentation should fleet managers maintain for suspension maintenance to protect against post-accident liability?+
Post-accident litigation and DOT investigations will examine suspension maintenance records for the involved vehicle covering the prior 12 to 24 months. Documentation that protects the fleet operator includes: dated inspection records with technician identification at each service interval, any findings of degradation with the corresponding corrective action work order and completion date, mileage at each shock replacement with parts provenance, and the vehicle's PM compliance history showing that scheduled inspections were completed on time. Gaps in inspection records, inspection records without technician sign-off, or evidence that a reported finding was not corrected before the accident are the three documentation failures that create the most significant liability exposure. Oxmaint generates all of this documentation automatically from completed work orders — the complete record is retrievable per vehicle in under 60 seconds.
Put Your Fleet Suspension on a Scheduled PM Program — Starting This Week
Shock absorber degradation costs your fleet in three places simultaneously: tires, braking distance, and secondary component damage. A mileage-based PM program managed in Oxmaint eliminates reactive discovery, creates the audit trail that protects you after incidents, and reduces total suspension-related cost per vehicle per year. No implementation project required — configure your first suspension PM template and generate your first work orders in the same session.