Fleet MTBF — mean time between failures — is the single most reliable indicator of how maturely your maintenance program is run, because every additional hour a vehicle operates between breakdowns translates directly into recovered uptime, lower repair cost, and extended asset life. Improving fleet MTBF requires disciplined measurement per asset class, root-cause analysis that goes beyond symptom-fixing, and a preventive maintenance workflow that adjusts intervals based on actual failure data rather than calendar guesses. The challenge most fleet reliability engineers face is that MTBF data is scattered across paper work orders, spreadsheet logs, and technician memory — making it nearly impossible to track trends or prove improvement. OxMaint's AI-powered CMMS solves this by centralizing work-order history, asset performance data, and failure codes into one analytics platform that turns fleet MTBF from a lagging KPI into a working improvement lever. You can Start Free Trial today or book a demo to see the dashboards live on your own asset data.
Every extra hour between failures is measurable profit. Is your fleet leaking uptime?
Most fleet operators can't calculate MTBF by asset class because failure data lives in paper logs and technician heads. OxMaint automates fleet MTBF measurement, surfaces failure patterns, and drives PM optimization — so vehicles run longer between the breakdowns that cause downtime.
What is fleet MTBF and why does it matter?
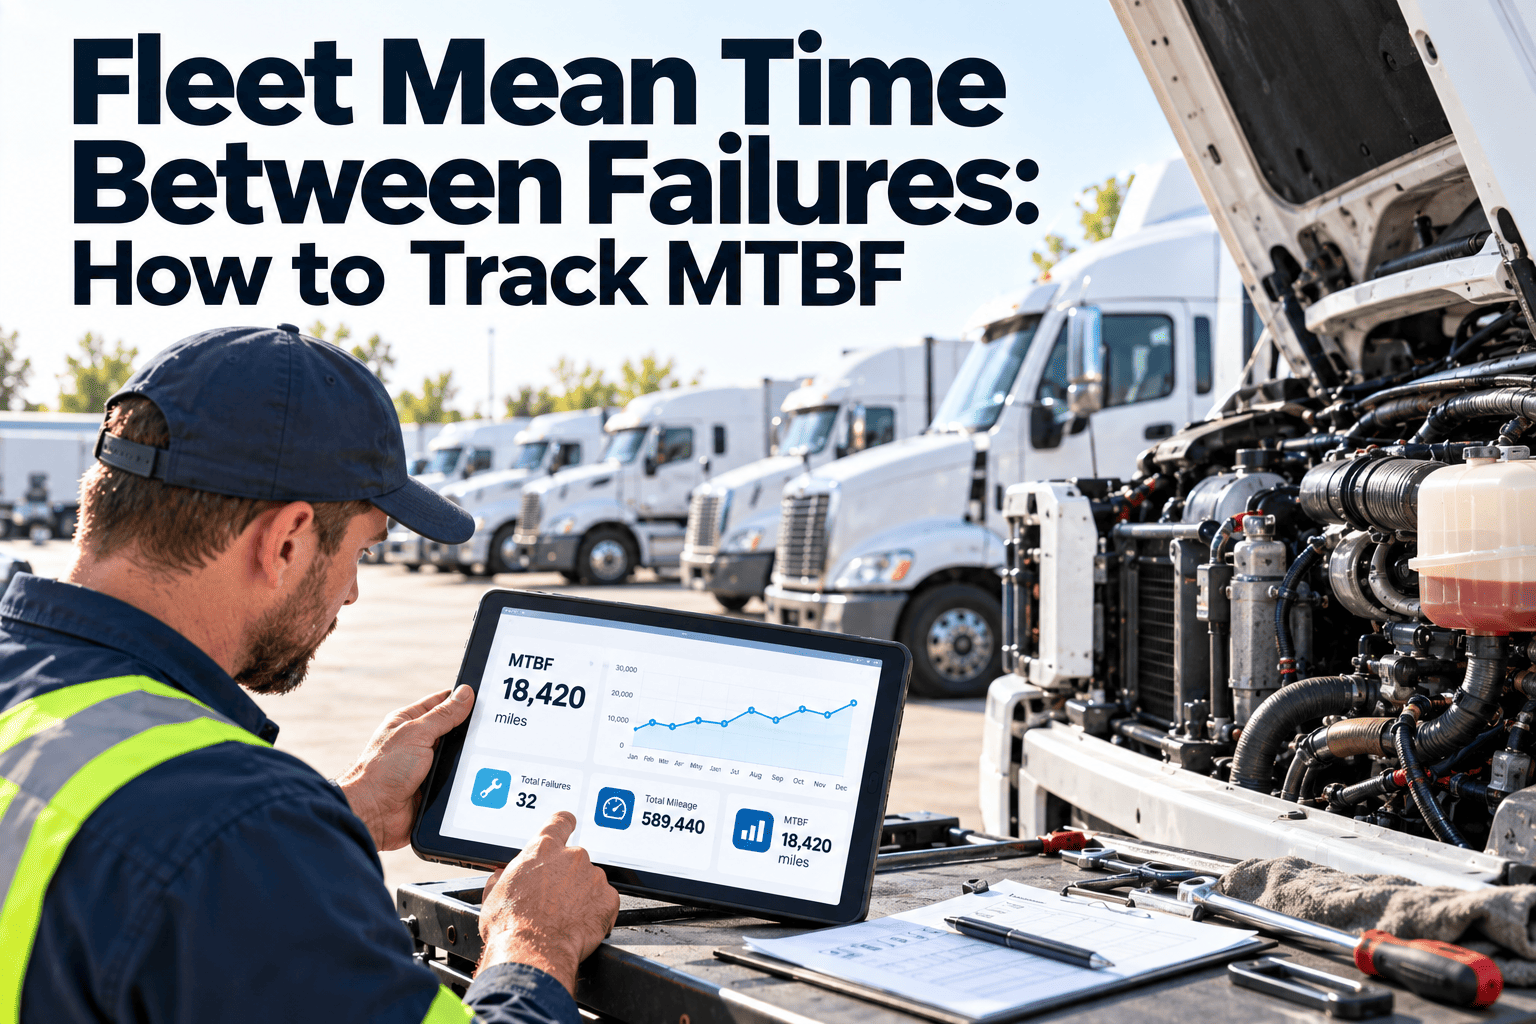
Fleet mean time between failures measures the average operating hours a vehicle accumulates before experiencing a functional failure that removes it from service. It is the foundational fleet reliability metric because it captures both the frequency of failures and the effectiveness of your preventive maintenance program in a single number. A fleet with a rising MTBF trend is one where PM intervals are well-tuned, failure codes are disciplined, and root-cause analysis is driving permanent fixes rather than repeat repairs.
Example: A delivery van logs 2,800 operating hours across a quarter and experiences 4 failures that took it out of service. MTBF = 2,800 ÷ 4 = 700 hours between failures. Track this per asset class — Class 8 tractors, light-duty vans, refrigerated trailers — not just fleet-wide, because aggregation hides the problem units dragging your average down.
How to improve fleet MTBF: a 5-step reliability framework
Fleet MTBF improvement is not a one-time project — it is a closed-loop cycle of measurement, analysis, and PM adjustment. The five steps below mirror the ISO 55000 asset-management discipline that top-performing fleet operators follow to push failure intervals past industry benchmarks.
Establish per-asset-class MTBF baseline
Pull 12 months of work-order history and separate failures (breakdowns that stopped the vehicle) from routine PM and minor defects. Calculate MTBF for each asset class so you have a defensible starting number — most fleets discover their actual MTBF is 15–25% lower than leadership assumes.
Standardize failure codes and severity levels
If technicians write "engine problem" on 40% of work orders, you cannot analyze anything. Deploy a structured failure-code taxonomy — SAE J1452 or a custom hierarchy covering system, subsystem, component, and failure mode. OxMaint enforces these codes at work-order closeout so data quality is built into the workflow.
Run root-cause analysis on repeat failures
Identify the 10% of assets consuming 40% of repair hours — the "bad actors." For each, ask whether the failure is a maintenance issue (wrong PM interval), an operations issue (driver abuse, overloading), or a design/spec issue (wrong equipment for the route). OxMaint's analytics automatically flag assets whose failure frequency deviates from the class mean.
Adjust PM intervals based on failure data
If a component fails at 400 hours and your PM inspects it at 500 hours, the interval is too long. If it is inspected at 250 hours and never fails, you are over-maintaining. Use Weibull analysis or simple failure-rate curves to right-size PM intervals — OxMaint tracks failure distribution per component so you can shift from time-based to condition-based PM.
Monitor MTBF trend and close the loop
Review fleet MTBF monthly by asset class. A rising trend validates your PM changes; a flat or declining trend means a root cause was missed. OxMaint auto-generates MTBF dashboards so reliability engineers spend time fixing problems, not building spreadsheets.
Fleet MTBF benchmarks by asset class
Benchmarks give you a target, but context matters — route severity, climate, load profiles, and age distribution all shift the curve. Use these ranges as a sanity check against your own MTBF measurements, then focus on the gap between your worst-performing quartile and your best.
| Asset Class | Typical MTBF (operating hours) | Top-Quartile MTBF | Most Common Failure Mode |
|---|---|---|---|
| Class 8 Tractor | 450–650 hrs | 800+ hrs | Aftertreatment / DPF system |
| Light-Duty Van | 300–500 hrs | 650+ hrs | Brake system / suspension |
| Refrigerated Trailer | 200–400 hrs | 550+ hrs | Reefer unit compressor |
| Dump Truck / Vocational | 250–450 hrs | 600+ hrs | Hydraulic system / PTO |
| Transit Bus | 350–550 hrs | 700+ hrs | Door system / HVAC |
Fleet MTBF analysis in action: a 180-vehicle regional fleet
Consider a regional delivery fleet of 180 assets — 120 Class 8 tractors and 60 light-duty vans — spending roughly $42K per month on unplanned repairs and road calls. Their baseline MTBF was 420 hours for tractors and 310 hours for vans, both below the benchmark median. After implementing OxMaint, here is what changed over six months:
The biggest contributor was not new equipment or extra technicians — it was enforcing failure codes at closeout, which revealed that 38% of tractor failures traced to a single aftertreatment sensor that was being replaced reactively instead of at a 300-hour PM interval. OxMaint flagged the pattern in the failure-code analytics dashboard within the first month. That is the power of turning MTBF from a KPI you report into a lever you pull.
How OxMaint helps improve fleet MTBF
OxMaint is built for maintenance and reliability teams who are tired of managing fleet performance in spreadsheets and paper work orders. Every capability below maps directly to a step in the MTBF improvement framework — so the software does not just measure the metric, it actively drives it upward.
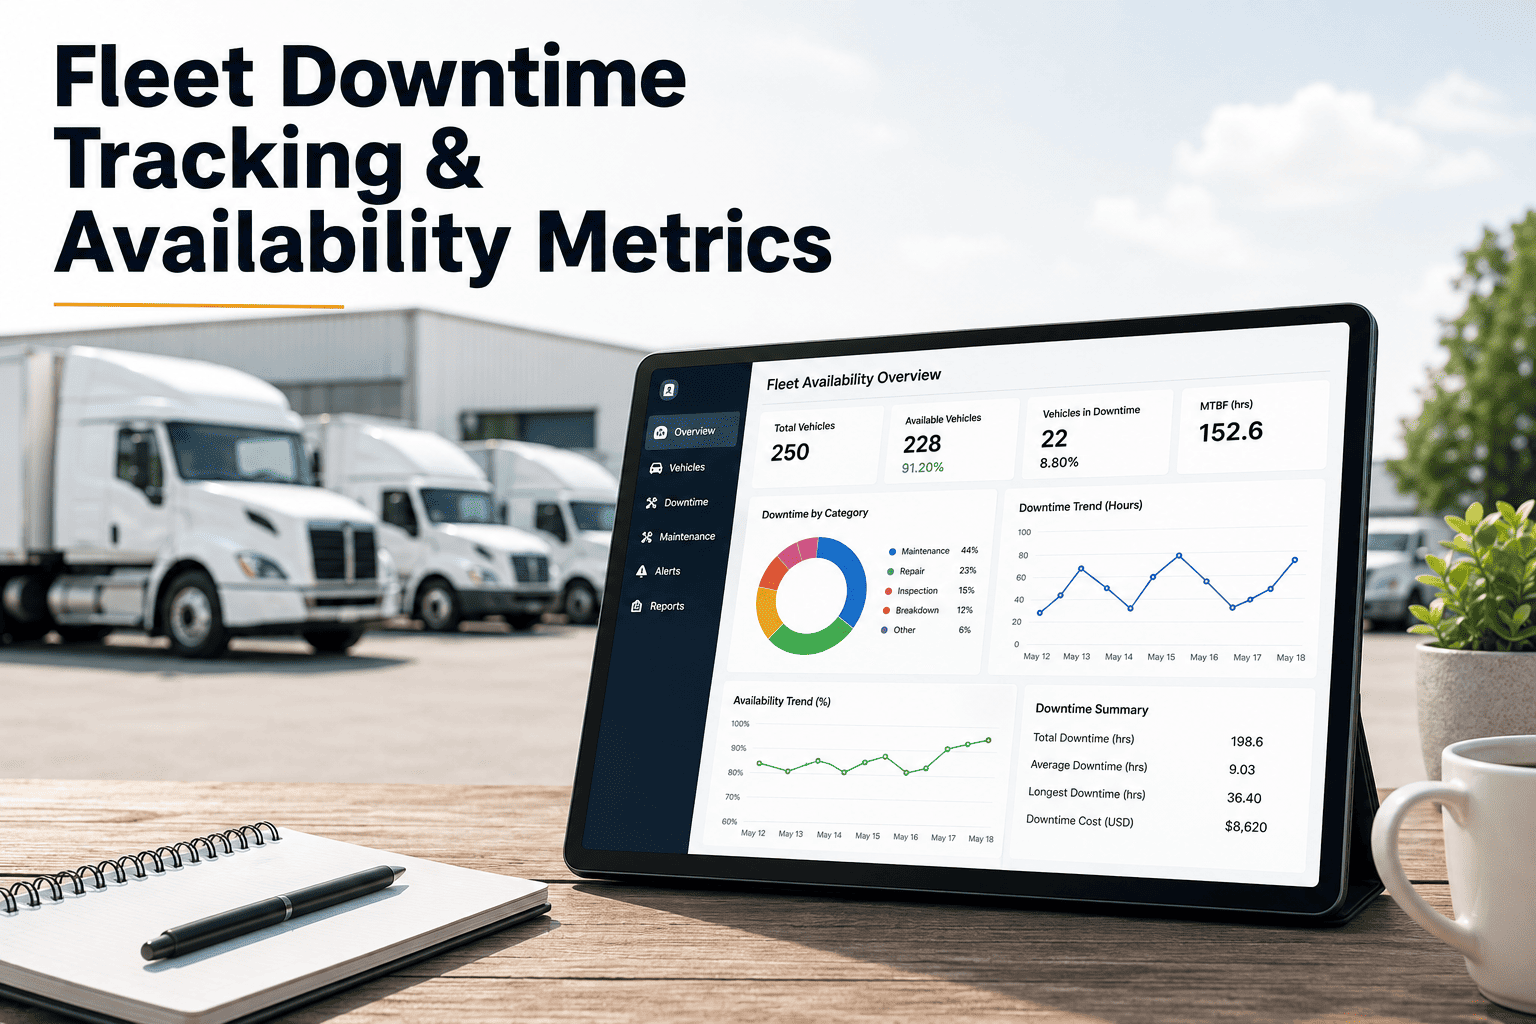
MTBF dashboards by asset class
Auto-calculated MTBF, MTTR, and failure-frequency trends segmented by vehicle type, route, or individual asset — updated in real time as work orders close. No spreadsheets, no manual exports.
Cut MTBF reporting time from days to secondsEnforced failure-code taxonomy
Customizable failure-code hierarchies enforced at work-order closeout — technicians cannot save without selecting a system, subsystem, and failure mode. Clean data is the foundation of MTBF analysis.
Eliminate "engine problem" work orders foreverPM optimization workflow
Compare failure intervals against PM intervals side-by-side. OxMaint flags over-maintained assets (wasted labor) and under-maintained assets (breakdown risk) so you right-size every PM schedule.
Reduce unplanned downtime 30–50%Bad-actor detection
AI-powered analytics automatically flag assets whose failure frequency deviates from the class mean — so reliability engineers know exactly which units to investigate without mining reports.
Find the 10% of assets causing 40% of downtimeSee how OxMaint tracks and improves fleet MTBF on your assets
Book a 30-minute demo and we will load a sample of your work-order history to show your baseline MTBF, failure-code gaps, and the PM optimizations with the highest payback.
Fleet MTBF: frequently asked questions
What is a good fleet MTBF?
A good fleet MTBF depends on asset class and duty cycle, but top-quartile fleets typically achieve 600–800+ operating hours between failures for Class 8 tractors and 500+ hours for light-duty vans. The more important benchmark is your own trend — if MTBF is rising quarter over quarter, your reliability program is working. You can track this automatically in OxMaint's MTBF dashboard, or Start Free Trial to see your baseline in minutes.
How is fleet MTBF different from MTTR?
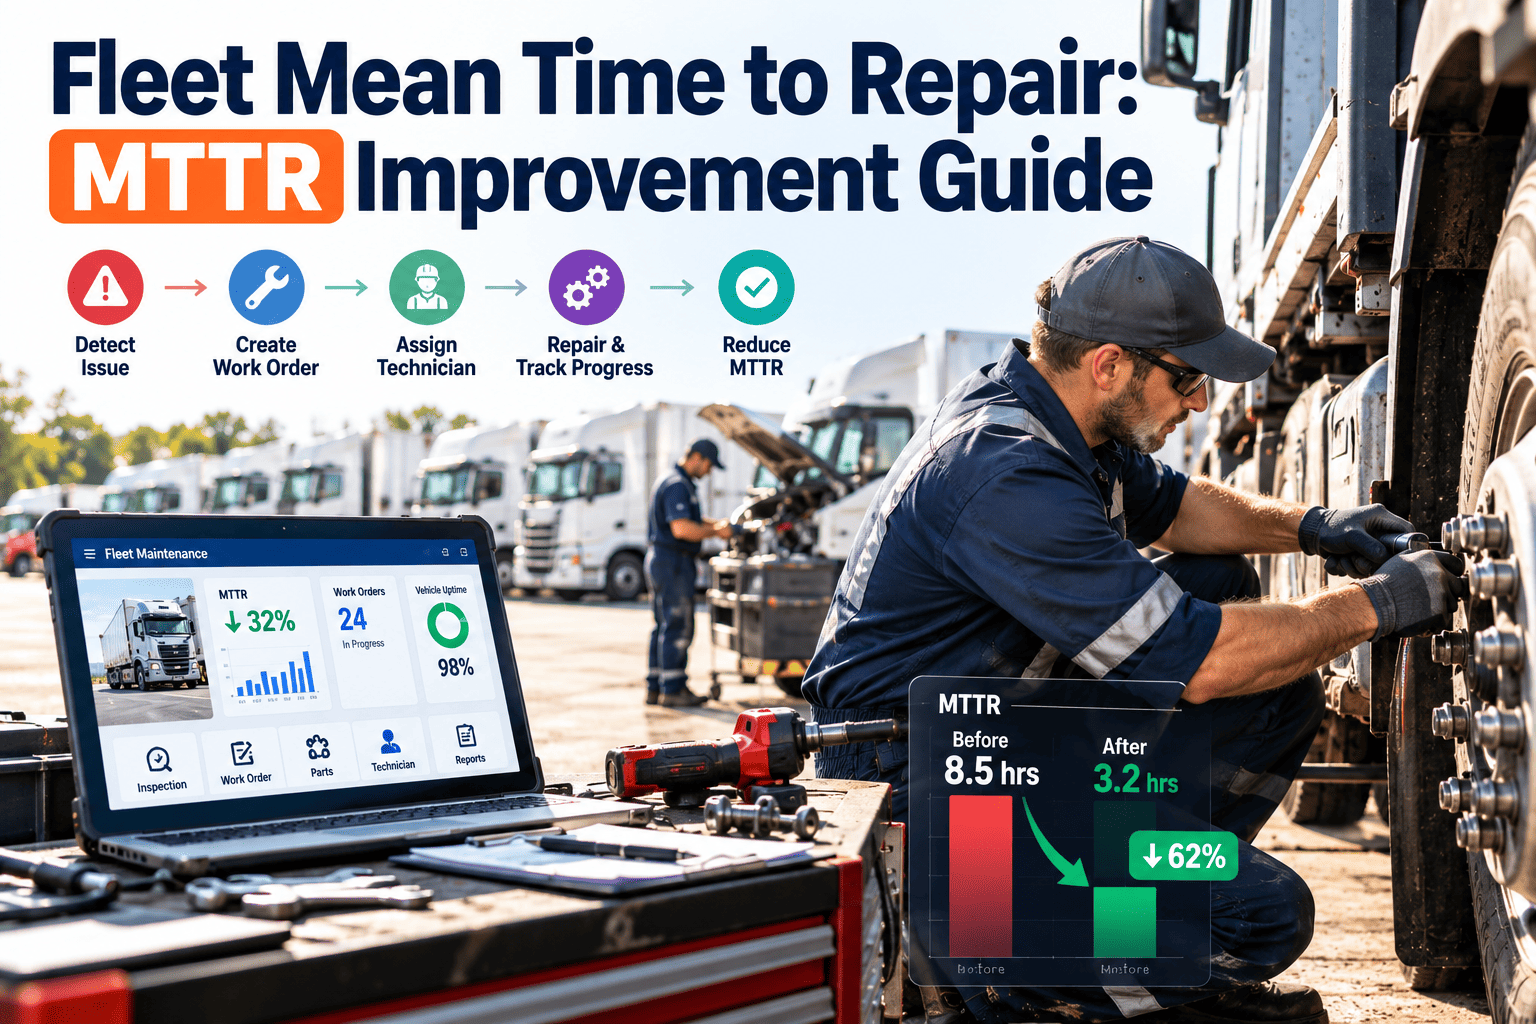
MTBF (mean time between failures) measures how long an asset runs before it breaks down — it reflects the effectiveness of your preventive maintenance. MTTR (mean time to repair) measures how quickly you get it back in service after a failure — it reflects wrench-time efficiency and parts availability. Improving MTBF reduces how often failures happen; improving MTTR reduces the damage when they do. Both metrics should be tracked together in your CMMS.
How often should I track fleet MTBF?
Track fleet MTBF monthly by asset class, not fleet-wide. Monthly granularity captures enough failure events to be statistically meaningful while being frequent enough to catch a declining trend before it becomes a major problem. Annual reviews are too slow — a bad-actor asset can accumulate six figures in unplanned repair cost in a quarter before an annual review catches it.
Can fleet MTBF be too high?
Yes — an artificially high MTBF can indicate over-maintenance, where you are spending more on preventive inspections and parts replacements than the failures would have cost. This is why MTBF should never be optimized in isolation; always pair it with maintenance cost per mile and PM-to-reactive labor ratio. OxMaint's PM optimization module flags over-maintained assets so you can extend intervals without increasing risk.
What is the fastest way to improve fleet MTBF?
The fastest lever is enforcing standardized failure codes at work-order closeout, because without clean failure data you cannot identify repeat failures or bad actors. Most fleets see a 15–25% MTBF improvement within 90 days of deploying a CMMS with enforced failure coding and PM interval optimization. Book a demo at Calendly to see the workflow on your data.
Stop guessing at fleet reliability. Start measuring it.
OxMaint turns your work-order data into MTBF trends, failure-pattern alerts, and PM optimizations that add hours between breakdowns. Deploy in days, not months — no migration fees, no credit card to start.
Free 14-day trial · No credit card