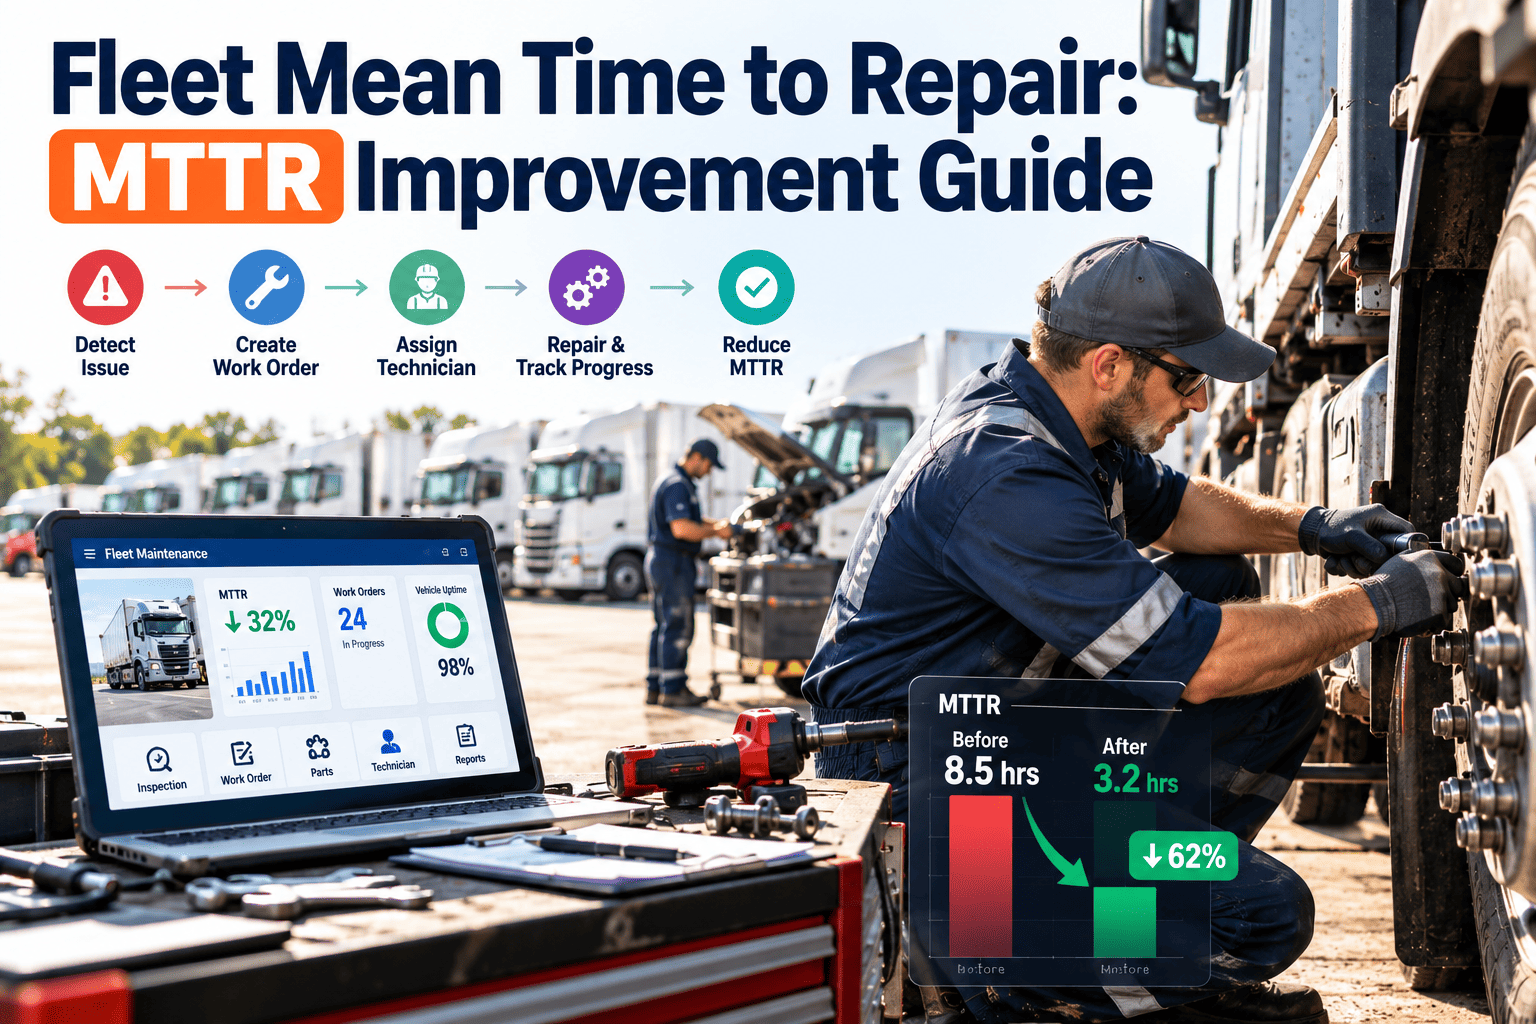
Mean time to repair tells a fleet how long a vehicle stays unavailable once something breaks, yet many teams track it loosely or not at all. The number moves with diagnosis speed, parts availability, bay scheduling, and the quality of the repair record, not just technician skill. This guide shows how to define MTTR properly, split it into the stages where time disappears, and improve each stage with a repeatable workflow. If your fleet still runs on spreadsheets and phone calls, you can see how Oxmaint structures fleet work orders before changing anything.
Fleet Mean Time to Repair: An MTTR Improvement Guide for Maintenance Teams
Find where the repair clock actually runs, remove the waiting between steps, and measure the result with work order data your shop already creates.
What Fleet MTTR Actually Measures
MTTR is the average time needed to restore a failed vehicle to service, found by dividing total repair time by the number of repairs in a period. A lower figure means vehicles return to work sooner and the shop is running more efficiently.
A Worked Example With Illustrative Numbers
The figures above are an arithmetic illustration, not a benchmark. Your own acceptable range depends on vehicle type, repair mix, and whether you repair in-house or send work to vendors.
Four Things People Call MTTR
| Term | Clock starts | Clock stops | Best used for |
|---|---|---|---|
| Mean time to repair | Hands-on work begins | Vehicle is working again | Technician and task efficiency |
| Mean time to recovery | Failure is first discovered | Vehicle returns to service | Availability seen by operations |
| Mean time to respond | Defect or alert is raised | Repair starts | Dispatch and triage speed |
| Mean time between failures | Vehicle returns to service | Next failure occurs | Reliability and PM effectiveness |
Pick One Definition and Keep It
Fleets get misleading trends when one shop counts only wrench time and another counts the whole outage. Decide whether repair time means hands-on work or the full period out of service, then apply that rule to every work order. For fleet availability, the full-outage view is usually the one operations cares about.
The Six Stages Inside Every Repair
Why Fleet MTTR Stays High
Most high repair times trace back to waiting, not to slow hands. The planning view below sorts common causes by how much time they tend to cost and how quickly a fleet can act on them. Adjust the placement once your own work order data is available.
- Parts not stocked for common failures
- Defects reported late or without detail
- Repairs not prioritized by operational need
- Recurring failures from weak preventive maintenance
- Knowledge held by a few senior technicians
- Vendor repairs with no turnaround tracking
- Missing sign-off and release steps
- Unclear work order descriptions
- No standard task list per repair type
- Bay layout and tool access
- Technician skill gaps on newer models
- Inconsistent asset records across depots
See Every Repair Stage Timestamped in One Work Order
Oxmaint gives fleet shops a single record from reported defect to released vehicle, so waiting time becomes visible and fixable.
Seven Levers That Reduce Fleet MTTR
A Reactive Shop Compared With a Tracked One
- Defects reported by phone or paper and re-typed later
- Diagnosis starts from zero on every visit
- Parts are chased only after the vehicle is in the bay
- Priority is decided by whoever shouts loudest
- Close-out is partial, so MTTR cannot be trusted
- Inspection defects become work orders automatically
- Asset history is visible before diagnosis begins
- Parts availability is checked when the order is created
- Priority follows defined rules and operational need
- Every stage is timestamped, so delay has an owner
Where Oxmaint Fits in the MTTR Workflow
A maintenance-first CMMS does not repair vehicles faster by itself. It removes the waiting and the missing information around the repair, and it records each stage so the delay can be measured.
| Repair stage | Oxmaint workflow | Record produced |
|---|---|---|
| Failure reported | Mobile inspections and defect reporting create work orders | Timestamped defect with photo and meter reading |
| Diagnosis | Asset history shows prior repairs and open issues | Diagnosis notes linked to the vehicle |
| Parts | Inventory tracking with minimum levels and part requests | Parts used and stock movement per work order |
| Assignment | Scheduling and technician assignment by priority | Assignment time and workload view |
| Repair | Task lists and checklists per repair type | Labor hours and completed steps |
| Release | Status change and close-out requirements | Sign-off and release time for reporting |
Preventive Maintenance as an MTTR Tool
Preventive maintenance schedules, triggered by mileage, engine hours, or calendar dates, reduce the number of breakdowns that enter the average. Corrective work orders then show which failures still escape the plan.
Metrics to Read Alongside MTTR
MTTR alone can look better simply because fewer difficult repairs were logged. Read it with the measures below so improvement is real.
| Metric | Formula | What it tells you |
|---|---|---|
| PM on-time completion | (On-time PMs ÷ Scheduled PMs) × 100 | Whether prevention is actually happening |
| Planned maintenance ratio | Planned events ÷ Total maintenance events | How reactive the operation is |
| MTBF | Total operating time ÷ Number of failures | Reliability between repairs |
| First-time fix rate | Repairs not repeated within a set window ÷ Total repairs | Diagnosis and repair quality |
| Repair cost | Labor + Parts + External service | Which vehicles and systems drive spend |
| Backlog age | Time open work orders have waited | Capacity problems and neglected work |
A Checklist for Trustworthy MTTR Data
Reading MTTR by Vehicle Class, Repair Type, and Location
A single fleet-wide MTTR hides more than it reveals. A tire change and an engine-out repair belong in different buckets, and a depot with a fully stocked parts room behaves differently from one that relies on same-day deliveries. Slice the metric before drawing conclusions.
| Slice | Question it answers | Action it supports |
|---|---|---|
| Vehicle class | Do vans, light trucks, and heavy units recover at different speeds? | Set separate targets and stocking rules per class |
| Repair system | Are brakes, electrical, or cooling repairs the slowest? | Focus training, tools, and parts on the worst system |
| Depot or shop | Does one location lag behind the others? | Share practices from the best performer |
| In-house or vendor | Does outsourced work take longer end to end? | Set vendor turnaround expectations |
| Vehicle age | Do older units consume disproportionate repair time? | Inform replacement timing |
Mistakes That Make MTTR Misleading
- Mixing planned service into the average, which flatters the number.
- Letting open work orders sit uncounted until they close months later.
- Rounding labor to whole shifts instead of recording actual hours.
- Comparing depots that define the repair clock differently.
- Celebrating a lower MTTR without checking that repeat repairs did not rise.
Who Controls Each Stage of the Clock
Delay persists when nobody owns it. Assign each stage to a role and review that role's contribution in the monthly MTTR meeting, so the conversation moves from blaming the shop to fixing the process.
Vendor and Roadside Repairs Belong in the Average
Many fleets measure only the work done in their own bays, even though a large share of downtime happens at dealers, tire shops, and roadside. If those events never become work orders, MTTR looks better than the fleet's real availability.
- Create a work order when a vehicle is dispatched to a vendor.
- Record drop-off time, quote approval time, completion, and pickup.
- Attach the vendor invoice and the problem description to the same record.
- Review vendor turnaround alongside cost so slow providers become visible.
A Monthly MTTR Review That Leads to Action
Numbers only help when someone acts on them. Hold a short monthly review that follows the same order each time, so the discussion stays on causes instead of opinions.
- Start with MTTR by vehicle class and compare it with the previous quarter.
- Open the five longest repairs and name the stage where the time went.
- Check parts requests that waited more than a day and decide whether to stock them.
- Review repeat repairs on the same vehicle and ask whether prevention is missing.
- Record one change to try next month and one person responsible for it.
A 90-Day Plan to Move MTTR
Fleet MTTR Questions Answered
It depends on vehicle type and repair mix, so compare your own trend by class and repair type. Start with a baseline from work orders, then sign up to track it.
Include it if you want availability, and exclude it if you want technician efficiency. Pick one rule and apply it everywhere.
It mainly reduces how often vehicles fail, which lowers downtime even when each repair takes similar time. Track MTBF beside MTTR to see both effects.
Yes, because defects arrive with photos and meter readings, which speeds diagnosis and parts planning. You can book a demo to see the workflow.
Review monthly by vehicle class, and look at the longest repairs individually each week. Trends matter more than a single month.
Give Every Vehicle Repair a Clock You Can Read and Improve
Bring inspections, work orders, parts, scheduling, and asset history into one maintenance system, and let your own data show where repair time goes.