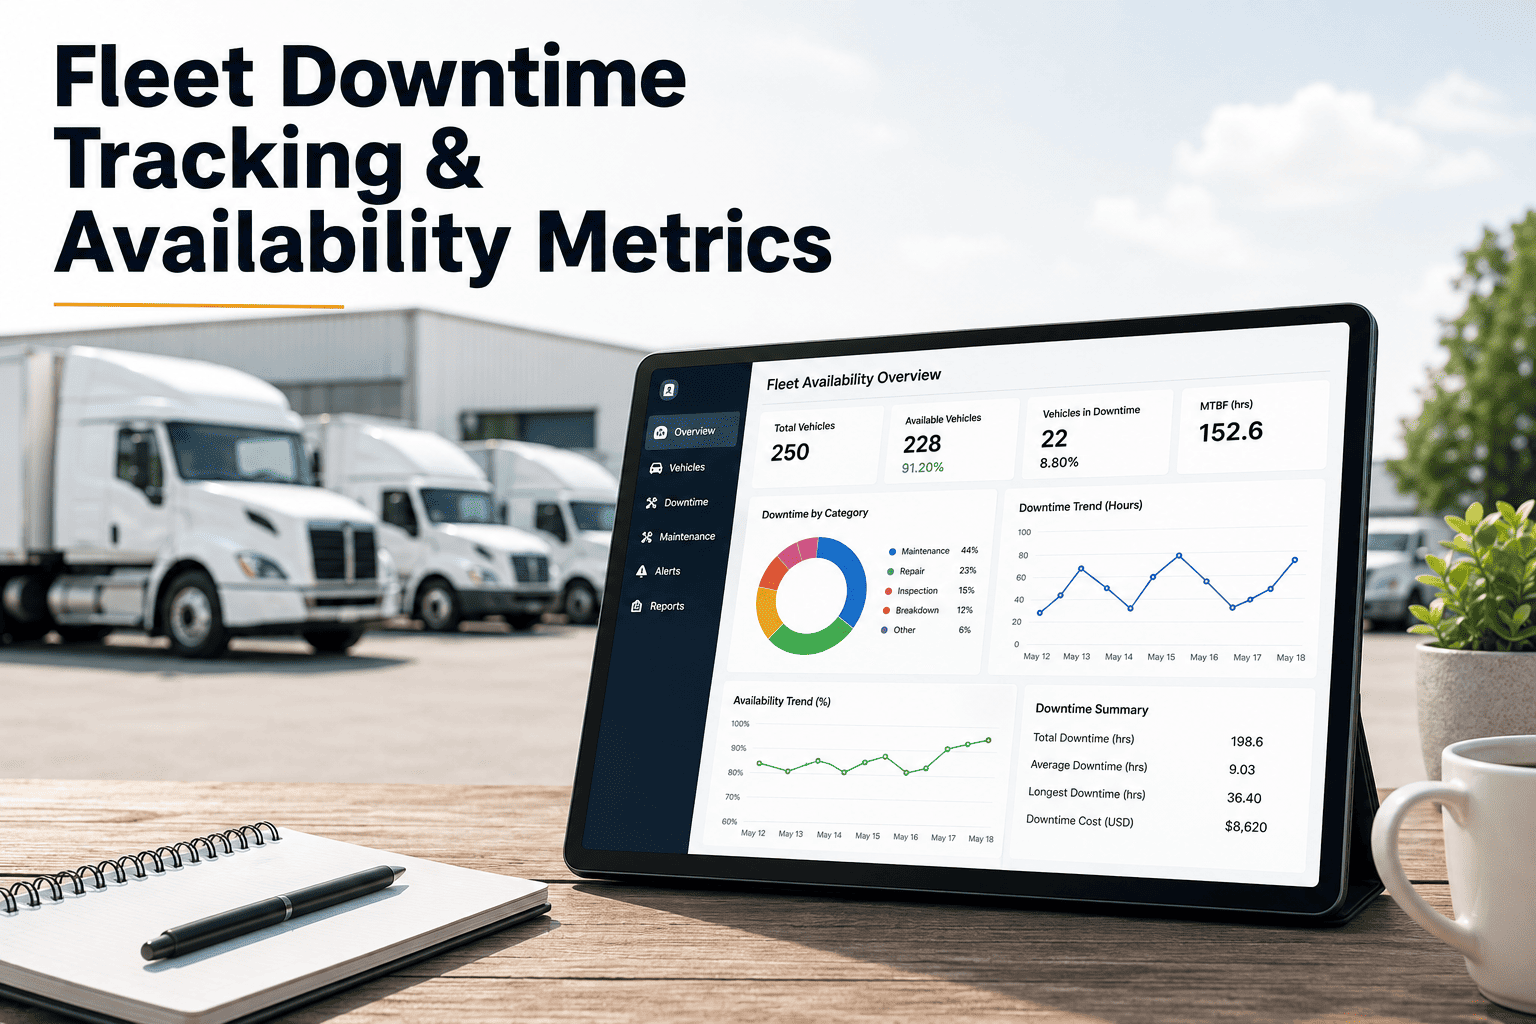
Fleet downtime tracking is the difference between knowing a truck is "broken again" and knowing exactly why it was off the road for 14 hours last Tuesday. Fleet vehicle availability — the percentage of units ready for dispatch at any given time — is the single most predictive operational KPI; industry benchmarks place world-class fleet uptime availability above 90%, while reactive fleets often drift into the 70s. By rigorously measuring fleet downtime metrics and categorizing every delay, maintenance leaders expose hidden costs (idle drivers, lost revenue, expedited towing) that quietly consume 15–20% of annual maintenance budgets. OxMaint turns fleet availability measurement into a live, automated dashboard so the worst offenders become visible and fixable — start your Start Free Trial to see your real numbers in 48 hours.
Fleet Availability Tracking
If you can't see your downtime, you can't fix it.
Most fleet teams guess at availability. OxMaint shows you exactly which vehicles are down, why they're down, and how to push fleet uptime availability past 90% — with automated downtime cause tracking and per-asset availability dashboards.
The Core Formula
How to calculate fleet vehicle availability
Fleet availability tracking starts with a simple, unflinching formula — but most teams never measure it consistently across every asset.
Scheduled Vehicle Hours = the hours a unit is expected to be available for dispatch (excludes planned off-shift time and scheduled maintenance windows if tracked separately).
Downtime Hours = any time the vehicle is unavailable due to unplanned breakdowns, awaiting parts, or technician delays. The clock starts at failure detection, not when the work order is finally opened.
World-class target = ≥90% availability for over-the-road fleets; ≥85% for mixed vocational/heavy equipment fleets with higher duty cycles.
The Real Cost
What fleet downtime actually costs you
A 50-vehicle fleet averaging 80% availability bleeds nearly half a million dollars annually in direct and indirect downtime costs.
| Downtime Cost Category | Per-Day Cost (Single Unit) | Annual Impact (50-Unit Fleet at 80% Availability) |
|---|---|---|
| Lost revenue / idle driver wages | $420 – $650 | $210,000 – $325,000 |
| Rental / substitute vehicle | $180 – $275 | $90,000 – $137,500 |
| Expedited parts & towing | $95 – $300 | $47,500 – $150,000 |
| Slipped delivery penalties / SLA fines | $200 – $1,000 | $100,000 – $500,000 |
| Total Estimated Annual Cost | — | $447,500 – $1,112,500 |
When fleet downtime metrics are invisible, these costs are buried across fuel budgets, driver payroll, and "miscellaneous repair" line items. OxMaint surfaces them automatically by tying every work order hour and parts expedite fee to the specific asset, giving you a true cost-of-unreliability per vehicle.
Downtime Cause Tracking
Fleet downtime metrics: what to measure beyond uptime
Tracking total downtime hours is step one. The real ROI comes from slicing downtime by root cause so you can attack the biggest contributors.
MTBF (Mean Time Between Failures)
Goal: Rising trend
Total vehicle operating hours ÷ number of unplanned breakdowns. A falling MTBF on a specific tractor signals an emerging systemic issue before it strands a driver 400 miles from the yard.
MTTR (Mean Time To Repair)
Goal: < 4 hours
Total repair hours ÷ number of repairs. High MTTR usually points to parts availability problems or technician skill gaps — not the fault itself.
Awaiting Parts Time
Goal: < 15% of downtime
Hours a vehicle sits idle while a filter, brake drum, or EGR valve is sourced. This is the most controllable downtime category — and the easiest to eliminate with stocked min/max levels.
Repeat-Failure Rate
Goal: < 5%
Percentage of work orders reopened on the same asset for the same symptom within 30 days. High rates indicate incomplete root-cause analysis or substandard parts.
PM Compliance Rate
Goal: ≥ 95%
Percentage of preventive maintenance tasks completed within the compliance window (e.g., ±500 miles or ±5 days). Fleets below 80% PM compliance almost always have availability below 85%.
Downtime by Asset Class
Goal: Identify outliers
Comparing availability across vehicle types (day cabs vs. sleepers vs. box trucks) exposes whether a specific OEM, model year, or duty cycle is dragging fleet uptime tracking numbers down.
Worked Example
From 76% to 91% availability in 90 days
A 120-asset regional delivery fleet was tracking downtime on a whiteboard. Here's what changed when they moved to structured fleet availability monitoring.
Baseline & Visibility
Deployed OxMaint fleet availability tracking dashboards. Discovered actual availability was 76% (believed it was 88%). Found 22% of downtime was "awaiting parts" and 14% was "awaiting technician assignment." Set up automated downtime clocks on all 120 assets.
Root Cause Attack
Used OxMaint analytics to identify three repeat-failure assets consuming 31% of all repair hours. Set min/max inventory on the top 12 failure parts (filters, sensors, belts). Eliminated 60% of "awaiting parts" delays within three weeks. PM compliance rose from 72% to 91% via automated PM reminders.
Sustained Improvement
Fleet vehicle availability reached 91.4%. Downtime cost dropped from $37,400/month to $14,900/month — a $268,200 annualized savings. Technician overtime fell 22% because work was predictable instead of crisis-driven.
How OxMaint Helps
Fleet downtime tracking software built for reliability teams
OxMaint CMMS doesn't just log downtime — it predicts it, categorizes it, and gives you the workflows to prevent it.
Live Fleet Availability Dashboards
Real-time per-asset and fleet-wide availability metrics, updated the moment a work order opens or closes. No more end-of-month spreadsheet reconciliations — see your true fleet uptime availability on one screen, anytime.
Outcome: Cut reporting time by 90%; spot availability drops the day they happen.
Automated Downtime Clock
Every work order auto-tracks downtime duration, reason codes, and sub-categories (awaiting parts, awaiting tech, repair in progress). Downtime cause tracking is enforced — technicians can't close a ticket without selecting a root cause.
Outcome: 100% of downtime hours attributed to a cause; zero blind spots.
Predictive Failure Alerts
AI-driven analysis of work order history, PM compliance, and meter readings flags assets trending toward failure before they break. Move from reactive to predictive maintenance without adding headcount.
Outcome: 30–50% fewer unplanned breakdowns; PMs scheduled before failures occur.
Parts Inventory Min/Max Automation
Auto-replenishment triggers keep critical failure parts in stock. Tie part usage to asset histories so you know exactly which filter brand lasts longest on which truck model.
Outcome: Eliminate 60–80% of "awaiting parts" downtime; reduce inventory carrying cost 15%.
See your real fleet availability numbers in 48 hours
Book a 30-minute demo and we'll show you exactly how OxMaint surfaces your hidden downtime, categorizes every delay, and pushes availability past 90%.
Frequently Asked Questions
Fleet downtime tracking & availability metrics: FAQ
What is a good fleet vehicle availability percentage?
A good fleet availability target is 90% or higher for over-the-road trucking fleets, and 85% or higher for mixed vocational and heavy equipment fleets with more severe duty cycles. Anything below 80% typically indicates systemic PM compliance issues, poor parts availability, or aging assets that should be targeted for replacement. OxMaint's fleet availability monitoring dashboards calculate this KPI automatically so you always know where you stand.
How is fleet downtime measured?
Fleet downtime is measured by tracking the total hours each vehicle is unavailable for dispatch due to unplanned repairs, scheduled maintenance overruns, or parts delays — divided by total scheduled vehicle hours. The most accurate method uses an automated downtime clock tied to work orders, which starts when a failure is reported and stops when the vehicle is released. You can set this up in minutes by starting a Start Free Trial with OxMaint.
What's the difference between fleet uptime and fleet availability?
Fleet uptime and fleet availability are often used interchangeably, but uptime typically refers to the raw hours a vehicle is operational, while availability expresses that as a percentage of scheduled hours. Fleet uptime tracking focuses on maximizing operational hours through preventive and predictive maintenance, while fleet availability measurement frames the same data as a dispatch-readiness KPI for operations and finance teams.
How do I track fleet downtime without a CMMS?
Tracking fleet downtime without a CMMS usually means relying on spreadsheets, whiteboards, or paper repair tickets — which typically undercount actual downtime by 20–40% because the clock only starts when someone remembers to log it. Without automated downtime cause tracking, you also lose the ability to analyze trends by asset, failure type, or technician. Most fleets see payback within 60–90 days of switching to a CMMS like OxMaint.
Can OxMaint track fleet availability for mixed vehicle types?
Yes. OxMaint tracks fleet vehicle uptime metrics across mixed fleets — Class 8 tractors, box trucks, vans, light-duty service trucks, and heavy equipment — with per-asset-class availability dashboards. You can set different scheduled-hour baselines, PM intervals, and downtime reason codes for each vehicle category, then roll everything up into a single fleet availability KPI for leadership reporting.
Stop guessing. Start tracking fleet downtime like a reliability team.
Every day without fleet downtime tracking is a day of hidden costs, missed SLAs, and preventable breakdowns. See how OxMaint CMMS makes 90%+ availability measurable, visible, and improvable.
Free 14-day trial · No credit card