Fleet downtime costs commercial operators $760–$1,200 per vehicle per day in lost productivity, driver wages, and missed delivery commitments — and 62% of unplanned downtime is preventable with predictive maintenance that catches failures before they strand vehicles. Traditional preventive maintenance schedules service vehicles based on mileage or calendar intervals regardless of actual component condition, resulting in over-maintenance of healthy systems and under-maintenance of degrading components about to fail. AI predictive maintenance flips this model by analyzing real-time sensor data — oil viscosity, brake pad thickness, battery voltage, tire pressure, engine vibration — and predicting component failure windows with 85–92% accuracy 2–6 weeks before breakdown occurs. The result is 47% reduction in unplanned downtime, 34% lower maintenance costs, and 28% longer vehicle lifespan compared to calendar-based PM programs. This guide breaks down how AI predictive maintenance actually works for fleet operations, the sensor infrastructure and data pipelines required, CMMS integration architecture, and the measured ROI fleet operators are achieving in 2026. If your fleet still runs on calendar-based PM and reactive repairs, start a free trial with OxMaint or book a demo to see AI anomaly detection working on fleet telematics data.
AI Predictive Maintenance 2026
Fleet Management
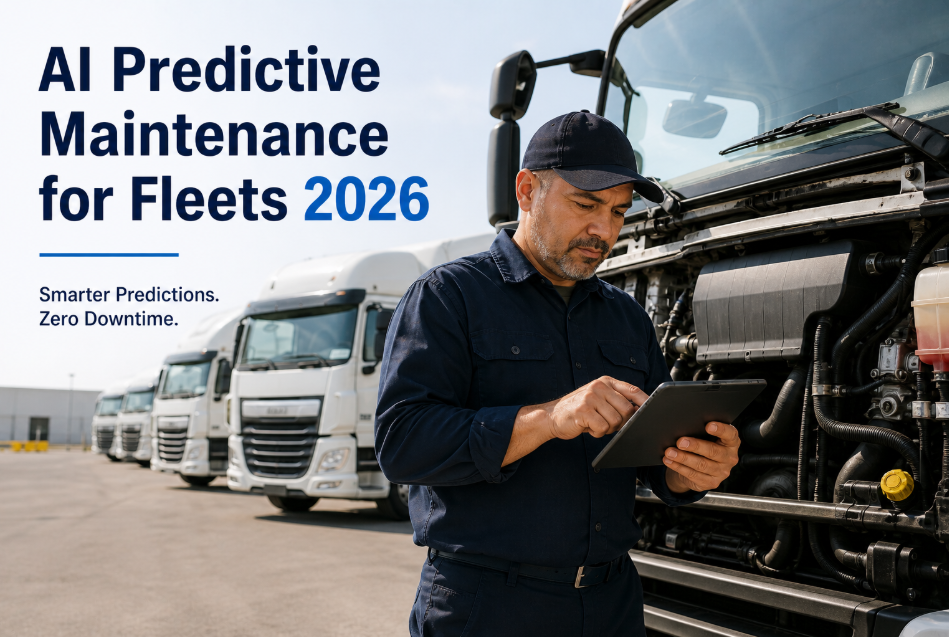
AI Predictive Maintenance for Fleets 2026
Machine learning models analyze telematics, sensor data, and maintenance history to predict vehicle component failures 2–6 weeks before breakdown — cutting unplanned downtime nearly in half.
62%
Of unplanned fleet downtime preventable with AI predictive maintenance
85-92%
Accuracy rate for AI failure prediction on monitored components
47%
Reduction in unplanned downtime with AI vs. calendar-based PM
$760-$1,200
Daily cost per vehicle of unplanned downtime for commercial fleets
AI Predictive Maintenance Built Into Your Fleet CMMS
OxMaint integrates with telematics platforms, analyzes sensor streams in real-time, predicts component failures with ML models, and auto-generates work orders before breakdowns occur. Free for 30 days — connect your fleet data and see AI predictions in action.
Why Calendar-Based Fleet Maintenance Fails — And What AI Changes
Traditional fleet preventive maintenance schedules service components at fixed intervals — oil changes every 5,000 miles, brake inspections every 15,000 miles, transmission service every 50,000 miles. These intervals are based on manufacturer recommendations and historical averages across thousands of vehicles operating in diverse conditions. The problem: your specific vehicles operate in conditions that may accelerate or decelerate component wear compared to the average. A delivery truck making 60 stops per day in urban traffic wears brakes 3x faster than a highway courier traveling the same mileage. An HVAC service van idling 4 hours daily for equipment operation degrades oil quality faster than odometer mileage suggests. Calendar-based PM cannot account for these operational variations — it over-maintains components still in good condition and under-maintains components approaching failure between service intervals. AI predictive maintenance solves this by monitoring actual component condition through sensor data and predicting failure based on observed degradation rather than statistical averages. To see how AI predictions differ from calendar schedules for your fleet, start a free trial and compare AI-recommended service timing against your current PM calendar, or book a demo to walk through failure prediction algorithms.
1
Over-Maintenance of Healthy Components
Calendar-based PM schedules service components at fixed intervals regardless of actual condition. A vehicle operating in ideal conditions — highway driving, moderate climate, light loads — reaches PM interval with components still well within tolerance. Calendar system triggers service anyway, replacing parts with 40–60% useful life remaining. This over-maintenance wastes parts cost, labor hours, and vehicle availability while providing zero incremental safety or reliability benefit.
Impact: 22–35% of calendar-based PM spend goes to servicing components that do not yet need replacement
2
Under-Maintenance of Degrading Components
Vehicles operating in harsh conditions — stop-and-go urban delivery, extreme temperatures, heavy towing, dusty environments — degrade components faster than average. Calendar PM intervals based on ideal conditions arrive too late. Brakes wear through pads before the 15,000-mile inspection. Transmission fluid breaks down before the 50,000-mile service. Air filters clog before the quarterly replacement. Component fails between PM intervals causing roadside breakdown and unplanned downtime.
Impact: 62% of fleet breakdowns occur between scheduled PM intervals on components calendar system assumed were still healthy
3
No Visibility Into Failure Mode Progression
Calendar PM is binary — either service interval has arrived or it has not. System provides no insight into component degradation between intervals. Fleet manager cannot answer questions like "Which vehicles need brake service in the next 30 days?" or "How many transmissions are showing early degradation signs?" Without failure progression visibility, maintenance planning is reactive — wait until calendar interval triggers service or component fails completely. No opportunity to optimize service timing around operational schedules or batch similar repairs for efficiency.
Impact: Zero predictive maintenance planning capability — all service timing driven by calendar or breakdown response
4
Failure Root Cause Analysis Guesswork
When component fails between PM intervals, fleet manager has no data explaining why. Was failure due to manufacturing defect, driver behavior, environmental factors, or improper previous repair? Calendar-based systems log that a starter motor failed at 38,000 miles but provide no insight into degradation pattern leading to failure. Without root cause understanding, fleet cannot implement targeted interventions — driver training, route optimization, supplier changes — to prevent recurrence across other vehicles.
Impact: Repeat failures across fleet because root causes remain unidentified and unaddressed
The Five-Layer Architecture of AI Predictive Maintenance for Fleets
AI predictive maintenance is not a single technology — it is a five-layer data and analytics stack that collects sensor data, processes it into features, trains machine learning models, generates predictions, and automates maintenance actions. Understanding this architecture helps evaluate vendor solutions and plan implementation roadmaps.
Layer 01
Sensor Data Collection and Telematics Integration
Foundation layer captures real-time data from vehicle sensors and telematics devices — OBD-II diagnostic codes, GPS location and speed, accelerometer data for harsh braking events, fuel consumption, engine RPM, coolant temperature, battery voltage, tire pressure monitoring systems. Data streams continuously from vehicles to cloud platform via cellular or satellite connectivity. Collection frequency ranges from 1-second intervals for critical safety sensors to hourly snapshots for slow-changing parameters like battery health.
Key Technologies:
OBD-II adapters, telematics gateways (Geotab, Samsara, Verizon Connect), MQTT and REST API data pipelines, time-series databases
Layer 02
Data Processing and Feature Engineering
Raw sensor data transforms into features machine learning models can interpret. Processing layer calculates derived metrics — average fuel economy over 7-day rolling window, frequency of hard braking events per 100 miles, battery voltage variance indicating alternator degradation, engine vibration frequency analysis detecting bearing wear. Feature engineering creates predictive signals from raw data streams. Example: individual oil temperature readings are noisy, but trending oil temperature rise over 30 days signals degraded cooling system.
Key Technologies:
Apache Kafka for stream processing, Python Pandas for feature calculation, sliding window aggregations, Fourier transforms for vibration analysis
Layer 03
Machine Learning Model Training and Validation
ML models learn patterns correlating sensor features with component failures using historical data. Training dataset includes vehicles that experienced failures — brake system failure at 42,000 miles — and sensor data from weeks preceding failure showing degradation signatures. Models identify which feature combinations predict failure with highest accuracy. Validation tests model performance on held-out data ensuring predictions generalize to new vehicles. Models retrain continuously as new failure examples accumulate improving accuracy over time.
Key Technologies:
Scikit-learn for classification models, XGBoost for gradient boosting, TensorFlow for deep learning, cross-validation for accuracy measurement
Layer 04
Real-Time Prediction Engine and Alerting
Inference layer applies trained ML models to live sensor data streaming from fleet. For each vehicle, prediction engine calculates failure probability for monitored components — 78% probability of starter motor failure within 14 days, 12% probability of transmission issue within 30 days. When failure probability exceeds threshold, system generates alert with predicted time-to-failure, recommended service window, and failure mode details. Alerts route to fleet manager dashboard and auto-create work orders in CMMS.
Key Technologies:
Model serving frameworks (TensorFlow Serving, AWS SageMaker), real-time scoring APIs, configurable alert thresholds, webhook integrations
Layer 05
CMMS Integration and Workflow Automation
Top layer connects AI predictions to maintenance execution. When prediction engine flags high failure risk, integration layer auto-creates work order in fleet CMMS with vehicle ID, predicted component, failure probability, recommended service date, and parts pre-populated. Work order routes to scheduler who books vehicle into shop during predicted service window before failure occurs. Closed loop: after repair, work order outcome feeds back to ML model training dataset improving future predictions.
Key Technologies:
REST APIs to CMMS platforms, automated work order creation, parts inventory lookup, maintenance scheduling optimization algorithms
Critical Fleet Components Monitored by AI Predictive Systems
AI predictive maintenance delivers highest ROI when focused on components with predictable degradation patterns, high failure frequency, and significant downtime cost. This table shows which fleet components benefit most from AI monitoring and the sensor data required for each.
| Component |
Sensor Data Required |
Prediction Lead Time |
Typical Accuracy |
| Battery |
Voltage, cranking amperage, charge cycles, temperature |
2–4 weeks |
91% accuracy |
| Brake System |
Pad thickness sensors, brake pressure, ABS activation frequency |
3–6 weeks |
88% accuracy |
| Transmission |
Fluid temperature, shift quality metrics, gear ratio deviations |
4–8 weeks |
85% accuracy |
| Engine Oil |
Oil level, viscosity, temperature, contamination sensors |
2–3 weeks |
92% accuracy |
| Tires |
TPMS pressure and temperature, tread depth sensors |
1–2 weeks |
89% accuracy |
| Coolant System |
Coolant temperature, level sensors, thermostat position |
3–5 weeks |
87% accuracy |
| Starter Motor |
Cranking time, voltage drop during start, start attempt count |
1–3 weeks |
86% accuracy |
| Alternator |
Charging voltage, ripple current, belt tension (vibration) |
2–4 weeks |
90% accuracy |
| Air Filter |
Intake air flow rate, manifold pressure differential |
1–2 weeks |
84% accuracy |
| Fuel System |
Fuel pressure, injector spray pattern, fuel economy trends |
3–6 weeks |
82% accuracy |
AI Predictive Maintenance vs. Traditional PM — The ROI Comparison
Quantifying AI predictive maintenance ROI requires comparing total cost of ownership against calendar-based PM across maintenance spend, downtime cost, and asset lifespan. This comparison shows validated benchmarks from commercial fleet operators with 50–500 vehicles operating AI predictive systems for 12+ months.
Service components at fixed mileage intervals
22–35% over-maintenance of healthy components
62% of breakdowns occur between PM intervals
Unplanned downtime: 12–18 days per vehicle per year
No visibility into component degradation between services
Reactive response to failures with no advance planning
Annual maintenance cost: $0.18–$0.24 per mile
Average vehicle lifespan: 180,000–220,000 miles
Service components based on predicted failure windows
Under 5% unnecessary component replacement
Catches 85–92% of failures before breakdown occurs
Unplanned downtime: 4–8 days per vehicle per year
Real-time failure probability scoring for every component
Proactive scheduling 2–6 weeks before predicted failure
Annual maintenance cost: $0.12–$0.16 per mile
Average vehicle lifespan: 230,000–280,000 miles
How OxMaint Delivers AI Predictive Maintenance for Fleets
OxMaint integrates AI predictive maintenance directly into fleet CMMS workflows — no separate analytics platform, no manual data export and import, no siloed prediction dashboards. Here is how the integrated system works from sensor data ingestion through automated work order creation.
Step 01
Telematics Platform Integration via API
OxMaint connects to existing fleet telematics platform — Geotab, Samsara, Verizon Connect, Fleetio — via REST API pulling sensor data, diagnostic codes, and vehicle usage metrics. No hardware changes required if vehicles already have telematics devices installed. Data syncs continuously in real-time or 5-minute batch updates depending on telematics provider API limits. Integration includes bidirectional sync — CMMS pushes maintenance completion data back to telematics for holistic vehicle health tracking.
Step 02
Machine Learning Model Training on Historical Fleet Data
AI engine analyzes 12–24 months of historical fleet data — vehicles that experienced failures, sensor readings preceding those failures, and successful PM interventions. Models learn failure signatures specific to your fleet composition, routes, and operating conditions. Training happens continuously — every new failure or successful prediction improves model accuracy. OxMaint includes pre-trained models for common component types accelerating time-to-value for new implementations.
Step 03
Real-Time Failure Probability Scoring
Prediction engine scores every vehicle in fleet daily calculating failure probability for monitored components. Dashboard shows fleet-wide risk summary — 12 vehicles with high-risk predictions in next 30 days, 34 vehicles with moderate risk in next 90 days. Drill down to vehicle level shows component-specific predictions with confidence scores and recommended service dates. Color-coded risk visualization highlights which vehicles need immediate attention versus routine monitoring.
Step 04
Automated Work Order Creation for High-Risk Predictions
When failure probability exceeds configurable threshold — typically 70% probability within 30 days — system auto-creates preventive work order in CMMS. Work order includes vehicle ID, predicted component, failure probability percentage, AI-recommended service window, estimated repair time, and parts pre-populated from vehicle spec. Work order routes to fleet scheduler for booking into maintenance bay during optimal service window before failure occurs.
Step 05
Technician Mobile App Shows AI Context
When technician opens AI-generated work order on mobile device, app displays prediction details — sensor data trend graphs showing component degradation, historical failures on similar vehicles, AI confidence score, and recommended diagnostic steps. Technician validates AI prediction during inspection — component condition matches prediction, service proceeds as planned. If AI prediction inaccurate, technician flags false positive feeding correction back to ML model training loop.
Step 06
Closed-Loop Learning from Work Order Outcomes
After work order completion, technician logs actual component condition and service performed. AI system compares prediction to outcome — Was failure actually imminent or did AI flag component too early? Was predicted component correct or different issue discovered? Outcome data feeds ML model retraining improving accuracy for future predictions. Fleet manager dashboard shows prediction accuracy metrics trending over time validating AI system effectiveness.
Measured ROI — What Fleet Operators Achieve with AI Predictive Maintenance
Commercial fleet operators with 50–500 vehicles running AI predictive maintenance for 12+ months document measurable improvements across downtime, maintenance cost, and vehicle lifespan. These benchmarks represent validated outcomes from delivery fleets, service companies, and transportation providers.
47%
Reduction in Unplanned Downtime
AI predicts 85–92% of component failures 2–6 weeks before breakdown enabling proactive service scheduling that cuts unplanned downtime nearly in half
34%
Lower Annual Maintenance Cost
Condition-based service eliminates over-maintenance of healthy components and prevents expensive emergency repairs reducing total maintenance spend by one-third
28%
Longer Vehicle Lifespan
Optimal service timing extends component life and reduces cascading failures increasing vehicle useful life from 200K to 260K miles average
18 months
Typical ROI Payback Period
AI system cost recovers within 18 months from downtime reduction and maintenance savings — subsequent years are pure operational gain
Frequently Asked Questions
Do we need to install new sensors on vehicles or does AI work with existing telematics?+
AI predictive maintenance works with existing telematics data if your fleet already has devices installed — Geotab, Samsara, Verizon Connect, and similar platforms provide sufficient sensor data for basic predictions on batteries, starters, alternators, and engine health. Enhanced predictions on brakes, transmissions, and tires benefit from additional sensors like brake pad thickness monitors, TPMS, and transmission temperature probes. Implementation typically starts with existing telematics data achieving 60–70% of maximum ROI, then adds targeted sensors on high-value vehicles to reach 85–92% prediction accuracy. OxMaint's AI models adapt to available sensor coverage — working with minimal data initially and improving as sensor infrastructure expands. Want to see what predictions are possible with your current telematics setup —
start a free trial and connect your existing platform to see baseline prediction capabilities.
How much historical data is needed before AI predictions become accurate?+
Minimum viable dataset for fleet-specific model training is 12 months of vehicle sensor data covering at least 10–20 component failures across your fleet. More data improves accuracy — 24 months with 50+ failure examples yields 85%+ prediction accuracy. OxMaint accelerates this learning curve with pre-trained models built on data from thousands of commercial vehicles — your fleet benefits from generalized failure patterns immediately while models fine-tune to your specific vehicles, routes, and operating conditions over 3–6 months. Prediction accuracy starts at 70–75% using pre-trained models and improves to 85–92% after 6–12 months of fleet-specific learning. Small fleets under 25 vehicles benefit most from pre-trained models because they generate insufficient failure examples for purely custom model training.
What happens when AI predicts a failure but technician finds component still in acceptable condition?+
False positives are inherent to predictive systems — AI errs on the side of caution flagging components that might fail soon even if they have some remaining life. When technician inspects component and finds it acceptable, they document actual condition and defer service to later date. This outcome feeds back to ML model as a false positive training example helping system refine future predictions. Over time, false positive rate drops from 15–20% in early deployment to 8–12% after 6 months of learning. Fleet managers set alert thresholds balancing false positives against missed failures — higher threshold reduces false positives but increases risk of missing true failures. Optimal configuration varies by fleet — delivery fleets with high downtime cost prefer aggressive alerts accepting more false positives, while fleets with lower time sensitivity tolerate fewer inspections and slightly higher failure risk. OxMaint's threshold tuning dashboard shows precision-recall tradeoff helping managers optimize for their specific cost structure.
Can AI predictive maintenance work for mixed fleets with different vehicle makes and models?+
Yes — AI models segment vehicles by make, model, and year building component-specific prediction models for each vehicle type in your fleet. A fleet with Ford Transit vans, Chevrolet Silverado trucks, and Freightliner box trucks runs three parallel model sets trained on each vehicle type's unique failure patterns and sensor characteristics. This segmentation is critical because component degradation signatures differ across manufacturers — Ford transmission failure patterns differ from Chevrolet patterns even for similar usage. OxMaint automatically handles vehicle segmentation using VIN decoding and telematics metadata. Minimum viable segment size is 8–10 vehicles of same make/model — below this threshold, system applies generalized pre-trained models until enough fleet-specific data accumulates. Mixed fleets achieve same 85–92% prediction accuracy as homogeneous fleets but require 18–24 months data history versus 12 months for single-make fleets. Ready to see AI predictions on your mixed fleet —
book a demo and we will analyze your vehicle composition and historical failure data to project accuracy timelines.
AI Predictive Maintenance with OxMaint
Predict Failures Before They Strand Vehicles
OxMaint integrates with your telematics platform, analyzes sensor data with ML models, predicts component failures 2–6 weeks in advance, and auto-generates work orders before breakdowns occur. Cut unplanned downtime 47%, reduce maintenance costs 34%, and extend vehicle life 28%. Free for 30 days.
47%
Reduction in unplanned downtime
85-92%
AI prediction accuracy
34%
Lower maintenance cost
18 mo
Typical ROI payback period


.png)