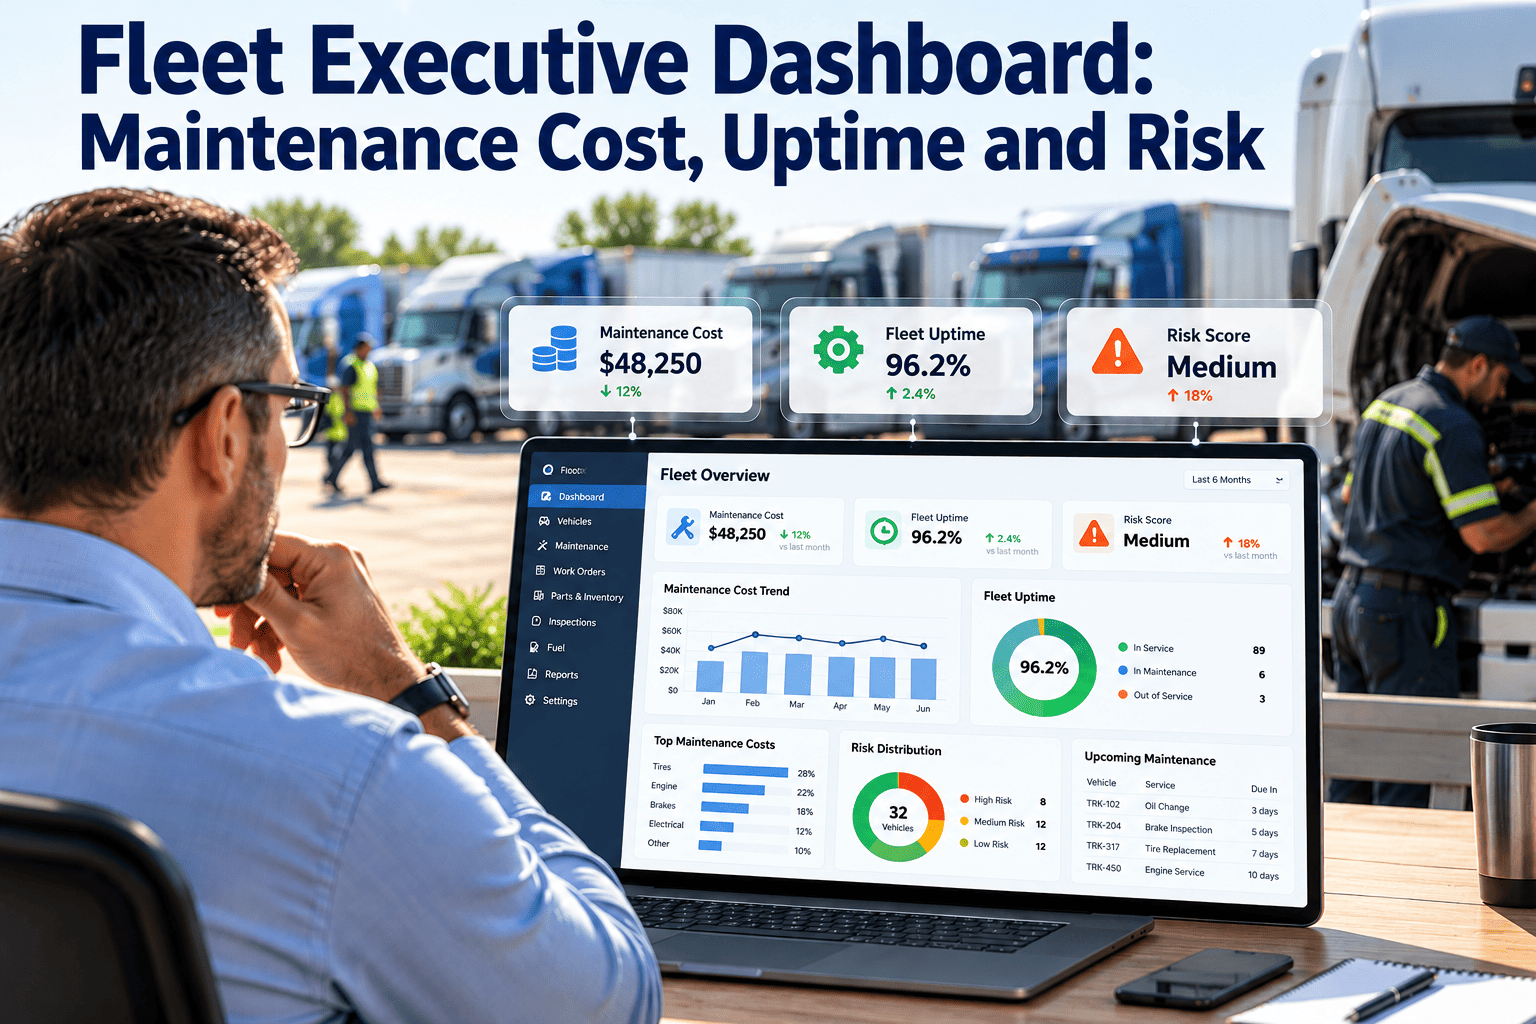
Fleet leaders rarely lack maintenance data; they lack maintenance data they can trust at a glance. Cost sits in one system, downtime in another, and inspection defects in a third, so the monthly executive review turns into a reconciliation exercise instead of a decision meeting. A fleet executive dashboard solves this by tying cost, uptime and risk back to the same work orders, inspections and asset records. This guide explains which measures matter, how to define them, and how fleet maintenance software keeps those numbers consistent from the shop floor to the boardroom.
Fleet Executive Dashboard: Maintenance Cost, Uptime and Risk
One view of what your fleet costs to keep running, how often it is available, and where the next failure or violation is most likely to come from, built from live work order data instead of month-end spreadsheets.
Why Executive Maintenance Reporting Breaks Down
Reporting built after the fact
- Costs exported from accounting, downtime estimated from driver complaints
- Different definitions of "downtime" in each depot
- Repairs coded inconsistently, so cost drivers stay hidden
- Overdue inspections discovered during roadside audits
- Executives see averages that conceal the worst units
Reporting built from work orders
- Every repair, part and labor hour tied to a unit and a work order
- One downtime definition, timestamped at open and close
- Standard failure and repair codes across all locations
- Inspection defects visible until they are closed
- Drill-down from fleet total to the single unit behind it
The Three Questions the Dashboard Must Answer
An executive dashboard is not a collection of charts. It is a short set of answers to cost, uptime and risk, each backed by a metric that someone in the shop can actually influence.
Are we spending in the right places?
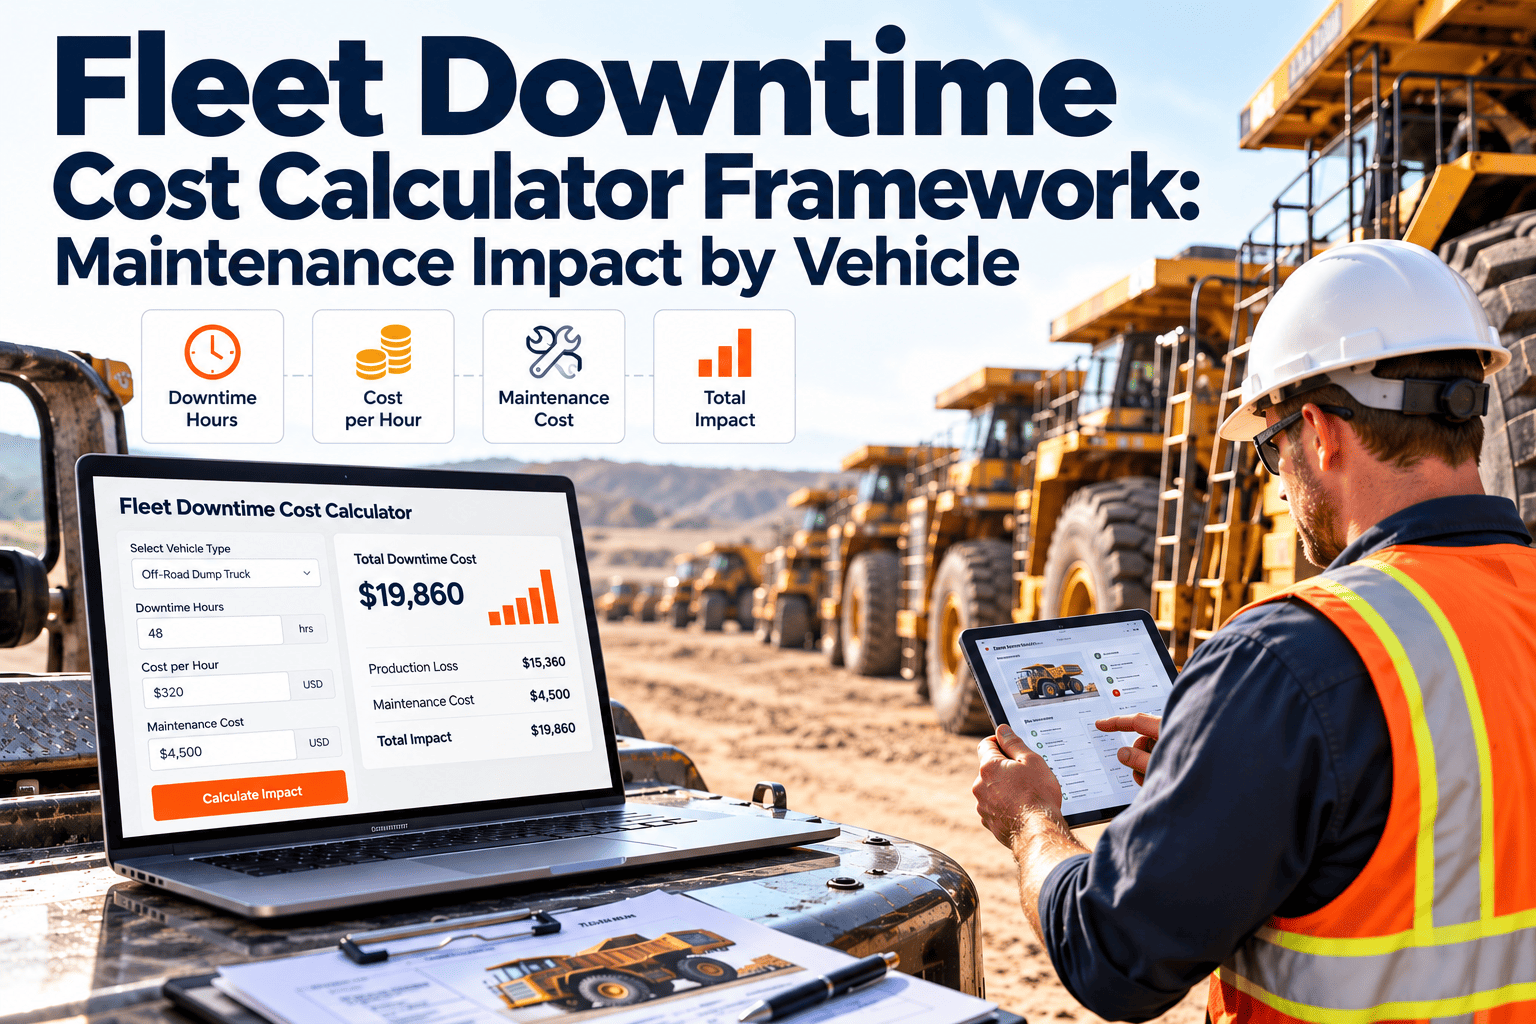
- Maintenance cost per mile or per hour by class
- Parts versus labor versus outside repair split
- Planned versus unplanned spend
- Repeat repairs on the same component
Are vehicles available when needed?
- Availability by class and location
- Average days out of service per repair
- Time waiting for parts versus time being repaired
- Backlog of open work orders by age
What could stop us or expose us?
- Overdue preventive maintenance and annual inspections
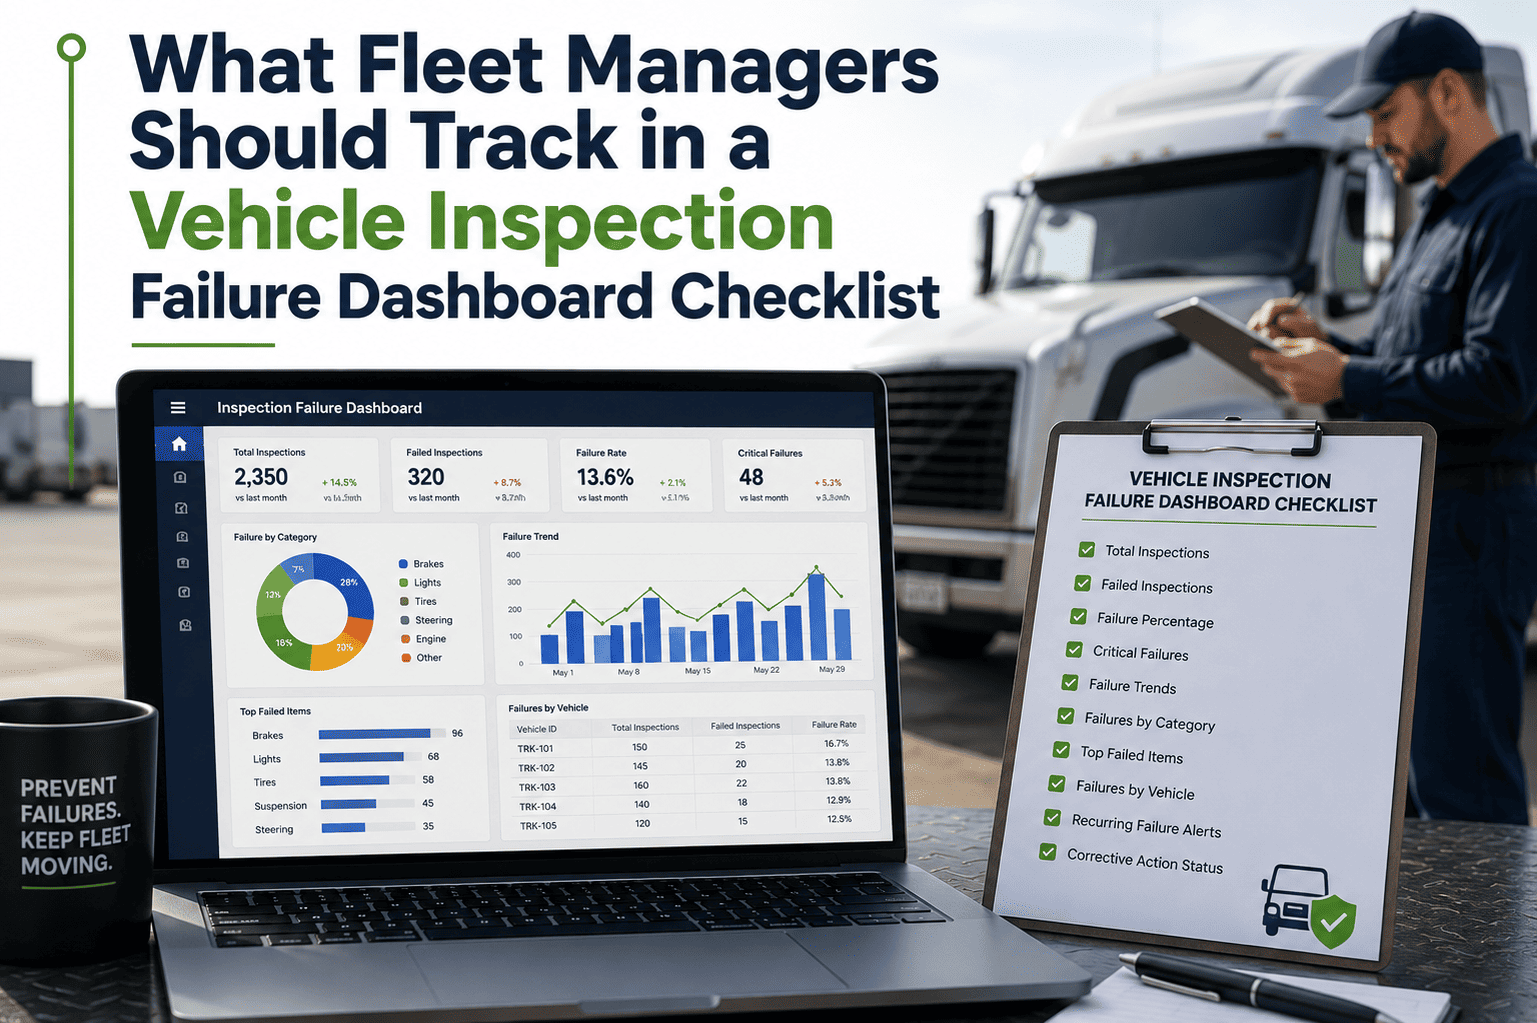
- Unresolved safety-related defects
- Units with rising repair frequency
- Missing or incomplete inspection records
KPI Definitions That Survive a Challenge
A dashboard is only as credible as its definitions. Write each one down once, and make sure the software calculates it the same way every time.
| KPI | Definition | Decision it supports |
|---|---|---|
| Maintenance cost per mile | Parts, labor and outside repair cost divided by miles driven in the period | Which classes or models cost the most to keep running |
| Vehicle availability | Hours in service divided by hours scheduled for service | Spare ratio and shop capacity |
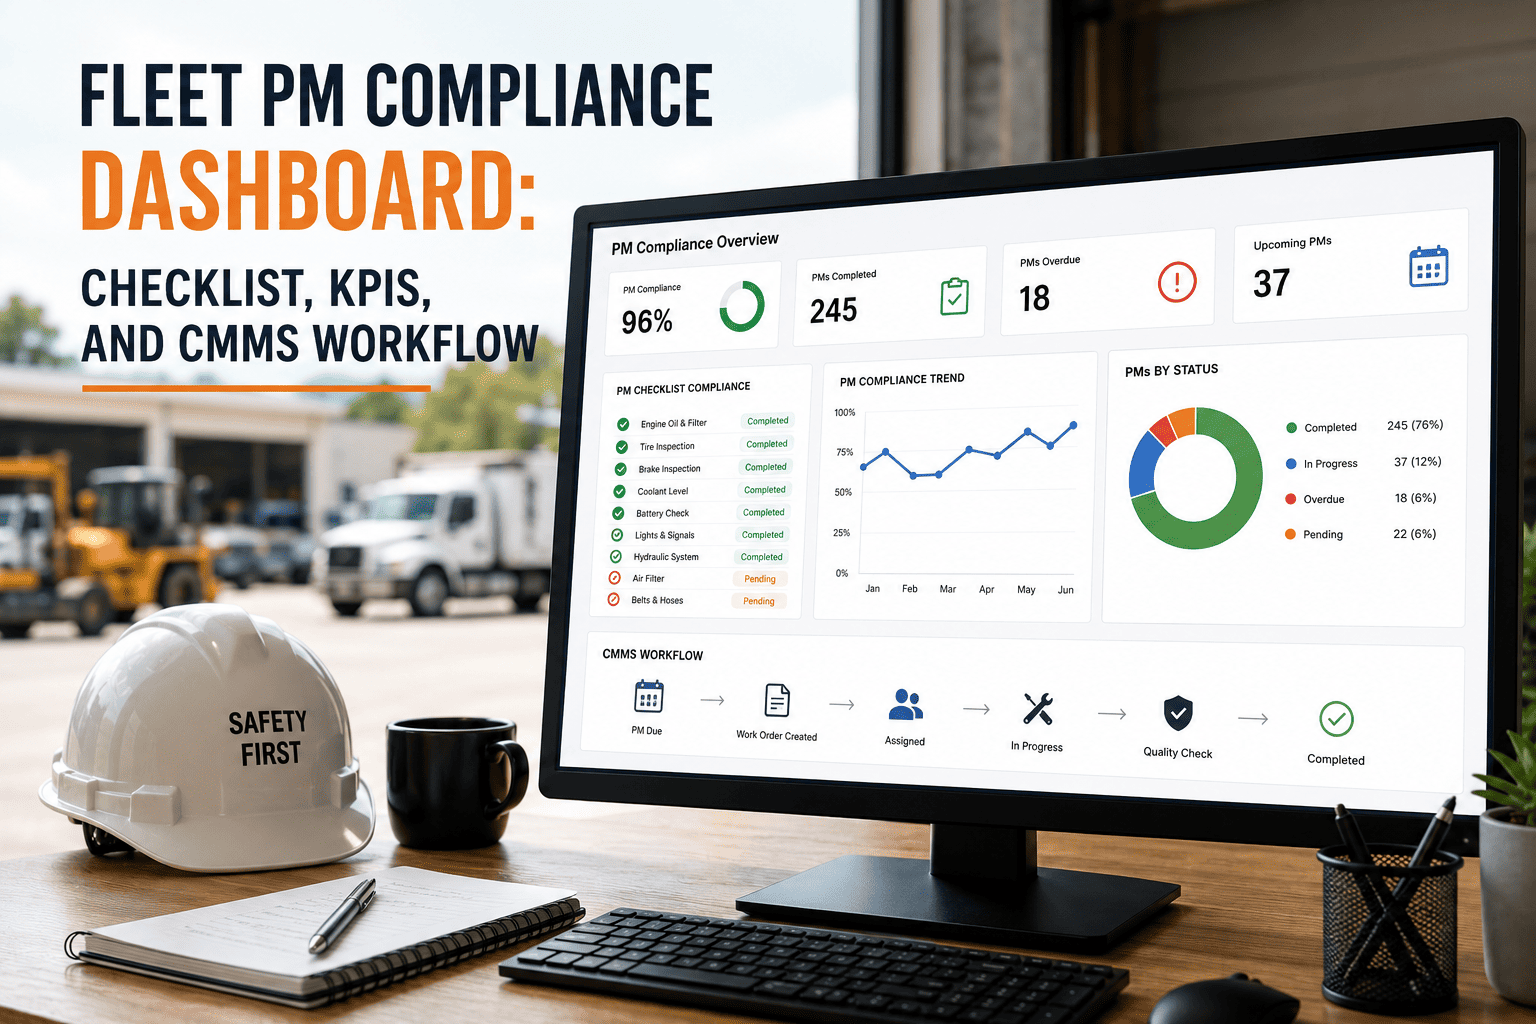
| PM compliance | Preventive tasks completed within the allowed window divided by tasks due | Whether schedules are being protected from breakdown work |
| Unplanned repair share | Corrective cost divided by total maintenance cost | Whether preventive effort is reducing failures |
| Repeat repair rate | Same component repaired again within a set window | Quality of diagnosis and parts |
| Mean time to repair | Average time from work order open to unit released | Shop flow, parts delays and staffing |
| Aged safety defects | Open defects flagged safety-related, grouped by days open | Compliance exposure and driver trust |
Reading Risk: A Simple Fleet Risk Matrix
Executives need to see which exposures deserve attention first. Scoring each issue by likelihood and consequence gives a shared way to rank them.
Where the Dashboard Data Comes From
Every number should trace to a record created during normal work. If the dashboard needs extra data entry, it will fall out of date.
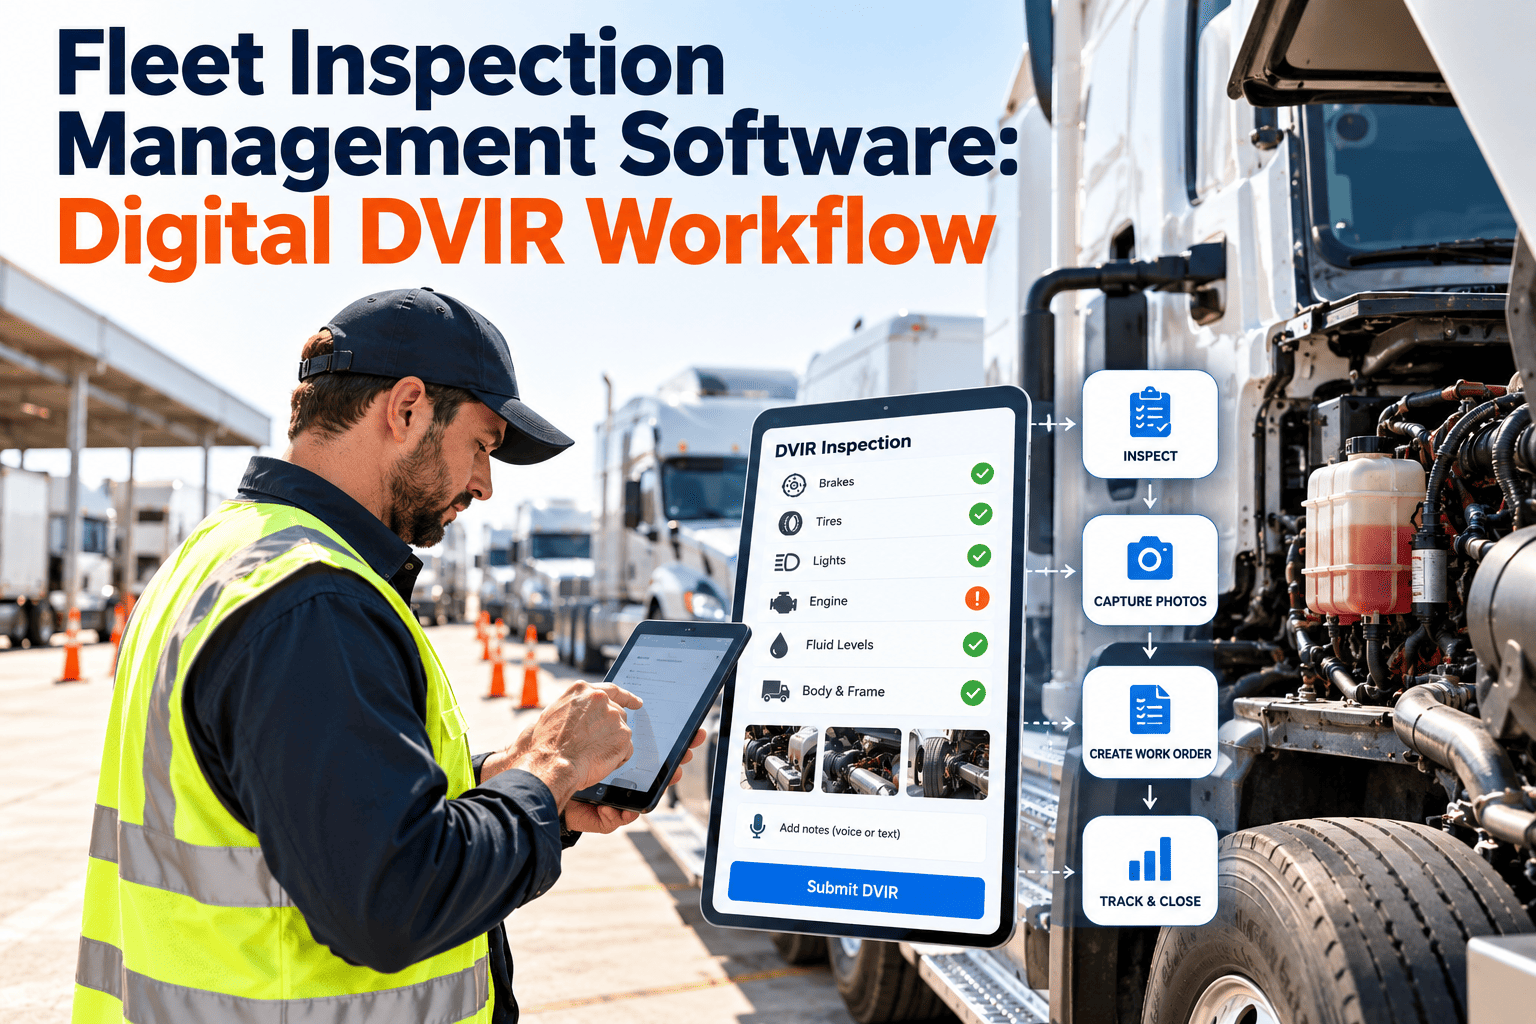
- InspectionDriver and technician checks capture defects with severity and photos.
- Work orderDefects become work orders linked to the VIN or unit number.
- Parts and laborParts issued and hours logged against each job.
- CloseoutCause, correction and release timestamp recorded.
- DashboardKPIs roll up by unit, class, location and period.
Three Layers of Dashboard, One Source of Truth
Executive layer
Cost per mile, availability, planned versus unplanned share and a short list of top risks. Reviewed monthly or quarterly.
Location and manager layer
Backlog age, PM compliance by depot, repeat repairs, parts wait time and technician workload. Reviewed weekly.
Shop and unit layer
Open work orders, overdue inspections, unit history and parts status. Used daily to run the shop.
See Cost, Uptime and Risk in One Place
Connect inspections, work orders, parts and asset history so your fleet reporting reflects what actually happened in the shop.
Common Dashboard Mistakes to Avoid
- Averaging across the whole fleet, which hides the handful of units consuming most of the budget.
- Measuring cost without measuring availability, which rewards under-maintaining vehicles.
- Counting a PM as complete when only part of the checklist was finished.
- Letting downtime start when the repair begins instead of when the unit stops earning.
- Using free-text repair descriptions, which makes pattern analysis nearly impossible.
- Reporting leading indicators such as overdue PMs without tying them to later breakdown cost.
Setting Thresholds and Review Rhythm
Baseline first
Run the definitions for at least a full cycle before setting targets, so goals reflect your duty cycle, climate and vehicle mix.
Segment by class
Compare like with like. A refuse truck, a delivery van and a tractor have very different cost and availability profiles.
Set action triggers
Define what happens when a metric crosses a line, such as a root cause review for a unit with repeated repairs.
Review on a fixed cadence
Weekly for backlog and compliance, monthly for cost and availability, quarterly for lifecycle and replacement planning.
Reading the Dashboard by Fleet Type
The same dashboard means different things in different operations. Segment results so each part of the fleet is judged against its own duty cycle, not a single fleet-wide average.
| Fleet segment | Typical cost driver | Uptime priority | Risk focus |
|---|---|---|---|
| Last-mile delivery vans | Brakes, tires and stop-and-go wear | Daily route coverage | Tire and brake defects reported by drivers |
| Long-haul tractors | Powertrain, aftertreatment and tires | Avoiding roadside breakdowns | PM intervals, annual inspections, roadside inspection outcomes |
| Refuse and municipal | Hydraulics, bodies and brakes | Collection schedules | Body and lift systems, operator inspections |
| Construction and vocational | Hydraulics, undercarriage, off-road wear | Job-site availability | High-hour components and operator checks |
| Passenger and bus | Doors, HVAC and brakes | Service reliability | Safety systems and passenger-facing defects |
When a Number Moves: What to Check First
Cost per mile is rising
Split cost into parts, labor and outside repair. Then look for repeat repairs, an aging unit mix, supplier price changes, or earlier deferred PM now showing up as corrective work.
Availability is falling
Separate waiting time from repair time. Check parts delays, backlog age, technician capacity and a short list of units that keep returning to the shop.
PM compliance is slipping
Ask whether breakdown work is consuming bay time, whether meter readings are stale, or whether vehicles are not being released to the shop on schedule.
Unplanned share is growing
Review inspection quality and PM content. If failures happen between services, the intervals or checklist items may need to change.
Aged defects are accumulating
Look at ownership, parts waits and approval delays. Confirm that severity is classified the same way at every location.
Repeat repairs are climbing
Challenge diagnosis quality, part quality and supplier performance. A root cause review is usually cheaper than a third identical repair.
Making Executives Trust the Numbers
Executives stop using a dashboard the first time a figure cannot be explained. Four habits protect credibility.
Define in writing
Publish one definition for each measure, including what counts as downtime and when a PM is considered complete.
Capture at the source
Technicians and drivers record data on mobile devices as work happens, not days afterward from memory.
Reconcile with finance
Compare maintenance cost in the work order system with accounting each month and explain differences, such as timing of vendor invoices.
Allow drill-down
Every headline figure should open to the class, the unit and the work order behind it.
Putting Compliance Exposure Beside Cost
For US operations, FMCSA rules for motor carriers address systematic inspection, repair and maintenance, driver vehicle inspection reports and periodic inspections. Overdue items are therefore a regulatory and liability issue, not only a maintenance one. Confirm exact requirements for your operation with your compliance team.
- Units with a periodic or annual inspection overdue or due within the next month.
- Driver-reported defects that remain open beyond your target response time.
- Vehicles dispatched with an open safety-related defect, which should be zero.
- Inspection and repair records missing for a unit when an audit request arrives.
- Out-of-service orders from roadside inspections and the date each was cleared.
- Records that are not retained in line with your required retention period.
Questions Executives Should Ask in Every Review
Productive questions
- Which three classes account for most of the cost change this month?
- Which units have generated the most downtime in the last quarter?
- What is the oldest open safety defect and who owns it?
- If PM compliance is below target, what stopped the work?
- Which units should we plan to replace in the next budget cycle?
Warning signs in the answers
- "We will pull that data and get back to you"
- Different locations quoting different definitions
- Explanations that cannot be traced to a work order
- Targets that were never based on baseline data
- Actions without an owner or date
Alerts and Thresholds That Prompt Action
Alert on exceptions
Set alerts for conditions that need a response, such as a safety defect open beyond its limit or a unit with several repairs in a short window. Avoid alerts for normal variation, which teach people to ignore them.
Use tiers
A first threshold prompts the shop manager, a second prompts the maintenance director, and a third prompts executive review. Each tier names an owner and an expected response time.
Compare to class norms
A unit costing twice its class average deserves attention. A unit costing slightly more than a fleet-wide average may simply be a larger vehicle doing heavier work.
Review thresholds yearly
As the fleet changes, thresholds drift out of date. Revisit them against the previous year of data and adjust where they no longer separate normal from abnormal.
Keeping the Dashboard Useful Over Time
- Retire any measure nobody has used in a decision for two review cycles.
- Add a measure only when a specific decision depends on it and the data is already captured in normal work.
- Keep an owner for each KPI who can explain a movement in it within a day.
- Record changes to definitions and the date they took effect, so trends are not silently broken.
- Ask frontline users, technicians and supervisors, whether the data entered for the dashboard reflects what happened.
How Oxmaint Supports Executive Fleet Reporting
Inspections and defects
Mobile inspection checklists capture defects at the source and convert them into work orders without retyping.
Work orders and asset history
Every repair stays attached to the unit, building a history that supports repeat-failure and lifecycle analysis.
Preventive maintenance scheduling
Interval-based schedules by time or meter reading keep PM compliance measurable and visible.
Parts and inventory
Parts usage recorded against work orders makes cost and stockout delays easier to report.
Reports and dashboards
Roll data up by class, location and period, then drill down to the work order behind any figure.
Compliance records
Inspection and repair records are kept in one place, which supports audit preparation.
Frequently Asked Questions
Give Leadership Numbers They Can Trust
Start tracking cost, uptime and risk from live fleet maintenance records and move your review meetings from debate to decisions.