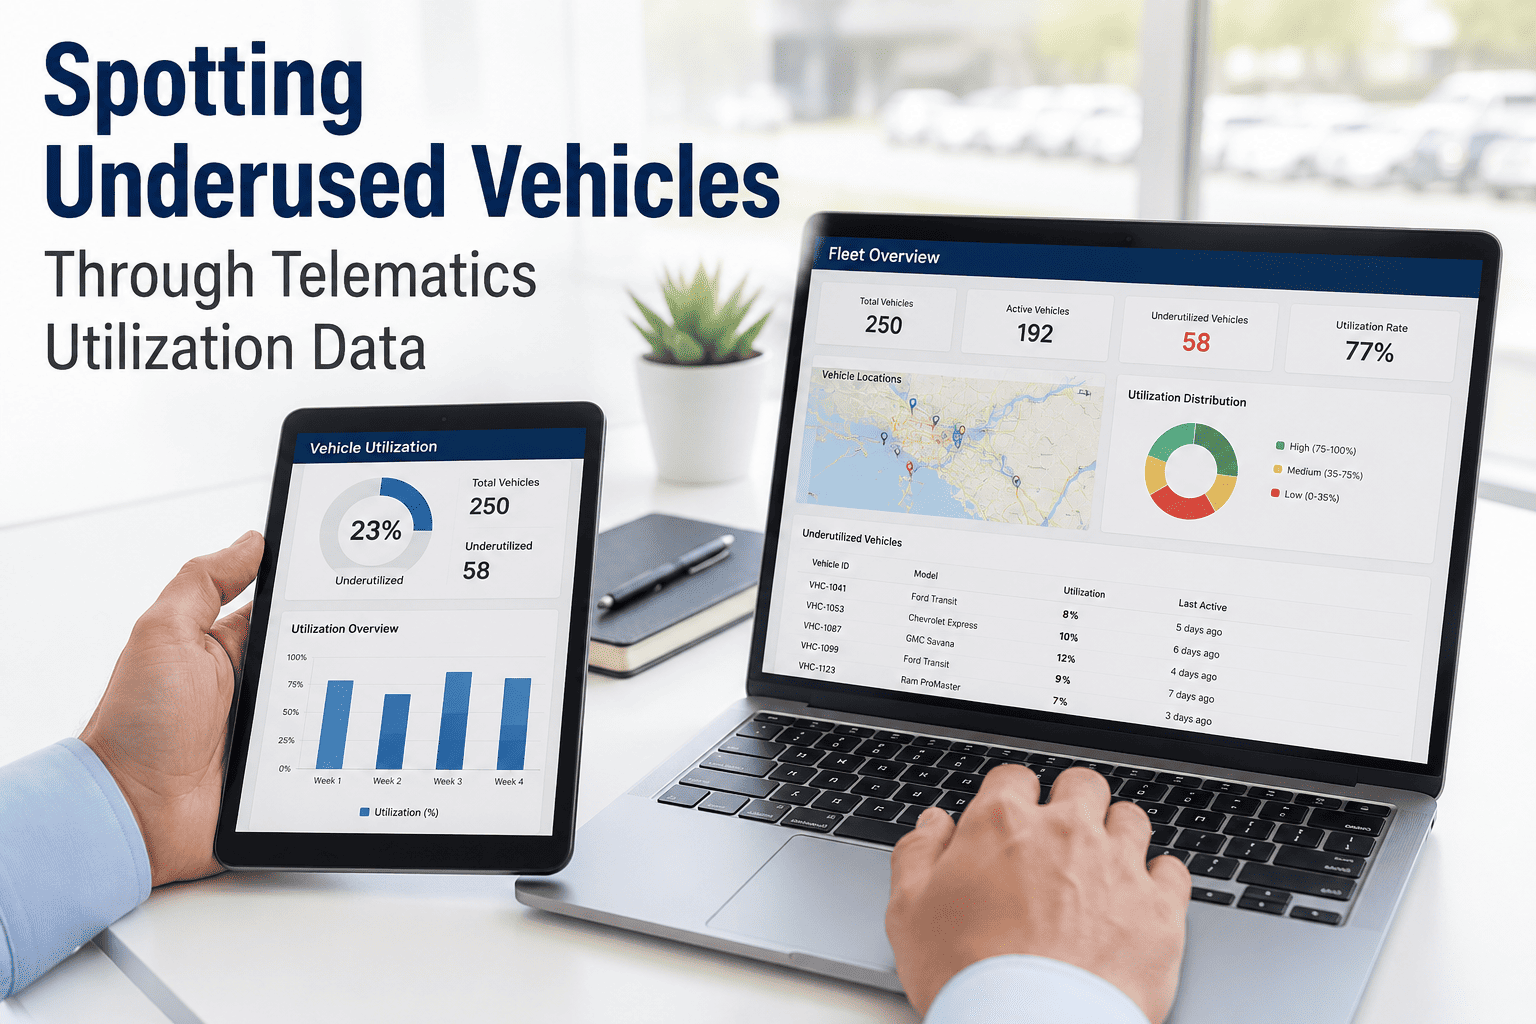
Spotting Underused Vehicles Through Telematics Utilization Data
By Corin Hale on July 14, 2026
The average commercial fleet carries 20–35% more vehicles than daily demand actually requires — assets that sit for days between uses or run at 30–40% of their capacity when they do move. Underutilization is invisible on a P&L (the vehicle still costs its depreciation, insurance, and registration whether it moves or not) but visible the moment telematics data is aggregated into a per-asset utilization report. The four metrics that expose it are simple, the disposition decision framework built on top is repeatable, and the financial upside for a 100-truck fleet is $600K–$1.2M in freed capital plus $50K–$80K per year in recovered carrying cost. OxMaint calculates utilization per vehicle from live telematics data and flags the bottom 10% for quarterly disposition review.
Daily carrying cost of an idle light-duty fleet vehicle — insurance, depreciation, licensing, and lot space accrue whether the vehicle moves or not
31 of 140
Vehicles at a mid-size Texas municipal fleet averaging under 200 miles per month — $217K per year in carrying cost with zero operational contribution
15 min
Time required to identify the bottom 10% of the fleet by utilization score once telematics data is flowing into OxMaint
The Utilization Blind Spot — Why P&L Reports Never Catch It
Underutilization does not show up on a P&L because a parked vehicle looks financially identical to a busy one — same depreciation line, same insurance premium, same registration expense. The waste is only visible when you divide fixed cost by productive hours per vehicle. That calculation is impossible without per-asset telematics data, which is exactly why fleets accumulate 20–35% surplus capacity before anyone notices.
What the P&L Shows
Fleet Depreciation: $840,000/yr
Fleet Insurance: $312,000/yr
Registration & Licensing: $58,000/yr
Total Fleet Carry: $1.21M/yr
One number. No per-asset detail. No way to see which vehicles earn their cost.
The Four Utilization Metrics That Reveal Underused Assets
A single number can lie. A truck that leaves the depot daily but sits idle at a job site for six hours registers as "in use" on a departure log but under 30% on engine-hour utilization. The four telematics-derived metrics below, viewed together, reveal the honest picture of which assets are earning their fixed cost and which are quietly bleeding capital.
01
Percent of Days Used
Days the ignition was on for a productive trip, divided by days the vehicle was available. A truck at 40% (2 days a week) when peers run 80% is either surplus or wrong-shift — both actionable.
Peer benchmark: 70–85% for logistics fleets
02
Engine Hours Per Day
Ignition-on time from telematics, not driver claim. A vehicle that shows 2 hours per day of engine time when peers run 6–8 is underused even if it "leaves the depot every morning" — presence is not productivity.
Peer benchmark: 5–8 hrs for delivery fleets
03
Miles Per Week vs Peer Group
Weekly odometer delta compared to the peer average for the same vehicle class. A light-duty vehicle averaging under 200–300 miles per month lands in the flag zone unless it is a specialized reserve unit — most are not.
Flag threshold: less than 60% of class peer
04
Load Factor Per Trip
When fleets capture load data (weight, pallet count, or cube fill), load factor exposes the second layer of waste — a truck running 5 days a week at 32% cube fill is a re-routing opportunity, not a fully-utilized asset.
Peer benchmark: 70%+ cube or weight fill
The Utilization Spectrum — Four Zones, Four Decisions
Utilization data becomes decision-ready when scores are grouped into zones with predefined actions. Below 40% is a disposition candidate. 40–70% is a reallocation review. 70–85% is healthy operating range. Above 90% signals over-utilization risk — the asset is at higher risk of breakdown and often has deferred maintenance masked by the busy schedule.
Fleet Utilization Score — Action by Zone
0–40%Dispose
40–70%Reallocate
70–85%Healthy
85–95%Stress
Below 40% — Disposition Candidate
Vehicle earns less than half its fixed cost. Auction or trade-in frees capital; carry cost of $5K–$7K/yr per light-duty asset recovered to operating budget.
40–70% — Reallocation Review
Move to higher-demand department, add to a shared motor pool, or defer replacement by shifting workload from an over-utilized peer onto this asset.
70–85% — Healthy Range
Target zone for logistics and delivery fleets. Asset earning its fixed cost, wear accumulating in line with replacement schedule, spare capacity for peak demand.
Above 85% — Stress Zone
Reactive maintenance risk rises sharply above 90%. Advance replacement schedule for this asset; consider adding capacity if the whole class is in stress zone.
Quarterly Utilization Reviews Run Themselves in OxMaint
Utilization dashboard by vehicle class · Peer benchmarking · Bottom-10% flag list · Disposition financial impact — updated live from telematics
The Quarterly Review Cadence — Turning Data Into Decisions
Utilization data without a review cadence becomes another dashboard nobody opens. The four-step quarterly review below is the operating rhythm that converts telematics scores into asset disposition actions — and the reason fleets that follow it recover 10–20% of fleet carrying cost within twelve months.
Week 1
Pull Utilization Scores
OxMaint aggregates the last 90 days of telematics data — days used, engine hours, mileage, load factor — and generates a score for every vehicle. Scores segmented by class and department automatically; seasonal adjustments applied for asset classes like snow plows or reserve units.
Week 2
Review Bottom 10%
Fleet manager reviews the flag list — assets scoring below the class benchmark — with department heads. Verify context before acting: was the vehicle in a seasonal off-cycle, assigned to short-trip work, or genuinely idle? OxMaint attaches usage patterns and trip logs to each flagged asset.
Week 3
Assign Disposition
Each flagged vehicle receives one of three decisions — reallocate to a higher-demand assignment, add to a shared motor pool, or dispose at auction. The financial impact of each option is calculated in OxMaint: recovered carry cost, capital freed, or productivity gained by the receiving department.
Week 4
Execute and Document
Reallocation transfers, motor pool moves, and disposition work orders logged in OxMaint. The financial recovery is tracked against the quarter's target; the utilization dashboard resets for the next 90-day cycle. Board-ready rightsizing evidence is a byproduct, not a separate report.
Disposition Decision Framework — Three Paths, One Data-Driven Choice
Every asset in the bottom 10% earns one of three outcomes. The decision is not intuition — it flows from the utilization score, the peer demand picture, and the financial delta between the three paths, all of which OxMaint presents in one screen alongside the vehicle's maintenance and cost history.
Path A
Reallocate
When another department or route runs peer vehicles above 85% utilization while this asset sits below 60%, reallocation absorbs surplus capacity without capital spend or auction transaction cost.
Outcome: Higher fleet-wide utilization, deferred replacement spend on the receiving side, zero disposal loss on the transferring side.
Path B
Motor Pool
When multiple dedicated assets across departments each run 30–50% utilization, converting them into a shared motor pool multiplies effective capacity — 6 pool vehicles often replace 10 dedicated ones with equal service level.
Outcome: 40% reduction in dedicated fleet size, motor pool utilization typically 75–85%, capital freed for higher-priority replacements.
Path C
Dispose
When the asset scores below 40% with no peer demand to absorb it, disposition at auction or trade-in recovers residual value and eliminates the annual carry — insurance, depreciation, licensing, storage.
Outcome: $5K–$7K/yr recovered per light-duty asset, $12K–$18K/yr per heavy-duty asset, plus one-time capital recovery from the sale itself.
Financial Impact — What a 100-Truck Fleet Actually Recovers
The financial case for utilization-driven rightsizing is not theoretical. For a 100-truck fleet with typical 20% underutilization, the year-one recovery from identifying and dispositioning the bottom decile is measurable in seven-figure capital and six-figure operating cost — before any efficiency gains from redeployment.
100-Truck Fleet — Year 1 Utilization Rightsizing Impact
Vehicles flagged in bottom 10%
10 assets
Assets dispositioned (Path C)
6 assets
Capital freed at auction / trade-in
$600K – $1.2M
Annual carrying cost recovered
$50K – $80K/yr
Assets reallocated (Path A + B)
4 assets
Deferred replacement capital
$280K – $420K
Total Year 1 Financial Recovery
$930K – $1.7M
80%
Of fleets carry more assets than daily demand requires — invisible on the P&L
14%
Average utilization uplift once OxMaint scoring and quarterly reviews are in place
90 days
Data collection window to establish a reliable per-vehicle utilization baseline
$1.3M
Capital avoided by one utility fleet by dispositioning half of 12 unused vehicles identified via telematics
Every department told me they needed more vehicles. When we pulled the telematics into OxMaint and ran the utilization scores, 22 of our 118 assets were running under 200 miles a month. We dispositioned 14, moved 8 into a shared pool. That's $103,000 a year in carry cost gone and $780,000 in freed capital — without buying a single new vehicle or turning down a single job.
— Fleet Manager, Regional Distribution Operator · 118 vehicles across 4 depots · Year 1 utilization rightsizing outcome
Frequently Asked Questions
Ninety days of telematics data produces a stable per-vehicle utilization baseline that accounts for weekly and monthly demand variation. Fleets that connect telematics on day one see the first flag list within the first quarter.
OxMaint segments benchmarks by class and applies seasonal adjustments — a snow plow with low summer utilization is not flagged alongside a sedan that never moves. Context prevents bad disposition decisions on legitimate reserve capacity.
Yes — OxMaint ingests data from any AEMP-compliant telematics platform and consolidates into one utilization report regardless of vendor. Book a demo to see mixed-fleet scoring on your asset list.
High-utilization assets earn replacement earlier because wear accumulates faster; low-utilization assets earn deferred replacement because calendar age no longer forces the decision. Total lifecycle capital drops 12–18% when replacement follows utilization instead of calendar.
Yes — every flagged asset carries a calculated impact: capital freed at disposition, annual carry cost recovered, or deferred replacement spend. The board-ready rightsizing narrative is a byproduct of the quarterly review, not a separate exercise.
Utilization Rightsizing — OxMaint
Stop Paying to Park Vehicles That Never Move. See Your Bottom 10% This Quarter.