Fuel is usually the largest variable line in a fleet budget, yet most teams only see it as a monthly total on an invoice. A cost per mile dashboard turns that total into a number you can act on by vehicle, route, driver and season. The catch is that fuel cost per mile moves with vehicle condition, so the dashboard only works when maintenance data sits beside fuel data. This guide explains what to track, how to build the view, and how Oxmaint maintenance management software connects fuel signals to inspections, work orders and preventive maintenance.
Fleet Fuel and Cost Control
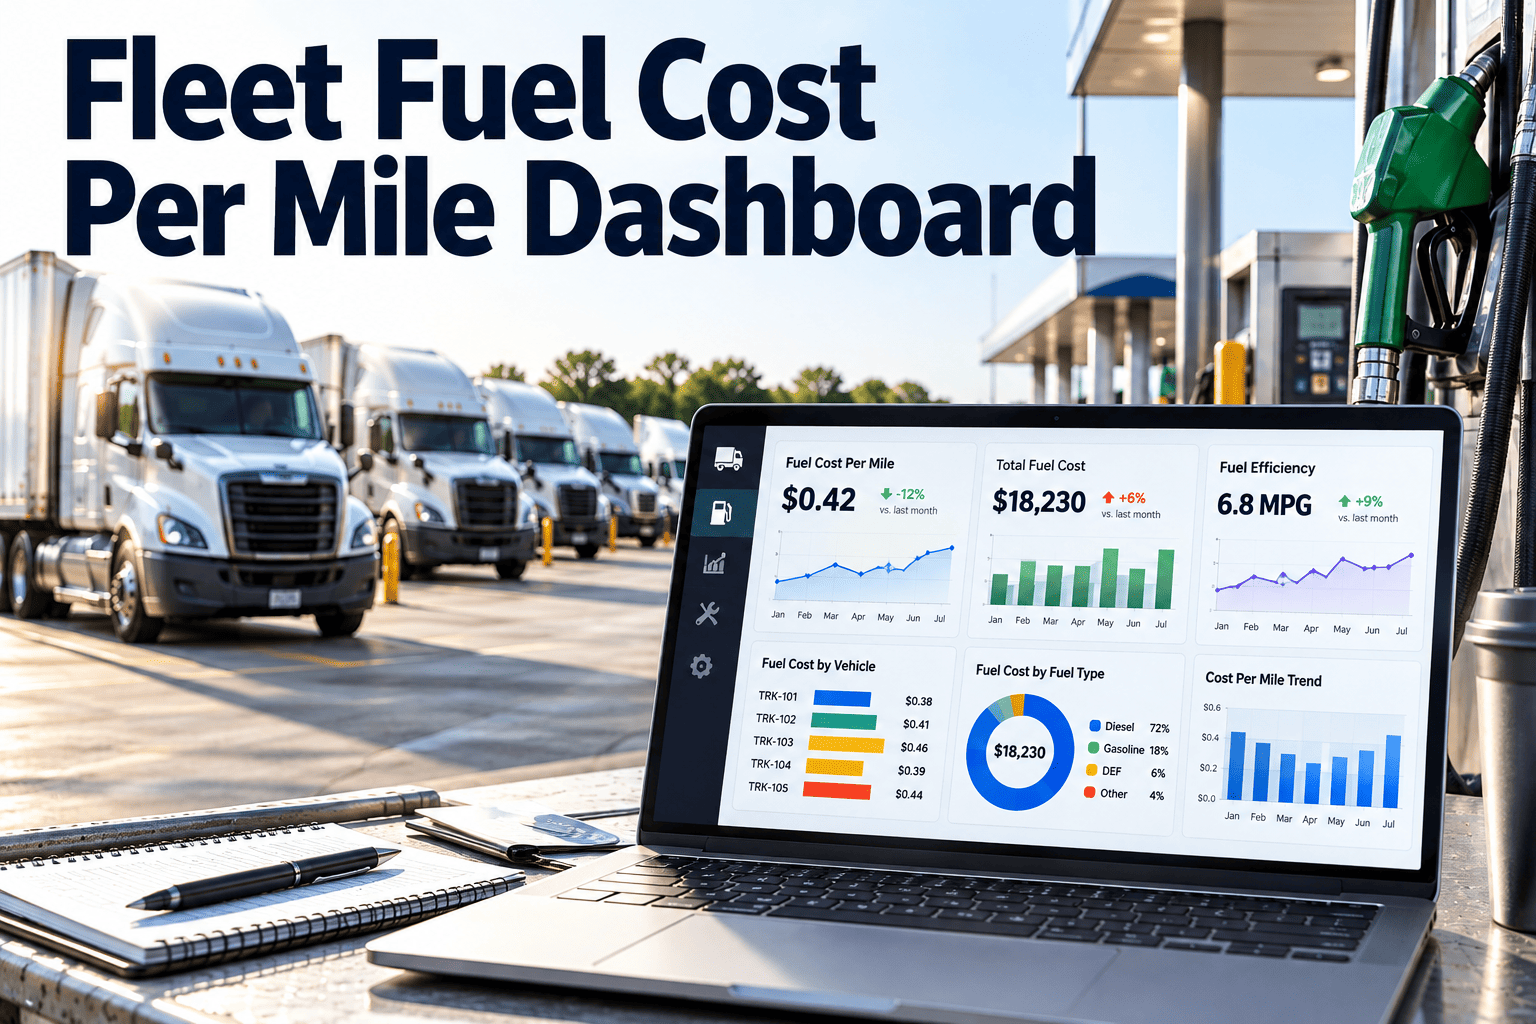
Fleet Fuel Cost Per Mile Dashboard: See Where Every Mile Costs You More
Fuel spend rises quietly when tires run soft, filters clog and idling creeps up. Pair cost per mile with maintenance records so a bad number becomes a work order, not a debate.
Unit 214On target
Unit 231Drifting up
Unit 118Inspect now
What a Cost Per Mile Dashboard Actually Measures
The formula is simple. The value comes from slicing it correctly and keeping the inputs clean.
- Fuel spend from fuel cards, bulk tank issues and receipts
- Miles from odometer readings, telematics or trip logs
- Engine hours for units where idle time matters more than distance
- Vehicle, route, driver, depot and season as filters
Bad inputs produce confident but wrong numbers. Missed odometer entries and unassigned fuel transactions are the most common causes.
Why Fuel Cost Per Mile Drifts
Operational causes
- Excess idling at depots, docks and job sites
- Route changes that add empty miles
- Aggressive acceleration, braking and speeding
- Heavier loads or towing beyond plan
- Fuel purchased at high-priced stations
Maintenance causes
- Under-inflated or misaligned tires
- Clogged air, fuel or oil filters
- Faulty oxygen sensors or injectors
- Dragging brakes and worn wheel bearings
- Missed fluid changes and overdue service
Most fleets manage the first list and overlook the second. Maintenance causes are the easiest to fix because they follow a repeatable procedure.
Maintenance Conditions That Raise Fuel Burn
Turn a Bad Fuel Number Into a Scheduled Fix
Track inspections, preventive tasks and work orders against each vehicle so fuel outliers lead straight to action.
Building the Dashboard: Five Views Worth Having
1
Fleet trend line
Rolling cost per mile by week and month. Compare against the same period last year to remove seasonal noise.
2
Vehicle ranking
Rank units within the same class. Compare a delivery van to another van, never to a tractor.
3
Outlier alerts
Flag any unit that deviates from its own baseline by a set percentage for a set period.
4
Route and depot view
Separate route effects from vehicle effects so you fix the right problem.
5
Maintenance overlay
Show recent service, overdue tasks and open defects on the same screen as fuel performance.
Data Quality Checklist
Every fuel transaction is tied to a specific vehicle
Odometer is captured at each fueling or daily inspection
Fuel type and unit of measure are consistent
Vehicle classes are defined before ranking begins
Tank fill events are separated from theft or leak suspicion
Engine hours are logged for idle-heavy equipment
Fuel card data should be reconciled against odometer readings. A jump in gallons with no change in miles deserves a look.
Reading the Signals: A Simple Decision Matrix
Signal
Likely owner
First action
One unit rising, peers stable
Maintenance
Inspect and review service history
Whole route group rising
Operations
Review route, load and schedule changes
Fleet-wide rise in winter
Planning
Compare with prior-year seasonal baseline
Rising cost, flat gallons
Procurement
Review fuel pricing and station choices
Before and After: Fuel Management Without and With Maintenance Data
Fuel data alone
- High cost per mile is noticed weeks later
- Drivers are blamed for vehicle problems
- Repairs are reactive and undocumented
- No link between service and fuel results
Fuel plus maintenance records
- Outliers trigger inspections quickly
- Causes are separated into driver, route and vehicle
- Fixes become tracked work orders
- Service impact on fuel use can be reviewed
Preventive Maintenance Tasks That Protect Fuel Efficiency
Daily
Walkaround inspection with tire condition, visible leaks, warning lights and odometer capture.
Weekly
Tire pressure verification, fluid level checks and review of open defects.
By interval
Oil and filter service, air filter inspection, tire rotation, alignment checks, brake inspection.
By condition
Sensor diagnostics, injector service and fuel system cleaning when data or fault codes indicate a need.
Follow the manufacturer service schedule for your specific vehicles, and adjust intervals based on duty cycle and your own inspection history.
Where Oxmaint Fits in the Fuel Workflow
Oxmaint is a maintenance system, so it supports the maintenance side of the cost per mile picture. It does not replace your fuel card platform or telematics, and it works best when their data feeds your review process.
Asset records keep each vehicle, class, meter reading and service history in one place.
then
Inspections capture tire, leak and defect findings from drivers on mobile.
then
Preventive maintenance schedules filters, tires and alignment by meter or date.
then
Work orders assign corrective repairs when a unit is flagged as an outlier.
then
Reporting shows service cost, downtime and repair history per vehicle.
- Meter-based scheduling so tasks follow actual miles, not guesses
- Parts and inventory tracking so filters and tires are in stock when needed
- Vehicle history that shows whether a repair coincided with a change in fuel performance
- Dashboards that put overdue tasks next to high-cost units
KPIs to Sit Beside Fuel Cost Per Mile
PM compliance
Share of preventive tasks completed on time. Low compliance often precedes rising fuel cost.
Inspection defect rate
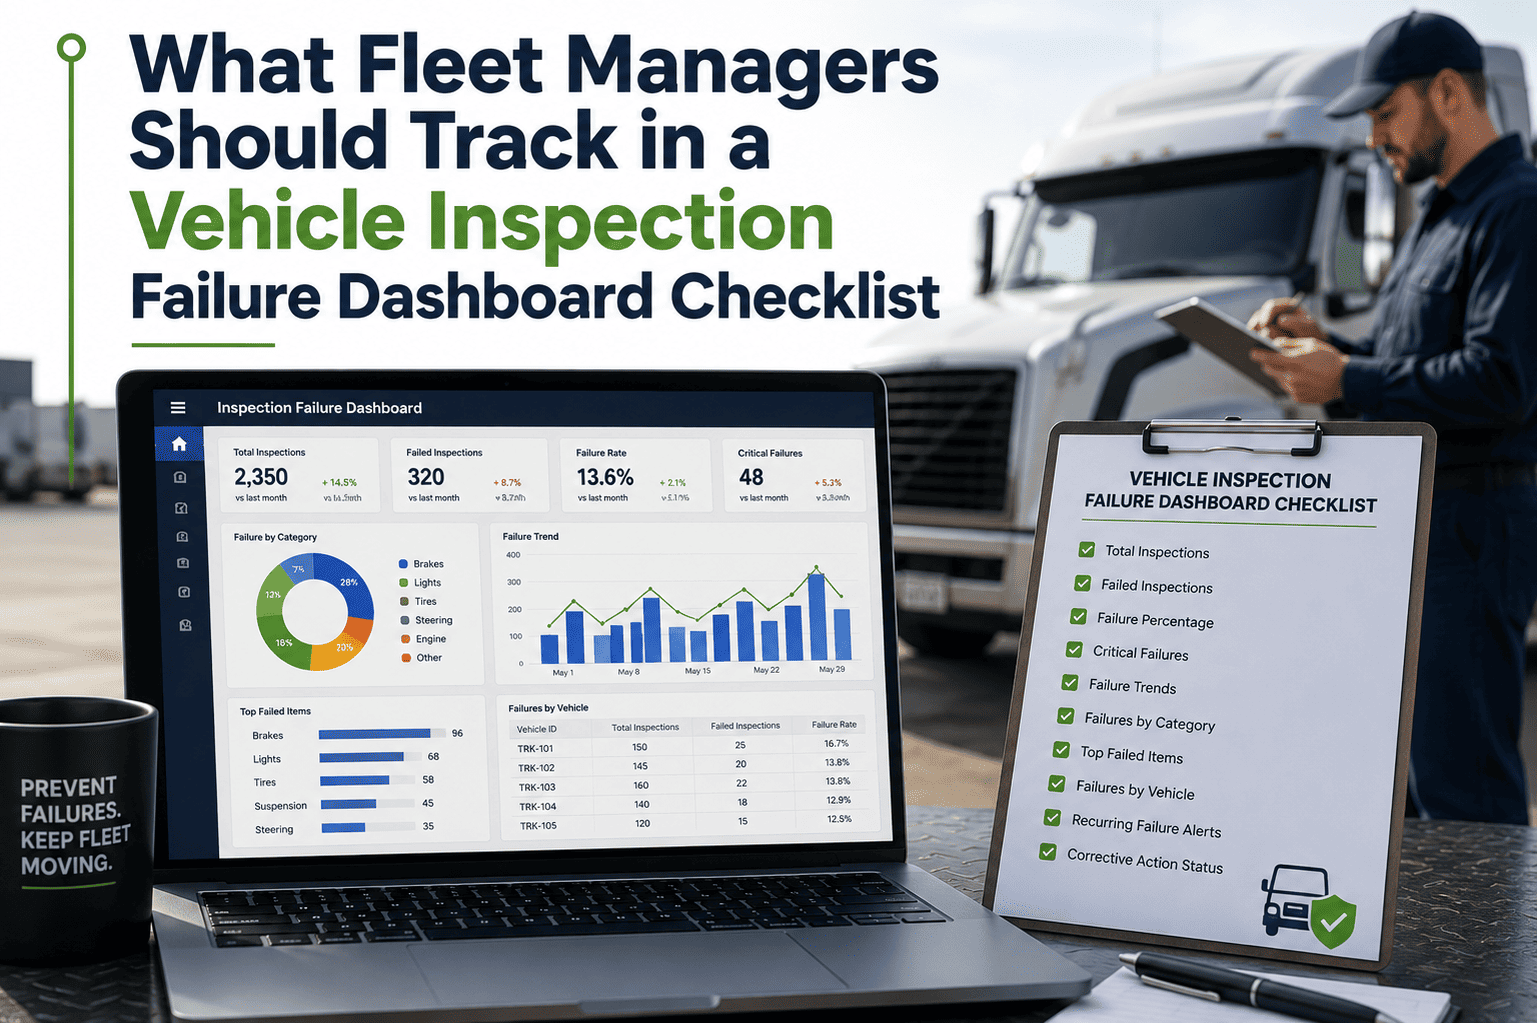
Defects found per inspection. Shows whether small issues are caught early.
Repeat repairs
Vehicles returning for the same fault, often a sign of an unresolved root cause.
Idle percentage
Engine hours without movement. Useful for coaching and policy decisions.
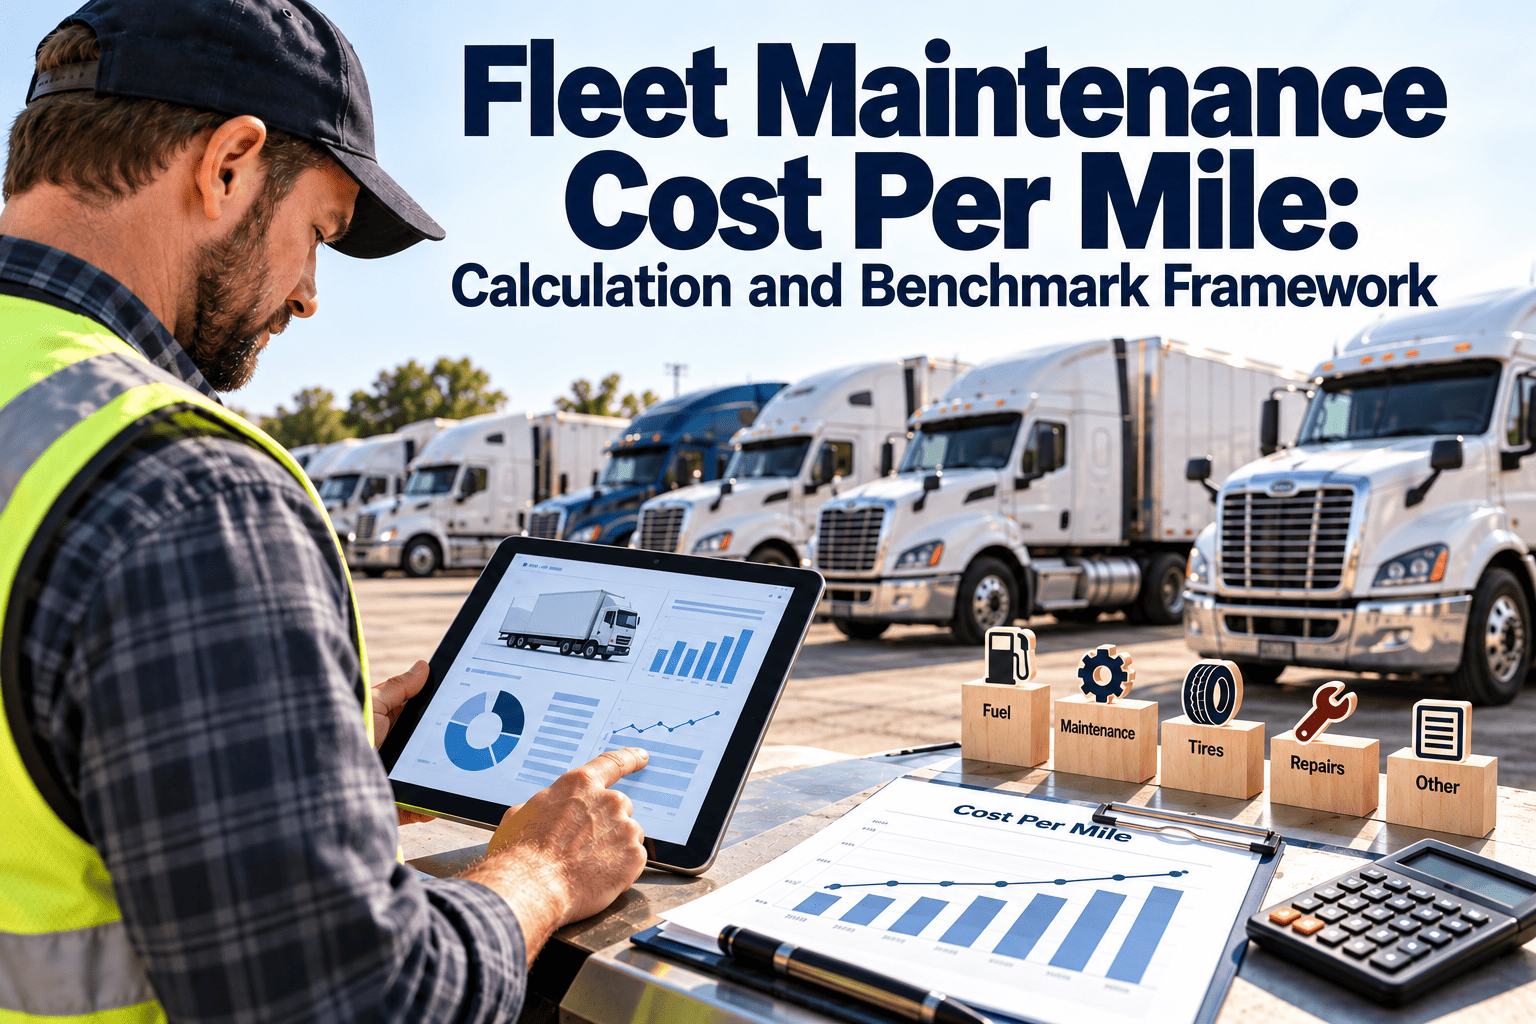
Total cost per mile
Fuel plus maintenance, tires and downtime, so cheaper fuel does not hide costly repairs.
Common Mistakes When Building Fuel Dashboards
- Comparing unlike vehicles, which punishes heavy-duty units unfairly
- Using monthly averages only, which hides sudden failures
- Treating every outlier as a driver problem before checking the vehicle
- Ignoring seasonal effects such as winter blends, cold starts and heater use
- Setting alert thresholds so tight that teams stop responding
- Failing to record the repair that fixed the problem, so learning is lost
A dashboard nobody acts on is only a report. Assign an owner to each alert and close it with a documented outcome.
A Practical 30-Day Rollout Plan
Week 1
Clean asset lists, define vehicle classes and confirm fuel transactions match units.
Week 2
Establish baselines per unit and add odometer capture to daily inspections.
Week 3
Set outlier thresholds, assign alert owners and link alerts to work order templates.
Week 4
Review results, adjust thresholds and add fuel-critical tasks to preventive schedules.
Frequently Asked Questions
How do you calculate fleet fuel cost per mile?
Divide total fuel spend by miles driven for the same vehicles and period. Use consistent odometer or telematics data for accuracy.
Why does one vehicle cost more per mile than similar units?
Common causes are tire pressure, alignment, clogged filters or faults. An inspection and
work order can confirm the cause.
Can maintenance improve fuel economy?
Yes, when it addresses conditions that raise fuel burn, such as tires, filters and sensors. Results depend on vehicle and duty cycle.
Does Oxmaint replace fuel card or telematics software?
No. It manages the maintenance workflow around those signals. You can
book a demo to review your setup.
What should be tracked next to fuel cost per mile?
Preventive maintenance compliance, repeat repairs, inspection defects, idle time and total cost per mile give the fullest picture.
Connect Every Fuel Outlier to a Maintenance Action
Give your fleet one place for inspections, preventive schedules, work orders and vehicle history, so cost per mile improves through repeatable maintenance.