Most fleet operations don't have a data problem — they have a decision problem. Telematics units and CMMS logs generate thousands of readings every single day: engine hours, fault codes, fuel burn, idle time, harsh-braking events, and odometer drift. Yet in front-line workshops, almost none of it changes what a technician actually does that morning. Dashboards get built, exported, and quietly ignored while the same trucks keep breaking down on the same schedule every quarter. The real gap isn't measurement, it's the missing link between what the data says and what someone does next, and closing that gap is exactly what turns fleet data into decisions your team acts on the same day — book a demo to see it work on your own fleet.
Fleet Analytics — Actionable Insight
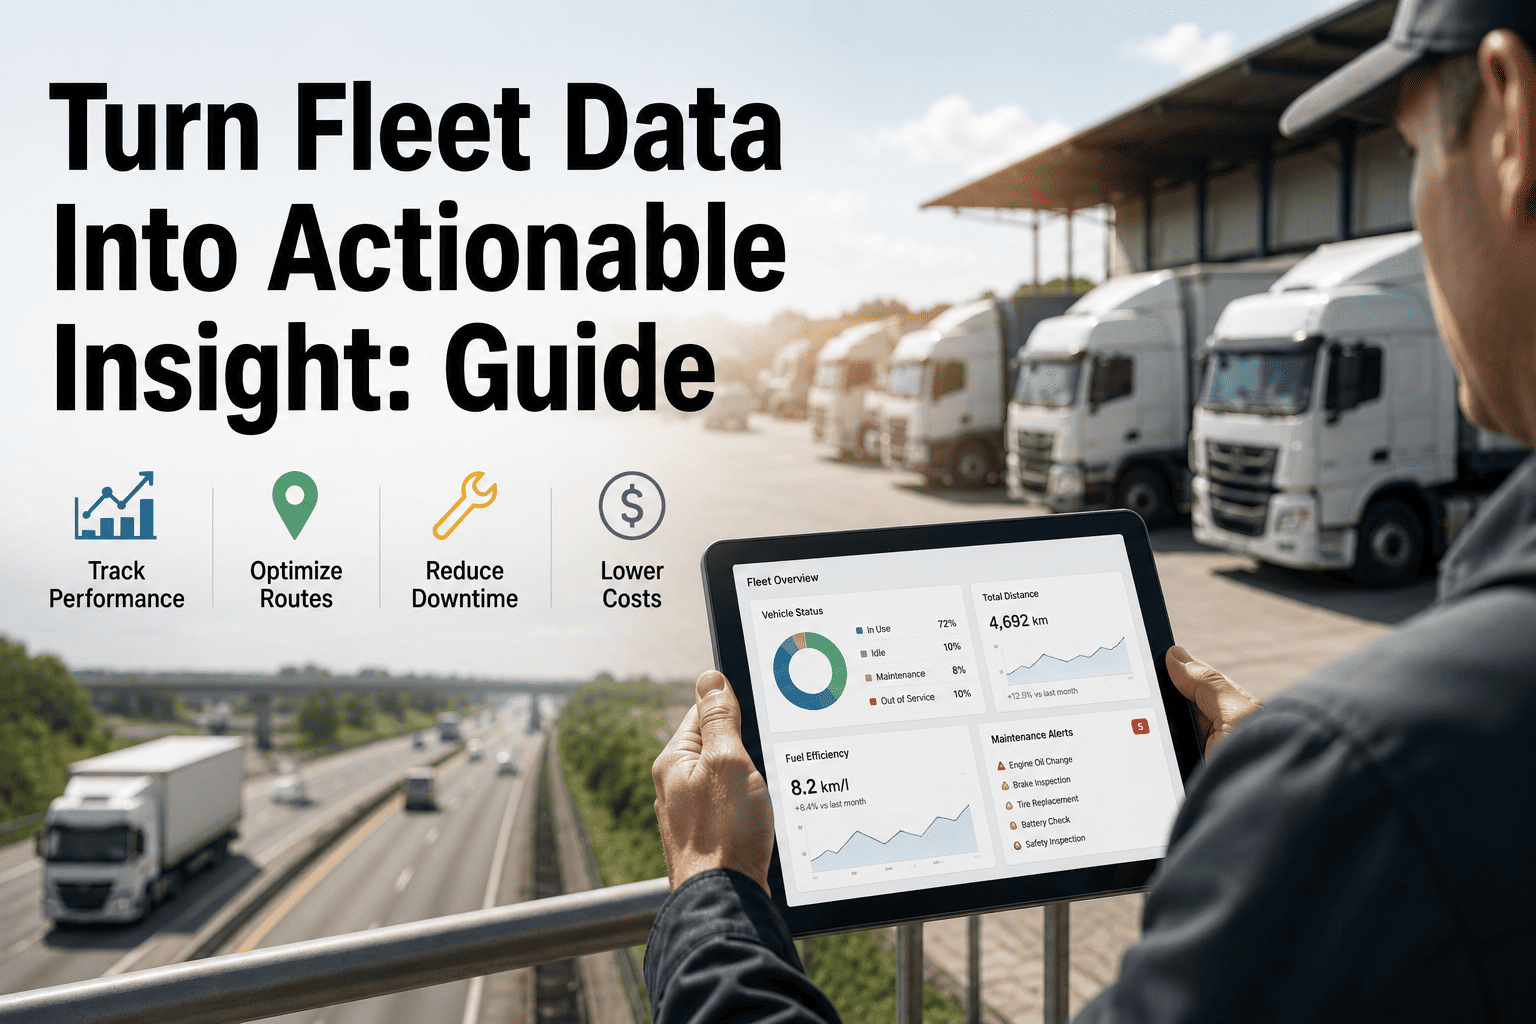
Turn Fleet Data Into Actionable Insight, Not Just Reports
OxMaint connects telematics, maintenance history, and fuel logs into one decision engine, so every anomaly automatically becomes a prioritized work order instead of a line item sitting in a spreadsheet nobody opens. Fleet data insight only matters when it changes what happens on the shop floor the same day it's detected.
Data Ingestion
Telematics, fuel cards & sensor feeds
Decision Triggers
KPI thresholds mapped to action
Work Order Automation
Fault-to-task in real time
Fleet Reporting
Utilization & cost visibility
10M+Fleet data points processed daily
24/7Continuous KPI monitoring
Same-DayAlert-to-work-order turnaround
ZeroManual dashboard building
Why Fleet Data Keeps Piling Up Without Driving Action
Every fleet manager has lived this cycle: a telematics platform gets rolled out with big promises, dashboards fill up with charts, and within a few months almost nobody logs in except during an audit. The data was never the problem — the absence of a bridge between insight and execution was. When a fault code, a fuel-efficiency dip, or a harsh-braking pattern doesn't automatically become a task someone owns, it simply becomes noise competing for attention against everything else on a manager's desk. Fleet analytics that stop at visualization leave the actual decision-making to whoever has the time to dig through a report, which in a busy operation is almost nobody. True fleet data intelligence has to close that loop on its own, converting a raw signal into an owned, deadline-driven task before it ever reaches a human inbox.
Where Fleet Data Insight Breaks Down
Data Overload
40+ Metrics
Telematics platforms surface dozens of metrics per vehicle with no ranking of what actually needs attention first.
Dashboard Fatigue
Ignored
Reports built for compliance get opened once a month, long after the underlying issue has already cost money.
Disconnected Systems
Siloed
Telematics, fuel cards, and maintenance logs live in separate tools, so no single view ever tells the full story.
Delayed Response
Days-Weeks
By the time a manual review catches a pattern, the vehicle has often already broken down on the road.
Reactive Maintenance
Costly
Without triggers tied to real usage data, repairs happen after failure instead of ahead of it.
Fleet Signals That Should Never Sit Unread
Not every data point deserves the same attention, but certain signals almost always predict a costly failure if they're left in a report instead of turned into a task. Recognizing these patterns early is the difference between a scheduled repair and a roadside breakdown that takes a vehicle out of service for days.
Engine & Fault Codes
Recurring diagnostic trouble codes on the same component
Rising coolant or oil temperature trends over several weeks
Battery voltage drift ahead of a cold-start season
These are classic early-warning signs that a component is degrading, not yet failed.
Fuel & Route Behavior
Sudden fuel efficiency drop unrelated to route or load
Excess idle time clustering around specific drivers or yards
Fuel card purchases that don't match logged mileage
Left unreviewed, these patterns quietly erode margin month after month.
Driver & Safety Events
Repeated harsh braking or acceleration on the same route
Inspection deadlines approaching without a scheduled slot
Speeding events clustering during specific shift windows
These signals protect both driver safety and long-term insurance costs.
Stop Drowning In Fleet Reports
OxMaint turns telematics signals into ranked, owned work orders automatically, so your team spends its day fixing vehicles instead of scrolling dashboards.
The Dashboard-To-Action Workflow That Makes Data Actionable
Turning fleet data into actionable insight is a workflow, not a feature. It requires collecting the right signals, analyzing them against defined thresholds, triggering a response the moment a threshold is crossed, and closing the loop with a technician who actually completes the task. Below is how that workflow runs inside a connected fleet CMMS, from the moment a sensor reports a reading to the moment a repair is logged and verified against the original alert.
From Raw Telemetry To Completed Work Order
Unified Data Capture
Telematics, Fuel & Maintenance Logs
Pulls GPS, engine, and fault-code data directly from OEM and third-party telematics.
Merges fuel card transactions with mileage to flag inefficiency automatically.
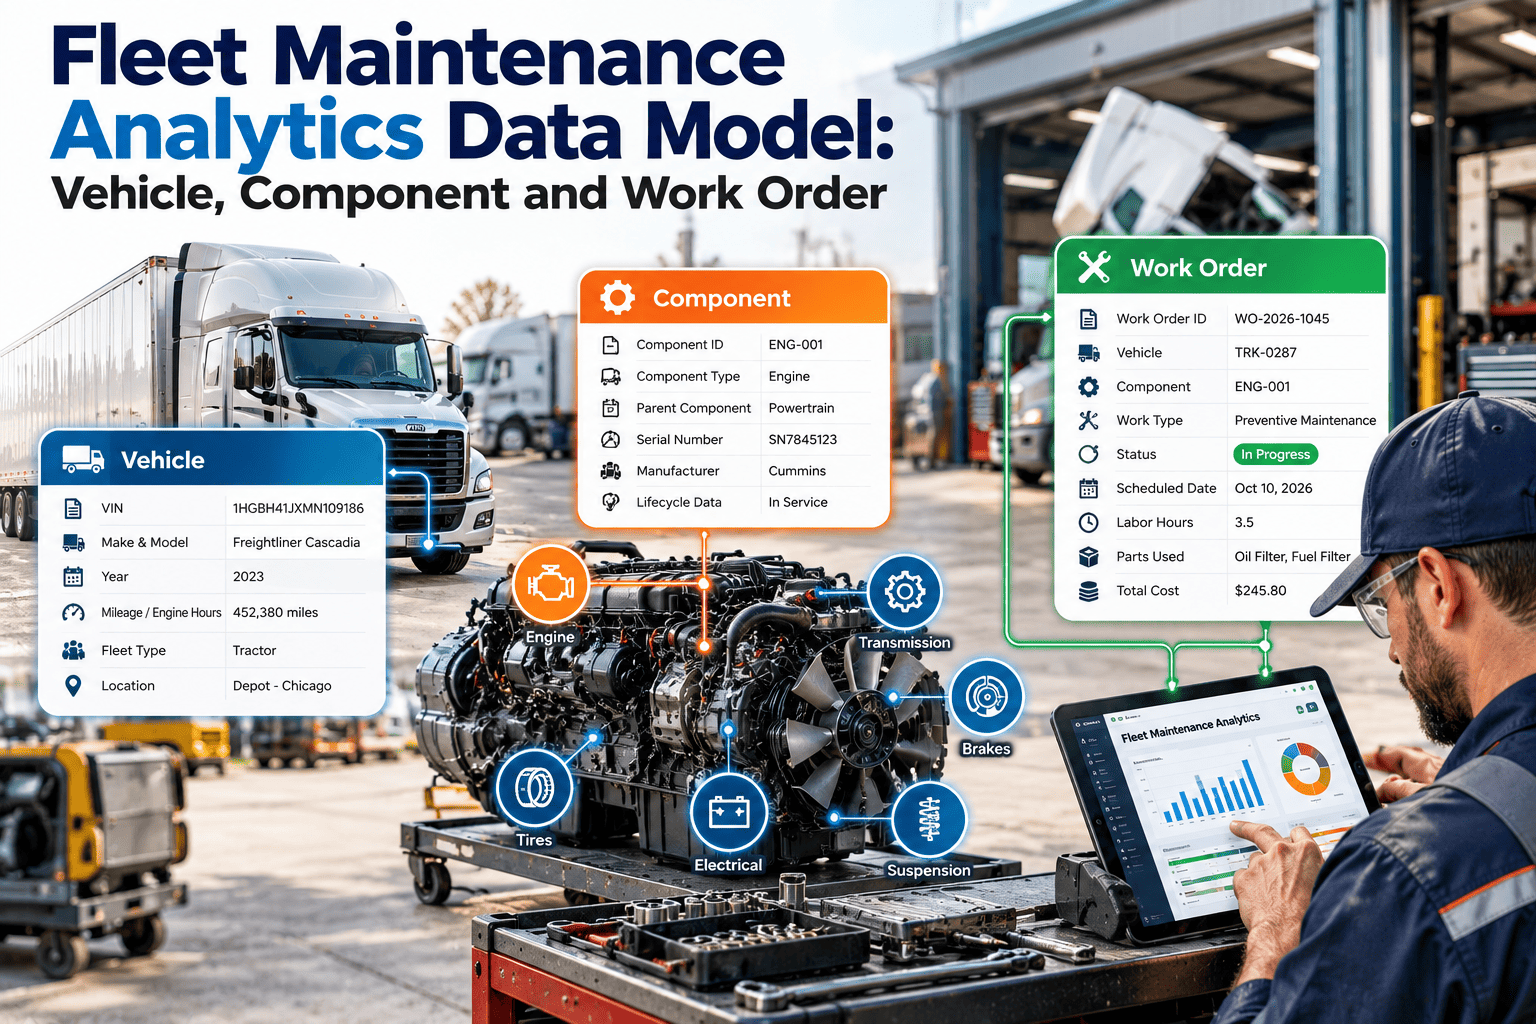
Links every data stream back to a specific vehicle's full maintenance history.
Decision-Support Analytics
Pattern Detection & Benchmarking
Compares live readings against fleet-wide and asset-specific baselines.
Surfaces recurring fault patterns across vehicle makes, models, and routes.
Ranks issues by cost, downtime risk, and safety impact, not just recency.
KPI-Triggered Escalation
Thresholds That Convert Into Tasks
Every KPI breach — fuel dip, DTC code, idle spike — auto-generates a work order.
Escalation rules route urgent issues straight to a supervisor's mobile device.
Priority scoring keeps the most costly problems at the top of the queue.
Closed-Loop Execution
Technician Dispatch & Verification
Technicians receive mobile work orders with the exact fault data attached.
Completed repairs feed straight back into the dataset, refining future thresholds.
Managers see resolution time and cost impact on a single fleet dashboard.
Fleet Dashboards Versus An Actionable Insight Platform
Most fleets already have a dashboard. Very few have a system that converts what the dashboard shows into work that gets done. The table below breaks down the practical difference between the two approaches across the stages that matter most to a maintenance team's daily routine.
| Capability |
Standalone Telematics Dashboard |
OxMaint Actionable Insight Platform |
| Data collection |
Single-source, telematics only |
Telematics, fuel, and maintenance combined |
| Fault detection |
Displayed as a code on a screen |
Auto-classified and prioritized by impact |
| Response time |
Depends on someone checking the report |
Same-day, automated work order creation |
| Work order creation |
Manual, entered separately |
Generated directly from the triggering data |
| Historical reporting |
Static exports, manually compiled |
Live, audit-ready fleet performance history |
| Decision support |
Requires manual interpretation |
Ranked recommendations built into the workflow |
A scrollable comparison is useful, but the deeper point is structural: a dashboard is a place you go to look for problems, while an actionable insight platform is a system that comes to you the moment a problem exists. That distinction is what separates fleets that treat analytics as a compliance checkbox from fleets that treat it as a daily operating tool.
Who Actually Uses Fleet Data Insight Day To Day
Actionable fleet analytics doesn't serve one role — it changes the daily routine for everyone from the shop floor to the finance office. Each role interacts with the same underlying data, just through a different lens tailored to what they're responsible for.
Fleet Managers
Fleet-wide health scores instead of vehicle-by-vehicle checking
Ranked priority queues for the week's maintenance planning
Cost trends by vehicle class to guide replacement decisions
Spend less time chasing status updates and more time planning ahead.
Technicians
Mobile work orders with the exact fault data attached
Repair history for the vehicle pulled up automatically
Clear priority so urgent jobs never get buried
Less time diagnosing from scratch, more time actually fixing.
Safety & Finance Teams
Continuous compliance logs ready for any audit request
Driver behavior trends tied to insurance and risk reviews
Cost-per-mile reporting broken down by vehicle and route
Numbers that hold up under scrutiny without a manual pull.
The Three Pillars Of Actionable Fleet Analytics
Data becomes genuinely useful when it's organized around the decisions a fleet actually needs to make — what to fix, what to fuel, and what to flag for safety. These three pillars form the backbone of every fleet data insight strategy that holds up under real operating pressure.
Maintenance Intelligence
Predictive fault detection from engine and sensor trends
Failure pattern tracking across similar vehicle classes
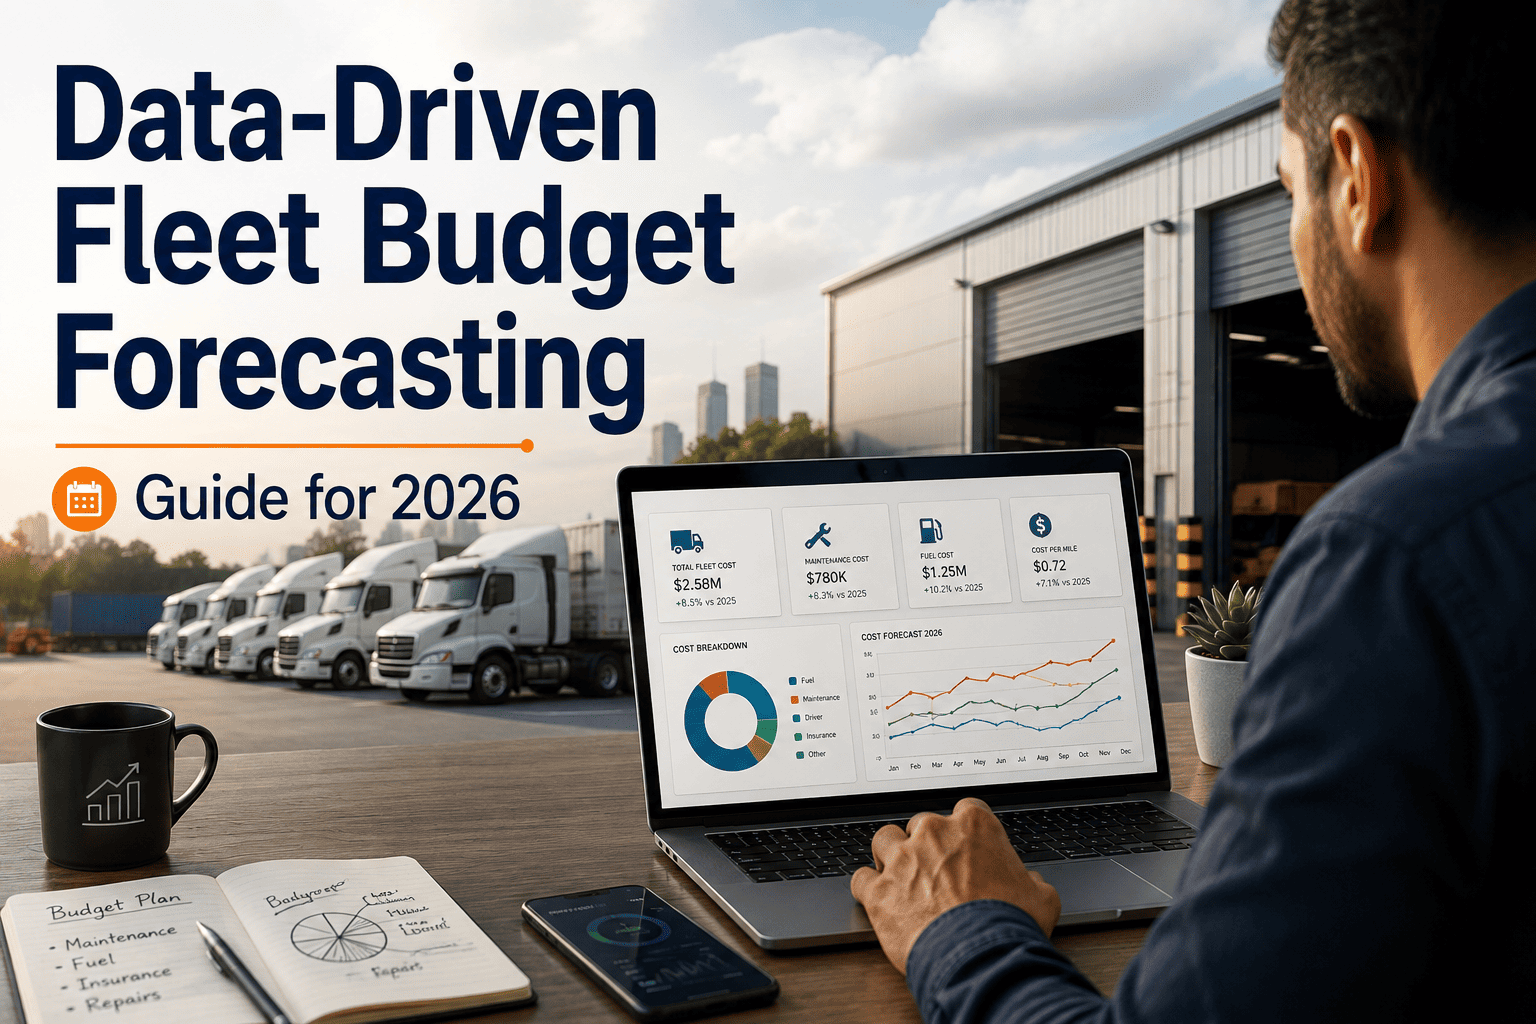
Parts and labor cost forecasting per asset
Turns wear-and-tear signals into scheduled repairs before a breakdown happens.
Fuel & Utilization
Idle time and route-efficiency comparisons
Fuel card reconciliation against actual mileage
Underused or overworked asset identification
Converts fuel spend and asset usage into direct utilization decisions.
Safety & Compliance
Harsh braking, speeding, and driver behavior trends
Inspection and certification deadline tracking
Audit-ready compliance logs generated automatically
Keeps every vehicle inspection-ready without a last-minute scramble.
See Your Fleet's Hidden Patterns
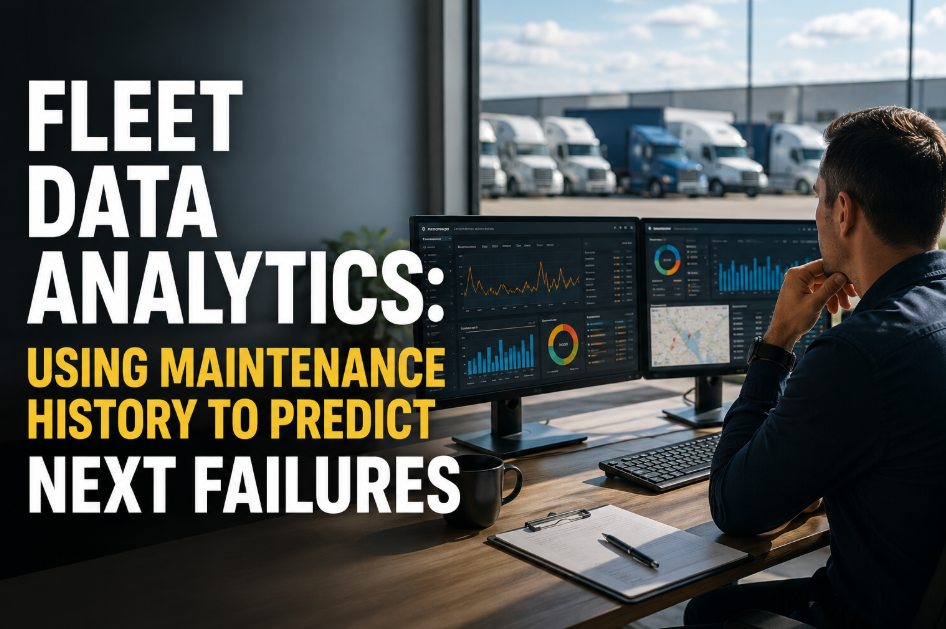
Most fleets are sitting on months of data that already shows which vehicles are about to fail. OxMaint surfaces those patterns before they become downtime.
Data Sources A Fleet CMMS Should Actually Connect To
Fleet data insight is only as good as the sources feeding it. A platform that only reads one telematics provider will always miss the parts of the picture that live in fuel systems, driver apps, and inspection logs. A useful fleet analytics setup pulls from everywhere the fleet already generates data, then organizes it around the vehicle rather than the source system, so a technician looking at one asset sees its full history in one place instead of jumping between five separate logins.
Data Sources Behind Actionable Fleet Insight
GPS & Telematics
Live
Location, engine hours, and fault codes streamed directly from OEM and aftermarket units.
Fuel Cards
Reconciled
Transaction data matched against mileage to catch inefficiency and unauthorized use.
ELD & Driver Apps
Behavioral
Hours of service, braking events, and route adherence tied back to individual drivers.
Inspection Logs
Scheduled
Certification and safety inspection deadlines tracked against every asset automatically.
Repair History
Structured
Every past work order feeding back into the model that decides what to flag next.
Deployment Roadmap: From Raw Logs To Daily Decisions
Building an actionable fleet analytics program doesn't happen overnight, but it also doesn't need to take a year. Most fleets move through five practical phases, each one narrowing the gap between data collection and decision-making. Fleets that skip straight to automation without a proper baseline usually end up with noisy alerts that get ignored just as quickly as the old dashboards were, so the sequence matters as much as the tools themselves.
01
Baseline & Data Audit
Review existing telematics, fuel, and maintenance records to establish accurate per-vehicle baselines before any automation begins, including a check for gaps in historical logs that could skew early alerts.
Planning
02
Telematics & Sensor Integration
Connect live data feeds from GPS units, OBD sensors, and fuel cards directly into the CMMS in one consolidated stream, so every vehicle profile reflects real-time status rather than end-of-week exports.
Active
03
KPI Threshold Configuration
Define what actually counts as an anomaly for each vehicle class, so alerts reflect real risk instead of generic defaults borrowed from a manufacturer's manual that doesn't account for your routes or climate.
Active
04
Automated Escalation Workflows
Route every triggered alert into a work order with the right priority, owner, and deadline attached automatically, and escalate anything untouched past its window straight to a supervisor.
Growth
05
Continuous Insight Refinement
Use completed work order outcomes to keep sharpening thresholds, so the system gets more accurate with every repair cycle and false alerts keep shrinking over time.
Advanced
What Changes Operationally Once Insight Becomes Action
The real test of any fleet data insight strategy isn't how the dashboard looks — it's whether downtime, fuel spend, and unplanned repairs actually move in the right direction over a full quarter. When alerts stop waiting for someone to notice them, the operational impact tends to show up in a few consistent places across the fleet, and those changes compound as the system keeps refining its own thresholds against real repair outcomes.
Operational Shifts Fleets Report After Going Actionable
Downtime
Reduced
Fewer roadside failures as early warning signals get addressed during scheduled maintenance windows.
Fuel Spend
Tighter
Idle time and route inefficiencies get flagged and corrected instead of quietly repeating every week.
Technician Time
Focused
Work orders arrive pre-prioritized, so technicians spend less time deciding what to look at first.
Audit Prep
Automated
Compliance history is logged continuously, removing the scramble before a scheduled inspection.
Asset Lifespan
Extended
Consistent early intervention keeps vehicles running longer between major overhauls.
What Fleet Managers Say About Making Data Actionable
We had telematics for three years before anything changed operationally. The data was always there, but it lived in a portal nobody outside the analytics team ever opened. Once we connected that same telemetry to OxMaint, every fault code and fuel anomaly started turning into a work order the same day it happened. Our unplanned downtime dropped noticeably within the first quarter, and for the first time our maintenance decisions were actually being driven by what the vehicles were telling us, not by who happened to notice a problem first. The biggest shift wasn't the technology itself — it was that our technicians stopped waiting for a manager to interpret a report and started acting directly on what the system already told them to do.
— Fleet Operations Manager, Regional Logistics Provider
Same-Day
Fault-to-work-order turnaround
Fewer
Unplanned roadside breakdowns
One View
Fuel, fault, and repair data combined
Automated
Audit-ready fleet reporting
Why Fleet Teams Choose OxMaint For Actionable Analytics
There's no shortage of telematics platforms promising fleet insight. What sets an actionable analytics platform apart is whether it was actually built around the maintenance workflow, not bolted onto one as an afterthought. OxMaint was built from the CMMS outward, which means every piece of fleet analytics inside it is designed to end in a completed work order rather than a chart export.
Built On A CMMS Core
Work orders, parts, and labor already live in the same system
No separate export step between insight and execution
One vehicle record instead of three disconnected tools
Analytics that were designed to trigger action, not just display it.
Flexible Integration
Connects to most major telematics and fuel card providers
Thresholds configured around your fleet, not a generic default
Mobile-first for technicians already working out of a truck
Fits into how your fleet already operates instead of replacing it.
Fast To Get Running
Onboarding built around your existing telematics feed
Guided threshold setup instead of a blank configuration screen
Support available through setup and the first alert cycle
Most fleets see their first automated work order within the setup week.
Frequently Asked Questions
What does it actually mean to turn fleet data into actionable insight?
It means every meaningful data point — a fault code, a fuel dip, a mileage anomaly — automatically becomes a prioritized task someone owns, instead of sitting in a report that requires manual review to interpret. The goal is a system that decides for you what matters first.
How is this different from the dashboards my telematics provider already gives me?
Telematics dashboards display data; they don't act on it. OxMaint layers a CMMS workflow on top, so the same signals your telematics already captures generate work orders, ownership, and deadlines automatically instead of requiring someone to log in and interpret a chart.
Can OxMaint combine fuel, maintenance, and telematics data in one place?
Yes. Fuel card transactions, telematics feeds, and maintenance history are merged into a single vehicle profile, so decisions are based on the full picture rather than one isolated data source that only tells part of the story.
Do we need a data science team to set up KPI-triggered escalation?
No. Thresholds are configured directly in the platform based on your fleet's own history, and the
OxMaint team helps set the initial baselines during onboarding so alerts reflect real risk from day one.
How long does it take to see decisions actually change after setup?
Most fleets see their first automated work orders within the initial setup week, since existing telematics data can be connected immediately without waiting on a lengthy migration —
start a free trial to see it against your own fleet.
Make Every Fleet Data Point Count
Stop letting telematics data sit in a dashboard nobody opens. OxMaint turns fuel, fault, and maintenance signals into the same-day decisions that keep your fleet on the road and your budget under control.