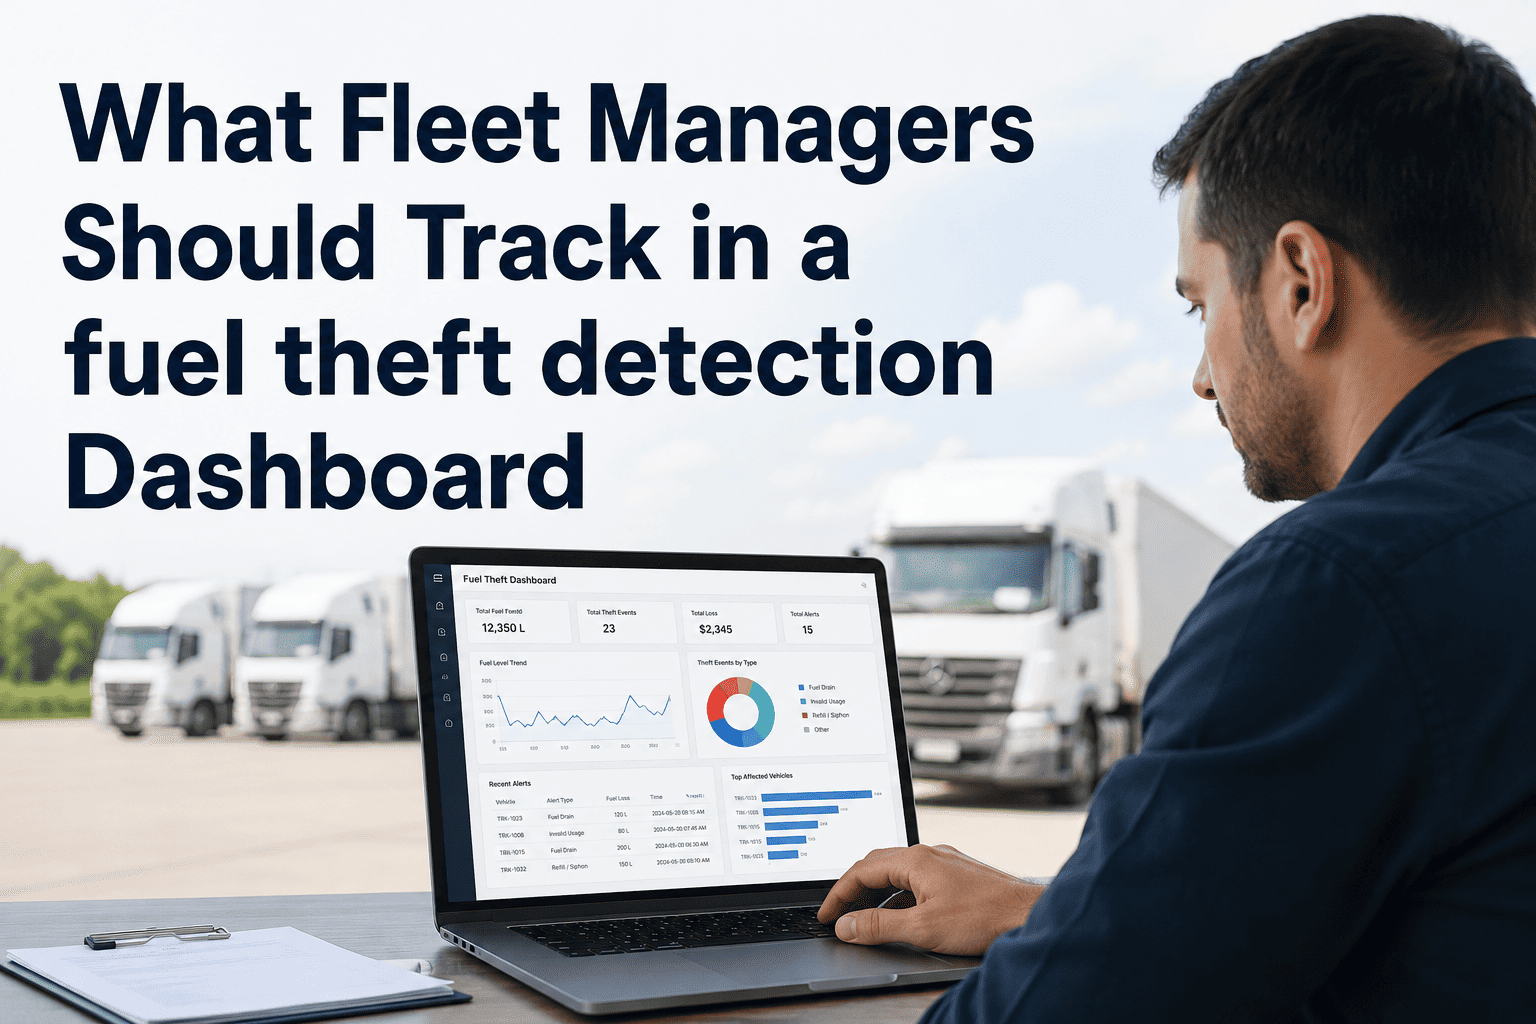
Fleet managers who rely on gut feel and end-of-month reports are flying blind in an era where the vehicles themselves are broadcasting real-time performance data. The global fleet management analytics market reached $8.2 billion in 2024 and is projected to hit $27.4 billion by 2031, growing at 18.8% CAGR — driven by a fundamental shift from reactive operations to data-led fleet management. Fleets leveraging real-time analytics reduce maintenance costs by 25–30%, cut fuel consumption by 10–15%, and improve vehicle uptime by up to 45% compared to fleets still operating on spreadsheets and manual reporting cycles. The data gap is not a technology problem anymore — it is a decision-making problem. Every fleet vehicle generates thousands of data points per hour covering engine health, fuel consumption, brake wear, idle time, route efficiency, and driver behavior. The question is whether your maintenance platform captures this data, analyzes it automatically, and surfaces the right insight to the right person before a preventable failure becomes an expensive breakdown. OxMaint's fleet CMMS connects vehicle sensor data, work order history, and operational records into a unified analytics layer that gives fleet managers the real-time intelligence and long-range forecasting capability their operations require. Sign up for OxMaint free and start measuring what your fleet is actually doing today.
$27.4B
Fleet Analytics Market by 2031 — growing at 18.8% CAGR from $8.2B in 2024
25–30%
Maintenance cost reduction achieved by fleets using real-time analytics vs. reactive baseline
45%
Fleet uptime improvement documented in data-driven operations versus manual reporting fleets
15%
Fuel consumption reduction achievable with real-time driver behavior and route analytics
Turn Your Fleet's Raw Data Into Actionable Performance Intelligence.
OxMaint connects vehicle sensor data, work order history, and operational records into a unified analytics platform — surfacing the KPIs, cost trends, and failure predictions your fleet management team needs to make decisions before problems become breakdowns. Free to start. Deploys in days.
What Fleet Performance Analytics Actually Covers
Fleet performance analytics is not a single dashboard or a monthly report. It is the continuous collection, analysis, and presentation of operational data across six distinct performance domains — each of which drives a different category of fleet cost and a different set of management decisions.
Maintenance Analytics
Work order velocity, preventive maintenance completion rates, mean time between failures (MTBF), repair cost per vehicle, and technician productivity. The data layer that separates reactive fleets from condition-based operations. Fleets tracking MTBF reduce emergency repairs by 60% within 12 months of deployment.
Fuel and Energy Analytics
Fuel consumption per vehicle and per route, idle time percentage, fuel cost per mile, and EV charging efficiency for mixed fleets. Idle time alone averages 25% of engine hours in commercial fleets — analytics-driven idle reduction programs recover this cost category systematically.
Vehicle Utilization Analytics
Asset utilization rates, available hours versus deployed hours, route efficiency scores, and load capacity usage. Under-utilized vehicles are hidden capital cost. Fleets using utilization analytics right-size their fleet by 8–12% on average — eliminating vehicles that carry depreciation without delivering operational value.
Driver Behavior Analytics
Harsh braking events, rapid acceleration frequency, speeding instances, seatbelt compliance, and distraction indicators. Driver behavior directly determines fuel consumption, brake wear rates, and accident risk. Data-driven coaching programs reduce accident rates by 20–30% and fuel costs by 8–12% per driver.
Compliance and Inspection Analytics
Inspection completion rates, defect rates by vehicle type, DVIR compliance percentages, and days since last inspection per vehicle. Compliance gaps that lead to CSA violations and out-of-service orders are entirely detectable through analytics before a roadside inspection surfaces them at the worst possible moment.
Total Cost of Ownership Analytics
Acquisition cost, cumulative maintenance cost, fuel cost, insurance cost, and depreciation tracked per vehicle over its full operational life. TCO analytics are the foundation of data-driven fleet replacement decisions — eliminating the CapEx guesswork that costs fleets $15,000–$40,000 per vehicle in poorly timed replacements.
The 8 Fleet Performance KPIs That Predict Cost and Uptime Outcomes
Not all fleet KPIs carry equal weight. These eight metrics are the leading indicators that separate high-performing fleets from those perpetually firefighting — each one measuring a dimension of fleet health that predicts future cost and availability outcomes before they materialize as breakdowns or budget overruns.
MTBF
Mean Time Between Failures
The average operating time between unplanned maintenance events per vehicle. The single most predictive metric for fleet reliability. Tracking MTBF by vehicle model reveals which assets are approaching end-of-economic-life before costs become unmanageable.
Reactive: untrackedOxMaint: per-vehicle MTBF trending
97%
Fleet Uptime Rate Target
The percentage of scheduled operating hours that vehicles are available for deployment. Industry-leading fleets achieve 97%+ uptime through predictive maintenance programs. Every 1% of uptime improvement in a 250-vehicle fleet recovers approximately 2,500 vehicle-hours annually.
Reactive: 88–92% typicalPredictive: 95–97% achievable
CPM
Maintenance Cost Per Mile
Total maintenance expenditure divided by miles driven, tracked per vehicle and per vehicle type. CPM trending identifies vehicles with accelerating maintenance cost trajectories — the early indicator of total cost of ownership crossing the replacement threshold before mileage or age do.
Manual: estimated from invoicesOxMaint: real-time CPM per vehicle
PM%
Preventive Maintenance Compliance Rate
The percentage of scheduled preventive maintenance work orders completed on time. Fleets achieving 90%+ PM compliance rates reduce emergency repair events by 35–45%. Every PM missed is a statistical multiplier on the probability of an unplanned breakdown event within the following 60 days.
Industry avg: 65–72% complianceTarget: 90%+ with automated WOs
Idle%
Idle Time as Percentage of Engine Hours
Commercial fleet idle time averages 25% of total engine hours — representing pure fuel cost with zero operational output. Every hour of idling consumes 0.8–1.0 gallons of diesel. Analytics-driven idle reduction programs target vehicle-specific idle reduction to recover this cost systematically.
Industry avg: 25% idle rateAnalytics target: under 10%
WOV
Work Order Velocity
The average time from work order creation to completion, broken down by work type (PM, corrective, emergency). Low WOV indicates technician capacity constraints or parts availability problems. Fleets using digital work order management reduce WOV by 28% versus paper-based or email-driven workflows.
Paper WO: 3–5 days averageDigital WO: under 2 days average
TCO
Total Cost of Ownership Per Vehicle
The complete lifecycle cost per vehicle: acquisition, maintenance, fuel, insurance, and disposal revenue. TCO analysis reveals the true cost of keeping aging vehicles versus replacement — a calculation that most fleets run annually at best and never at the individual vehicle level without a CMMS.
Manual: annual estimate onlyOxMaint: rolling TCO per vehicle
DPR
Defect Per Inspection Rate
The average number of defects identified per completed vehicle inspection, tracked by vehicle type and inspection type. Rising DPR on a specific vehicle model is the leading indicator of fleet-wide aging — providing the data foundation for proactive replacement planning before safety and compliance events force reactive decisions.
Paper inspections: not aggregatedDigital: real-time DPR trending
Why Most Fleets Fail to Act on Their Own Data
The data exists in most fleets. The failure is in the systems that should be transforming it into decisions. These are the four most common data utilization failures that prevent fleet analytics from delivering measurable outcomes — and how OxMaint addresses each one.
01
Data Lives in Too Many Disconnected Places
Maintenance costs are in one spreadsheet. Fuel data is in the fuel card provider's portal. Inspection records are on paper or in a separate app. Work orders are in a standalone system that doesn't talk to the asset registry. No single person has a complete view of any vehicle's performance because the data required to form that view is fragmented across four separate systems — none of which share data automatically.
02
Reporting Is Backward-Looking, Not Forward-Looking
Most fleet reports show what happened last month — maintenance spending, downtime events, fuel consumption. By the time these reports surface a problem, the problem has already cost money. Effective fleet analytics identify developing cost trajectories and failure patterns 4–8 weeks before they materialize as breakdown events, giving maintenance managers intervention time rather than post-mortem analysis.
03
KPIs Are Tracked at the Fleet Level, Not the Vehicle Level
Fleet-level averages hide the outliers that are driving costs. A 92% fleet uptime average can conceal three vehicles running at 78% uptime that are consuming 40% of maintenance spend. OxMaint tracks every KPI at the individual vehicle level — surfacing the specific assets that are degrading fleet-wide performance metrics without being visible in the aggregate numbers.
04
Analytics Tools Require Dedicated Analysts to Use
Complex BI tools require dedicated data analysts to build and maintain fleet dashboards — resources most fleet operations teams do not have. OxMaint delivers pre-built fleet performance dashboards that maintenance managers and fleet directors can use without data science expertise, surfacing the critical KPIs and trend alerts that require action without requiring configuration or query writing.
How OxMaint Delivers Fleet Performance Analytics That Drive Decisions
OxMaint is the unified layer that connects vehicle sensor data, work order records, inspection outcomes, parts consumption, and cost tracking into a single analytics platform — giving every stakeholder in the fleet operation the data they need, in the format they need it, without manual compilation.
Real-Time Fleet Health Dashboard
Live view of every vehicle's health score, maintenance status, open work orders, and upcoming PM due dates — across all locations in a single screen. Fleet directors see portfolio-level health; site managers see their facility's fleet; technicians see their assigned work queue. One platform, three levels of visibility, zero manual compilation.
Condition-Based Maintenance Triggers
Maintenance schedules driven by actual vehicle condition data — engine hours, fuel consumption anomalies, odometer readings, and sensor alerts — rather than fixed calendar or mileage intervals. Condition-based triggers eliminate the over-service waste (20–30% of interval maintenance) while catching the developing failures that fixed intervals miss between service windows.
Cost Per Vehicle Analytics
Complete maintenance cost tracking per vehicle — parts, labor, outside vendor costs, and emergency repair premiums — accumulated against each asset's service record. Automatically calculated maintenance cost per mile, per engine hour, and per year for every vehicle in the fleet. The data foundation for replacement timing decisions and annual budget justification.
Predictive Failure Alerts
Pattern recognition across IoT sensor data and historical repair records generates failure probability scores for critical components — flagging vehicles with developing failure signatures 2–8 weeks before the failure becomes a breakdown event. Automated work order creation from predictive alerts eliminates the manual step from detection to action.
5-Year CapEx Forecasting
Rolling replacement forecasting models built on each vehicle's actual condition score, cumulative maintenance cost trajectory, and industry-standard end-of-economic-life curves. Fleet directors access data-driven replacement timing recommendations per vehicle — replacing annual budget guesswork with a defensible, data-backed CapEx forecast for investor and ownership group reporting.
Multi-Site Portfolio Reporting
Cross-site fleet performance benchmarking that identifies which depot locations are driving the highest maintenance costs, lowest uptime rates, and lowest PM compliance rates — enabling targeted improvement programs at underperforming sites while sharing the operational practices of high-performing sites across the portfolio.
Fleet Analytics: Data-Blind Operations vs. OxMaint Intelligence
| Analytics Capability |
Without Fleet Analytics |
With OxMaint Analytics |
Impact |
| Failure Prediction |
Discovered when vehicle breaks down. 4–8x emergency repair cost applies. |
Detected 2–8 weeks early via sensor pattern analysis. Planned repair cost applies. |
75% cost reduction per event |
| Maintenance Scheduling |
Fixed mileage/calendar intervals. Over-services 20–30% of vehicles. Misses between-interval failures. |
Condition-based triggers from sensor data and IoT. Service when actual vehicle data indicates need. |
20–30% fewer unnecessary services |
| Cost Visibility |
Monthly invoice review. Fleet-level totals. No per-vehicle cost trend data. |
Real-time cost per vehicle, per mile, per engine hour. Trending alerts on accelerating cost trajectories. |
Full TCO visibility per asset |
| Fleet Uptime |
88–92% typical. Breakdowns unscheduled. Replacement vehicles required on short notice. |
95–97% achievable. Breakdowns converted to planned shop events. 5 pp uptime improvement. |
+5 pp uptime = 2,500 vehicle-hours/yr |
| CapEx Planning |
Annual budget estimate based on age and mileage. No vehicle-level condition data to support decisions. |
Rolling 5-year forecast per vehicle based on actual condition score and cost trajectory. |
Eliminates $15K–$40K poor replacement timing |
| PM Compliance |
65–72% industry average. Missed PMs discovered retroactively when breakdowns occur. |
90%+ with automated work orders and escalation alerts. Compliance tracked per vehicle in real time. |
35–45% fewer emergency repairs |
| Fuel Analytics |
Fuel card totals by vehicle. No idle time tracking. No consumption anomaly detection. |
Per-vehicle fuel consumption, idle time %, anomaly alerts, and driver behavior scoring integrated. |
10–15% fuel cost reduction |
| Reporting Speed |
Weekly manual compilation from multiple systems. 4–6 hours of management time per report cycle. |
Real-time dashboards. Automated report generation. Zero manual compilation for standard KPI reporting. |
4–6 hrs/week management time recovered |
30%
Maintenance cost reduction in year one of analytics-driven operations
45%
Fewer unplanned downtime events — failures caught before breakdown stage
220%+
First-year ROI documented across OxMaint fleet deployments
$2,000
Average annual savings per vehicle from data-driven maintenance and fuel optimization
Stop Managing Your Fleet From Last Month's Report. Start Operating With Real-Time Intelligence.
OxMaint delivers the fleet performance analytics, predictive maintenance alerts, CapEx forecasting, and multi-site reporting that fleet managers need to cut costs, improve uptime, and make data-driven decisions at every level of the operation. Free to start. Hardware-agnostic. Deploys in days.
Frequently Asked Questions — Fleet Performance Analytics
Common questions from fleet managers and operations directors evaluating data-driven fleet management platforms. Sign up free or book a demo to see OxMaint's fleet analytics live.
What data sources does OxMaint pull into its fleet performance analytics — and do we need new hardware?
OxMaint aggregates fleet performance data from four primary sources simultaneously — and for most modern fleets, no new hardware is required. Factory OEM telematics data from vehicles manufactured from approximately 2015 onward (Ford, Ram, Freightliner, Peterbilt, Kenworth, Volvo, Daimler) streams directly into OxMaint through OEM cloud APIs without additional hardware. Third-party GPS and telematics hardware from Geotab, Samsara, Verizon Connect, and Webfleet integrates through pre-built connectors. Fuel card data from major fuel card providers integrates to populate fuel consumption, cost, and idle time analytics per vehicle. Work order records, inspection outcomes, and parts consumption data captured by your maintenance team through the OxMaint mobile app complete the data picture — providing the maintenance cost analytics that telematics tools cannot generate independently. The result is a unified analytics layer covering vehicle health, fuel consumption, maintenance cost, inspection compliance, and total cost of ownership — without a new hardware installation project or a data integration project of your own.
Sign up free to assess your fleet's data sources, or
book a demo for a data integration walkthrough.
How quickly does OxMaint's fleet analytics start delivering actionable insights after deployment?
OxMaint delivers baseline fleet performance analytics from the first day of connected data collection, with insight quality increasing progressively as historical data accumulates. From day one, you receive real-time fleet health scores per vehicle, live work order status, PM compliance rates, and open maintenance alerts. Within 30 days, OxMaint has enough repair history and sensor data to generate maintenance cost per vehicle trending, initial MTBF calculations by vehicle model, and fuel consumption benchmarks. Within 60–90 days, OxMaint's predictive analytics layer achieves 90%+ accuracy in failure prediction using fleet-specific data patterns learned from your vehicles' actual operating profiles — including the cross-parameter sensor correlations that indicate developing failures weeks before they become visible as individual threshold breaches. The most commonly reported first insight from new OxMaint fleet deployments is identifying 3–5 vehicles with significantly higher-than-average maintenance costs that were invisible in the fleet-level totals managers had been reviewing. These outlier vehicles typically account for 25–40% of fleet maintenance spend despite representing 5–10% of the fleet by count.
Book a demo to see a live analytics dashboard, or
sign up free to start collecting your fleet's baseline data today.
How does fleet performance analytics support CapEx planning and vehicle replacement decisions?
OxMaint's CapEx forecasting module transforms fleet replacement decisions from annual budget estimate exercises into data-driven analyses grounded in each vehicle's actual condition and cost trajectory. The module tracks three leading indicators per vehicle that determine replacement timing more reliably than age or mileage alone. Maintenance cost acceleration — the rate at which a vehicle's per-mile or per-hour maintenance cost is increasing over time — is the strongest predictor of approaching end-of-economic-life in commercial fleet vehicles. A vehicle with a 35% year-over-year maintenance cost acceleration rate is approaching the replacement threshold regardless of its age, while a well-maintained older vehicle with flat cost trends may be years from the same threshold. Condition score degradation — the rate at which vehicle inspection defect rates and sensor health scores are declining — provides a second independent signal of approaching replacement need. TCO crossover point — the specific point at which the accumulated cost of maintaining an aging vehicle exceeds the cost of replacing it with a newer asset — is calculated per vehicle in OxMaint using actual maintenance cost records, current market replacement cost data, and projected continuation of the current cost trajectory. Fleet directors using OxMaint's CapEx forecasting report replacing the right vehicles at the right time — eliminating both the premature replacements that waste residual vehicle value and the delayed replacements that run aging vehicles into high-cost final operating years.
Sign up free to activate CapEx forecasting for your fleet, or
book a demo to see replacement timing analytics in action.
Can OxMaint deliver fleet performance analytics across multiple depot locations from a single dashboard?
OxMaint is built as a multi-site analytics platform — a single deployment covers all depot locations in your portfolio under a unified fleet performance dashboard, with site-specific drill-down capability for location-level analysis. The cross-site dashboard aggregates fleet health scores, maintenance cost trends, PM compliance rates, fuel consumption benchmarks, and vehicle availability rates across every site simultaneously — giving fleet directors portfolio-level visibility that most fleets currently achieve only through quarterly manually compiled reports, if at all. The multi-site analytics layer enables performance benchmarking between depot locations — identifying which sites are driving the highest emergency repair rates, which have the lowest PM compliance, and which have the best uptime outcomes. This benchmarking capability consistently delivers actionable insights that are impossible to surface from per-site reporting alone: a specific depot consistently outperforming the fleet average in maintenance cost per mile can be studied to identify the practices — technician training quality, inspection discipline, PM scheduling rigor — that can be transferred to underperforming sites. For fleet organizations with 2–50+ depot locations, OxMaint's multi-site analytics replaces the quarterly manual cross-site reporting exercise with a live dashboard that surfaces the same insights continuously and automatically.
Book a demo to see multi-site fleet analytics running with real data, or
sign up free to configure your multi-site fleet today.
What ROI should fleet managers realistically expect from investing in performance analytics?
Documented first-year ROI from fleet performance analytics deployments through OxMaint ranges from 220% to 580%, with the range driven by fleet size, the proportion previously operating in reactive maintenance mode, and fuel spend as a proportion of total operating cost. The five independently measurable ROI components are: emergency repair cost reduction (shifting 60% of emergency repairs to planned maintenance generates immediate savings at the planned-versus-emergency rate differential of 4–8x), unplanned downtime elimination ($1,500–$3,000 direct cost per avoided roadside breakdown plus lost revenue and customer impact), fuel cost reduction (10–15% reduction from idle time management and driver behavior coaching), recovered management time (4–6 hours per week eliminated from manual KPI compilation and cross-system data reconciliation), and CapEx optimization (replacing vehicles at the data-driven optimal timing point eliminates $15,000–$40,000 per vehicle in premature replacement waste or extended end-of-life operating losses). For a 100-vehicle fleet, documented outcomes include 30% reduction in total maintenance cost ($300,000–$450,000 annual saving depending on vehicle type), 45% reduction in unplanned downtime events, and 97% fleet uptime versus a 91% pre-deployment baseline. The platform cost for a fleet of this size typically represents 8–12% of the documented annual savings — delivering an 8–12x return on the analytics platform investment in the first year alone.
Sign up free to begin your ROI measurement baseline, or
book a demo for a custom ROI estimate using your fleet's current operational data.
How does OxMaint handle fleet performance analytics for mixed ICE and electric vehicle fleets?
OxMaint manages mixed ICE and EV fleet analytics from a single unified dashboard, with EV-specific performance metrics tracked alongside traditional vehicle KPIs without requiring a separate EV management tool. For electric vehicles, OxMaint tracks battery state-of-health progression over charging cycles, charging efficiency rates, thermal management performance, regenerative braking system health, range per charge trending, and energy cost per mile — the EV-specific analytics that ICE-focused fleet management platforms cannot generate. Battery degradation analytics are particularly high-value for fleet operators adding EVs to commercial operations. An EV battery pack losing efficiency at an accelerating rate generates range reduction that impacts operational planning before it becomes a maintenance event — OxMaint's battery health trending surfaces this degradation trajectory weeks before it affects dispatch planning, enabling corrective charging protocol adjustments that extend battery service life by 20–35%. For fleets transitioning from ICE to EV across a multi-year replacement program, OxMaint provides side-by-side TCO comparison analytics — tracking the total cost of ownership for ICE vehicles currently in service against the emerging EV TCO data from early replacement assets, giving fleet directors the data foundation for accelerating or moderating the EV transition based on actual operational cost evidence from their own fleet rather than manufacturer projections.
Book a demo to see OxMaint's mixed ICE/EV analytics dashboard, or
sign up free to connect your first vehicles today.
Fleet Performance Analytics Is No Longer Optional. The Fleets That Deploy Now Build an Advantage That Compounds Every Quarter.
Join 1,000+ fleet operations already using OxMaint to replace manual reporting with real-time analytics, condition-based maintenance, and data-driven CapEx planning. Free to start. Hardware-agnostic. Deploys in days. See measurable results within the first 30 days of connected data.