Fleet maintenance reports are only as dependable as the data model underneath them. When vehicles, components, and work orders are stored in different shapes, simple questions such as cost per unit or repeat repair rate take days to answer. A defined analytics data model fixes that by agreeing on what a record is, how it connects, and how each metric is calculated. This guide covers the core entities, relationships, and measures, with notes on how a fleet maintenance CMMS supplies the underlying records.
Fleet Maintenance Analytics Data Model: Vehicle, Component and Work Order
Design a clean structure that connects vehicle, component, and work order data, so every cost, downtime, and reliability metric can be trusted and repeated.
(fact) Failure code Technician Vendor and part
Why fleet reports disagree with each other
- Repair descriptions are free text, so similar failures cannot be grouped
- Labor and parts are posted at different levels of detail
- Vehicle attributes are stored on each work order, so they drift
- Downtime is estimated from memory rather than timestamps
- Each report defines MTBF or PM compliance differently
- Failure, system, and action codes come from controlled lists
- Labor and parts post at the work order line level
- Vehicle and component attributes live in master records
- Status changes are timestamped to compute downtime
- Metric definitions are written once and reused
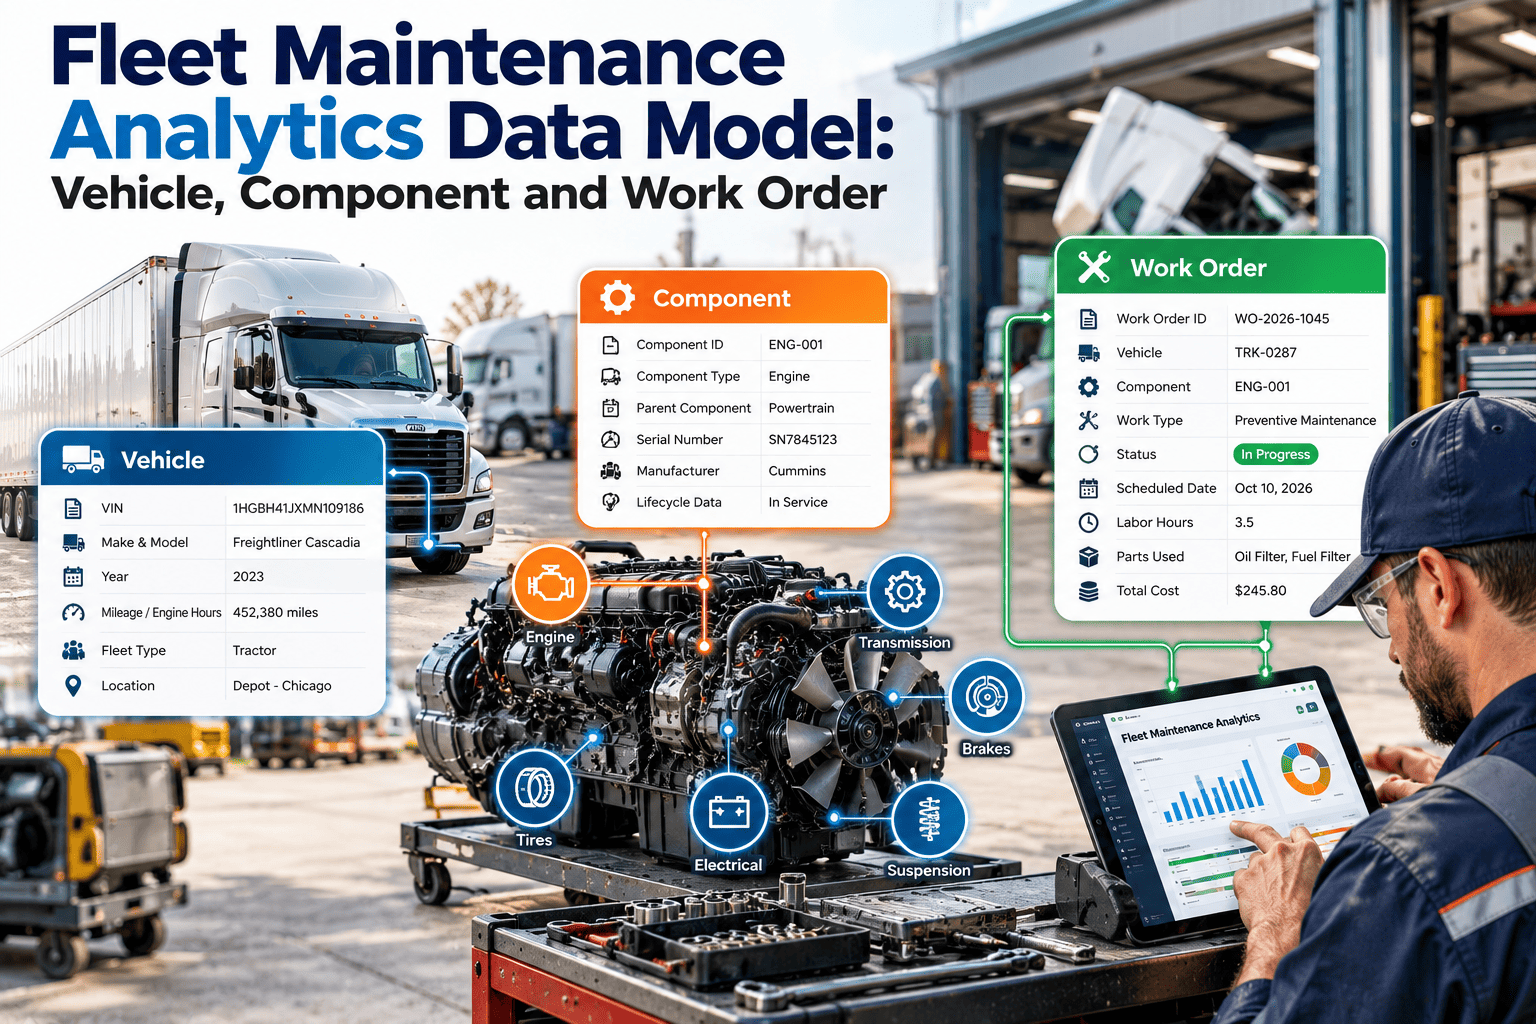
The three anchors: vehicle, component, work order
Most maintenance questions can be answered when these three are linked correctly and identified consistently.
Vehicle
One record per VIN, with class, make, model, year, in-service date, status, and current assignment.
Component
Engines, transmissions, axles, tires, batteries, and body equipment, each with install and removal history.
Work order
A header for the event and lines for each task, part, and labor entry, linked to a vehicle and often a component.
How the entities connect
| From | To | Cardinality | Rule |
|---|---|---|---|
| Vehicle | Component | One to many over time | A component is on one vehicle at a time, with dated moves |
| Vehicle | Work order | One to many | Every work order references exactly one VIN |
| Work order | Work order line | One to many | Lines hold task, labor, and part details |
| Work order line | Component | Many to one, optional | Required where the repair targets a specific component |
| Work order line | Failure code | Many to one | Required on corrective work |
| Work order | Meter reading | One to one at open and close | Needed for distance-based metrics |
Build reports on records you can defend
Keep vehicles, components, and work orders connected from the first inspection, and make your numbers repeatable.
Decide the grain before you build anything
The grain is what one row represents. Most fleet analytics work well with one row per work order line, rolled up when needed.
Good for counts, open and close dates, and total downtime
Best for cost by task, system, component, and failure
Needed for technician productivity and parts usage analysis
- Mixing grains in one table creates double counting, especially when header totals are repeated on every line.
- Store costs at the lowest grain and compute header totals in reports.
Dimensions that give every metric context
| Dimension | Key attributes | Used to answer |
|---|---|---|
| Vehicle | VIN, unit number, class, make, model, model year, depot, status | Cost by class, age, or location |
| Component | Type, serial, manufacturer, install date, install meter | Life of a component and failure by brand |
| Date | Day, week, month, quarter, shift | Trends and seasonality |
| Failure code | System, assembly, component, failure mode, cause | Top failure drivers |
| Technician | Name, skill level, crew, certification | Productivity and training needs |
| Vendor and part | Vendor, part number, category, unit cost | Spend and quality by supplier |
| Work type | PM, corrective, inspection, recall, accident, upfit | Planned versus reactive mix |
The work order line fact table
This table holds the numbers. Each row connects to the dimensions above by key.
| Field | Type | Notes |
|---|---|---|
| Work order and line ID | Key | Unique per line |
| Vehicle key and component key | Foreign keys | Component may be empty for general work |
| Open, start, finish, close timestamps | Date and time | Used to separate wait time from wrench time |
| Meter at open | Number | Odometer or hours, with source |
| Labor hours and labor cost | Number | By technician and task |
| Part quantity and part cost | Number | From inventory issue or PO receipt |
| Outside cost | Number | Sublet and vendor repair |
| Work type and priority | Code | Controlled lists only |
| Failure and cause codes | Code | Required on corrective work |
| Downtime flag and hours | Boolean and number | Calculated from status events |
Use a standard code structure for failures
The TMC and ATA Vehicle Maintenance Reporting Standards, known as VMRS, give a widely used code structure for systems, assemblies, components, and failure reasons.
- Limit technicians to a short pick list instead of the full code book.
- Review rarely used codes and merge near-duplicates each quarter.
- Keep free-text notes for detail, but never as the only failure record.
Write each metric down once
| Metric | Formula idea | Required data |
|---|---|---|
| MTBF | Operating distance or hours divided by failure count | Meter readings, corrective work orders with failure code |
| MTTR | Total repair time divided by repairs | Start and finish timestamps |
| PM compliance | PMs completed in window divided by PMs due | Schedule and completion dates |
| Planned work share | Planned hours divided by total maintenance hours | Work type and labor hours |
| Cost per distance | Maintenance cost divided by distance in the period | Costs and meter readings |
| Repeat repair rate | Same vehicle and system repaired again within a set window | Failure codes and dates |
| First-time fix rate | Jobs with no return for same issue within a window | Linked work orders |
| Availability | Available time divided by scheduled time | Downtime events |
| Backlog | Open work hours divided by weekly shop capacity | Open work orders, planned hours |
Choose the windows, such as the repeat repair period, from your own operation and document them with each metric.
Timestamp the work order lifecycle to measure downtime
Downtime is the hardest number to get right. It becomes reliable when each status change is recorded with a date and time.
Reported
Defect found or request raised. The vehicle may be flagged as out of service here.
Waiting for assignment or bay
Time lost to scheduling, not to repair. Track it separately.
Waiting for parts or approval
Reason codes here show whether procurement or authorization is the bottleneck.
In repair
Technician labor time, which feeds MTTR and productivity analysis.
Inspection and return to service
Quality check passed and vehicle released, which closes the downtime clock.
Component history turns failure counts into life data
A failure count alone does not tell you how long the part lasted. Install and removal records make life analysis possible.
| Component event | Fields to store | Analysis enabled |
|---|---|---|
| Install | Component, vehicle, date, meter, work order | Start of life |
| Inspection finding | Condition, measurement, date | Wear rate and trend |
| Repair or rebuild | Type, cost, date, meter | Repair versus replace decisions |
| Removal | Reason code, date, meter, disposition | Life to failure and early removals |
| Warranty claim | Claim reference, result, credit | Vendor and brand comparison |
- Compare life across makes, models, and duty cycles only after normalizing by distance or hours.
- Do not assume that a removal means a failure. Record the reason.
- Keep censored records, meaning parts still in service, so averages are not biased.
Quality rules that protect your analytics
Handle changes without rewriting history
- Changing a vehicle's depot rewrites old reports
- A swapped engine erases the old engine record
- Reclassified vehicles distort past cost per class
- Assignments store start and end dates
- Component moves create new install and removal rows
- Reports pick the attribute value that was true at the event date
Match each view to the person using it
| Audience | Questions | Core measures |
|---|---|---|
| Technician | What is assigned to me, and what is next? | Open tasks, due PMs, parts ready |
| Shop supervisor | Is the shop on track today? | Backlog, waiting time, bay use, first-time fix |
| Fleet manager | Which vehicles or classes cost the most, and why? | Cost per distance, planned share, availability |
| Reliability engineer | What fails, and how often? | MTBF, repeat repairs, top failure codes |
| Finance and leadership | Are we within budget, and when should assets be replaced? | Cost trend, lifecycle cost, spend by category |
Seeing the definitions applied to simple numbers
The figures below are fictional and show only how the formulas use the model fields.
| Metric | Inputs | Result |
|---|---|---|
| MTTR | 4 repairs on one class totaling 18 hours of wrench time | 4.5 hours per repair |
| PM compliance | 40 PMs due in the month, 34 completed inside the allowed window | 85 percent |
| Planned work share | 300 planned hours out of 500 total maintenance hours | 60 percent |
| Cost per distance | 12,000 total cost over 60,000 distance units | 0.20 per unit |
| Repeat repair rate | 3 of 25 brake repairs repeated inside the chosen window | 12 percent |
- Always show the numerator, denominator, and period next to the percentage.
- Exclude work types that do not belong in the metric, such as accident repair in a reliability measure.
Joining outside data to the maintenance record
| Source | Join key | Adds |
|---|---|---|
| Telematics | VIN or device ID mapped to VIN | Meter readings, fault codes, utilization |
| Fuel cards and fuel systems | Vehicle and date | Fuel use, efficiency trends |
| Inspection reports | VIN and date | Defects found before they become repairs |
| Parts and purchasing | Part number and work order | Material cost and vendor performance |
| Vendor invoices | PO and work order | Outside repair cost |
| Dispatch or utilization data | Vehicle and shift | Availability against demand |
Keep the model stable as the fleet changes
- Name an owner for each master list: vehicles, components, work types, and failure codes.
- Change code lists through a simple request process, and record the effective date of each change.
- Publish a glossary so every depot uses the same meaning for terms such as downtime and repeat repair.
- Limit who can edit closed work orders, and log every correction.
- Audit a small sample of work orders each month for coding accuracy and give feedback to technicians.
Questions the model should answer without extra work
| Question | Entities used |
|---|---|
| Which vehicles cost the most per distance, and which systems drive that cost? | Vehicle, work order line, failure code |
| Which component brand lasts longest in our duty cycle? | Component, vehicle, meter |
| Where do vehicles wait the longest, and for what? | Work order status events, reason codes |
| Are PMs catching problems or just consuming hours? | Work type, inspection findings, corrective follow-up |
| Which vehicles should be replaced first? | Age, lifecycle cost, repeat repairs, availability |
Modeling mistakes that cause bad decisions
- Counting work orders instead of failures, which inflates reliability problems on complex jobs.
- Including accident, upfit, and recall work in reliability metrics without a work type filter.
- Averaging cost per distance across vehicles with very different utilization.
- Calculating downtime from open to close dates when work orders stay open for paperwork.
- Ignoring vehicles with no work orders, which can make a class look better than it is.
- Using free-text descriptions to infer failure causes after the fact.
Feeding the model from daily maintenance work
Oxmaint maintenance management software captures the records the model depends on, as technicians do their jobs.
| Model element | Oxmaint capability |
|---|---|
| Vehicle and component records | Asset management with hierarchies and history |
| Work order headers and lines | Work orders with tasks, labor, parts, and status |
| Planned work and compliance | Preventive maintenance scheduling and completion records |
| Defect data from the field | Mobile inspections linked to corrective work |
| Parts and cost lines | Inventory and parts issue on work orders |
| Reporting layer | Dashboards and reports across vehicles, classes, and sites |
Build the model in five practical steps
List the ten questions leaders ask most and the data each needs.
Standardize vehicle IDs, component types, work types, and failure codes.
Make key fields required in the work order workflow.
Document metric definitions and check them against a sample of manual calculations.
Review data quality monthly and retire reports nobody uses.
Fleet maintenance analytics questions
What is the minimum data needed for useful fleet analytics?
A VIN, dated work orders, a meter reading, labor and parts cost, and a failure code.
Should failure codes follow VMRS?
VMRS is a common choice. A smaller pick list based on it works well for technicians.
Why track components separately from vehicles?
Components move and are replaced, so their life cannot be read from vehicle history alone.
How do we start without rebuilding everything?
Start with one class of vehicles. You can sign up and pilot required fields.
Can we see this on a live example?
Yes. You can book a demo to walk through work order data and reports.
Turn work order history into decisions
Give your fleet one connected record of vehicles, components, and repairs, and report on it with confidence.