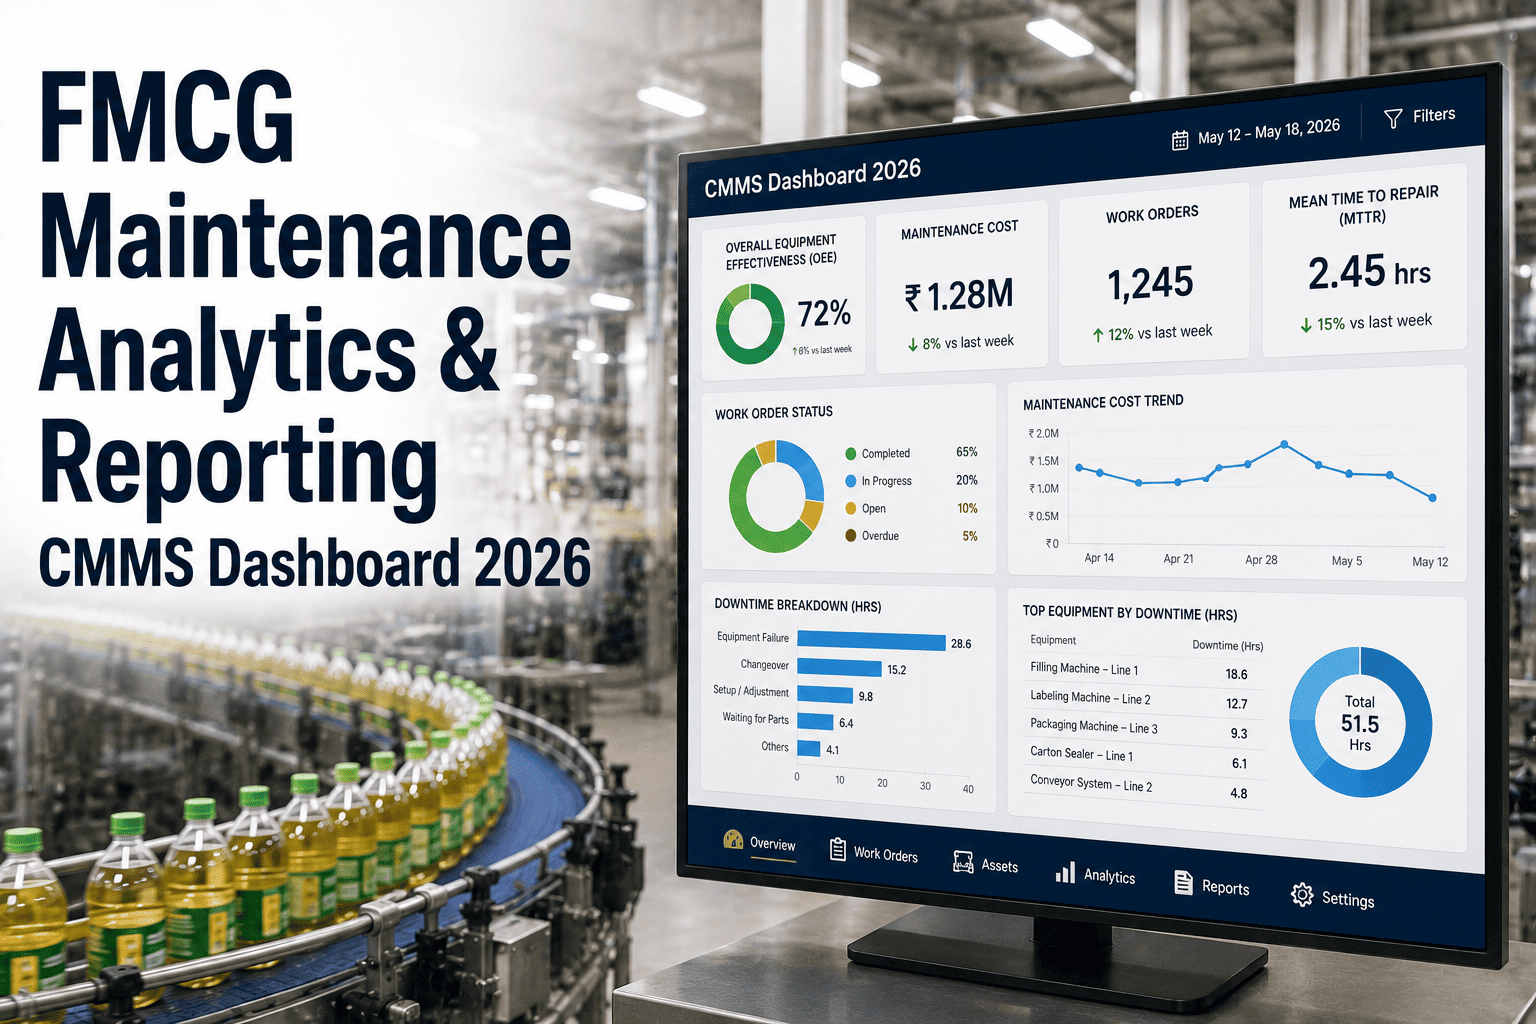
A plant manager walking into a Monday morning review meeting without real-time KPI data is operating on memory, instinct, and last week's spreadsheet — and making decisions that directly affect maintenance budgets, staffing, and equipment investment on that basis. In FMCG manufacturing, where margins are under relentless pressure and production schedules leave no room for reactive surprises, the difference between a plant running at 65% OEE and one running at 79% OEE is almost always a maintenance KPI visibility problem. The data exists — it just is not connected, not automated, and not in front of the people who need it in time to act. Start a free trial and have your FMCG maintenance KPI dashboard live within 48 hours, or book a demo to see the full dashboard in a 30-minute session with your team.
14pts
OEE Gap to Close
average FMCG plant vs. world-class 85% OEE benchmark
70%
Decisions Made Blind
of maintenance decisions made without real-time KPI data in typical FMCG plants
4.8x
Reactive Repair Premium
emergency repairs cost versus planned maintenance — tracked by MTTR KPI
48 hrs
To Live KPI Dashboard
typical Oxmaint deployment time to first live maintenance KPI view
Stop managing your plant on last week's numbers
Oxmaint gives FMCG plant managers and maintenance directors a live KPI dashboard covering OEE, MTBF, MTTR, PM compliance, downtime cost, and work order status — automatically updated from your asset and work order data. No manual reporting required.
The 8 FMCG Maintenance KPIs Every Plant Manager Must Track
Not all maintenance metrics are equally actionable. These eight KPIs are the ones that directly connect maintenance program quality to production output, cost, and reliability in FMCG environments — and the ones that Oxmaint tracks automatically, in real time, at the asset level.
OEE
Overall Equipment Effectiveness
Availability × Performance × Quality
FMCG Avg: 53–68% World Class: 85%+
The headline production efficiency metric. Tracks the combined impact of all downtime, speed loss, and quality loss in a single number leadership understands immediately.
MTBF
Mean Time Between Failures
Total Uptime ÷ Number of Failures
FMCG Avg: 200–500 hrs World Class: 800+ hrs
Measures equipment reliability. Rising MTBF means the PM program is working. Declining MTBF is an early warning that asset condition is deteriorating faster than maintenance is intercepting it.
MTTR
Mean Time to Repair
Total Repair Time ÷ Number of Repairs
FMCG Avg: 1.5–4 hrs World Class: under 45 min
Measures maintenance response and execution effectiveness. High MTTR signals spare parts gaps, skill gaps, or documentation failures. Reducing MTTR by 50% doubles the restoration speed after any failure event.
PM Compliance
Preventive Maintenance Completion Rate
PMs Completed On Time ÷ PMs Scheduled
FMCG Avg: 70–85% World Class: 92%+
The leading indicator of future breakdown risk. Every missed PM is a known failure risk being deferred. PM compliance below 80% reliably predicts rising unplanned downtime within 60 to 90 days.
Planned Ratio
Planned vs. Reactive Work Ratio
Planned WOs ÷ Total Work Orders
FMCG Avg: 55–70% planned World Class: 80%+
The single best indicator of maintenance program maturity. Plants below 50% planned work are stuck in a reactive cycle that makes OEE improvement structurally impossible regardless of budget.
Downtime Cost
Total Unplanned Production Loss
Downtime Hours × Production Value/Hour
Typical: $3k–$5k/min Target: Under 20 hrs/month
Converts downtime from an operational metric into a financial one. When leadership sees downtime as a dollar figure, maintenance investment decisions become easier to justify and approve.
Maintenance Cost
Maintenance Spend as % of Asset Value
Annual Maintenance Spend ÷ Replacement Asset Value
Reactive Plants: 6–12% Best Practice: 2–4%
Tracks maintenance cost efficiency. Reactive plants spend 3 to 6 times more on maintenance as a percentage of asset value than planned-maintenance plants — a direct consequence of emergency repair cost premiums.
Work Order Backlog
Open Work Order Aging
Open WOs Older than Target Days ÷ Total Open WOs
Risk Signal: over 30% aging 14+ days Target: Under 10%
An aging work order backlog is a hidden reliability risk. Open work orders represent known equipment deficiencies accumulating unaddressed — each one a potential future failure event waiting to become unplanned downtime.
What a Real FMCG Maintenance KPI Dashboard Looks Like
A maintenance KPI dashboard is only useful if it shows current data — not yesterday's exports — and if it connects the right metrics to the people who need to act on them. Plant managers, maintenance directors, and production leads need different views of the same underlying data. Oxmaint structures the dashboard by role and by time horizon, making every KPI immediately actionable. Start a free trial and see your live dashboard today, or book a demo with our FMCG team to walk through the dashboard setup.
Plant Manager View
Daily — Strategic + Tactical
OEE by line and shift
Unplanned downtime cost this week vs. last week
PM compliance rate vs. 92% target
Top 4 downtime causes this period
Maintenance Manager View
Shift-Level — Operational
Open and overdue work orders by priority
MTTR by technician and asset type
PMs due in next 48 hours
Work order backlog aging breakdown
Operations Director View
Weekly — Portfolio-Level
MTBF trend across all critical assets
Planned vs. reactive ratio by site
Maintenance cost per unit of production
OEE trend and benchmark comparison
Finance / Leadership View
Monthly — Budget and ROI
Total downtime cost vs. maintenance investment
Maintenance spend as % of asset value
Cost per work order (planned vs. reactive)
OEE improvement ROI and production capacity gained
Manual Reporting vs. Live KPI Dashboard: The Operational Impact
KPI Improvement Results: What Plants Achieve With Live Dashboards
+13pts
OEE Improvement
Average OEE gain within 6 months of deploying live KPI dashboards and condition-based maintenance triggers
92%
PM Compliance Achieved
Best-in-class compliance rate achievable with automated scheduling, mobile work orders, and live compliance tracking
38%
Downtime Cost Reduction
Typical reduction in total unplanned downtime cost within 90 days of visibility-driven maintenance improvement
79% planned
Planned Work Ratio
Average planned-to-reactive ratio achievable within 6 months — from a typical starting point of 52% planned
Frequently Asked Questions
What are the most important maintenance KPIs to track in FMCG manufacturing?
The eight most critical FMCG maintenance KPIs are: OEE (production efficiency headline), MTBF (reliability trend), MTTR (restoration speed), PM Compliance Rate (leading indicator of future breakdowns), Planned vs. Reactive Ratio (program maturity), Unplanned Downtime Cost (financial impact), Maintenance Cost as % of Asset Value (efficiency benchmark), and Work Order Backlog Aging (hidden risk indicator). Each KPI connects directly to a specific maintenance improvement lever.
How often should FMCG maintenance KPIs be reviewed?
Different KPIs require different review cadences. OEE, unplanned downtime, and open work order status should be reviewed daily — or continuously via a live dashboard. MTBF, MTTR, and PM compliance should be reviewed weekly to catch emerging trends before they become problems. Maintenance cost as a percentage of asset value and planned-to-reactive ratio are monthly strategic metrics used for budget and program decisions. A well-designed KPI dashboard delivers the right data to the right role at the right frequency automatically.
What is a realistic PM compliance target for an FMCG plant?
A realistic first-year target for FMCG plants transitioning from paper or spreadsheet-based PM tracking is 85% on-time completion. World-class FMCG plants achieve above 92% PM compliance through automated scheduling, mobile work order dispatch, and real-time compliance tracking that eliminates the visibility gap between when a PM is due and when it is actioned. Plants below 70% PM compliance are accumulating failure risk that will manifest as unplanned downtime within 60 to 90 days.
How does a live maintenance KPI dashboard reduce maintenance costs in food manufacturing?
Live KPI dashboards reduce maintenance costs through three mechanisms: first, by making PM compliance gaps visible in real time — preventing the costly reactive repairs that follow missed preventive maintenance. Second, by surfacing the planned-to-reactive ratio, which drives systematic reduction in the 4.8x cost premium of emergency repairs. Third, by connecting maintenance spend to production output per unit — making it visible when maintenance cost per unit of production is rising and enabling targeted intervention before the cost trend becomes a budget crisis.
Live maintenance KPI data. Zero manual reporting. One dashboard for your entire FMCG operation.
Oxmaint automatically calculates OEE, MTBF, MTTR, PM compliance, downtime cost, and work order backlog from your live asset and work order data — giving plant managers, maintenance directors, and operations leaders the real-time KPI view needed to run a high-performance FMCG plant. Deploy in 48 hours, not 6 months.