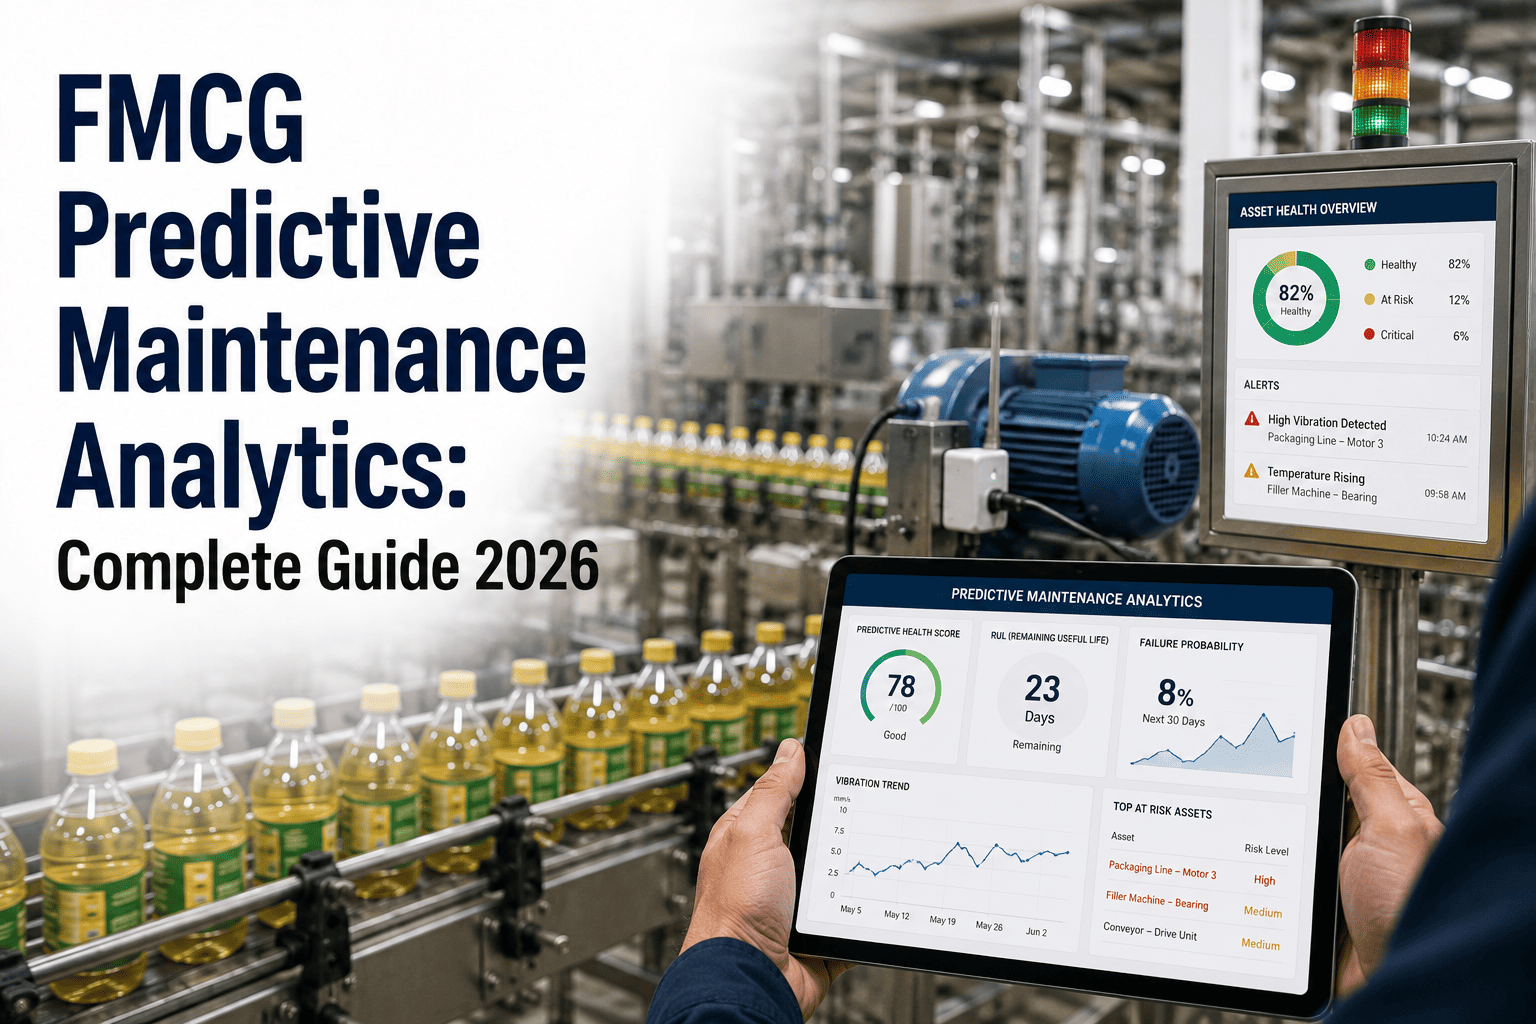
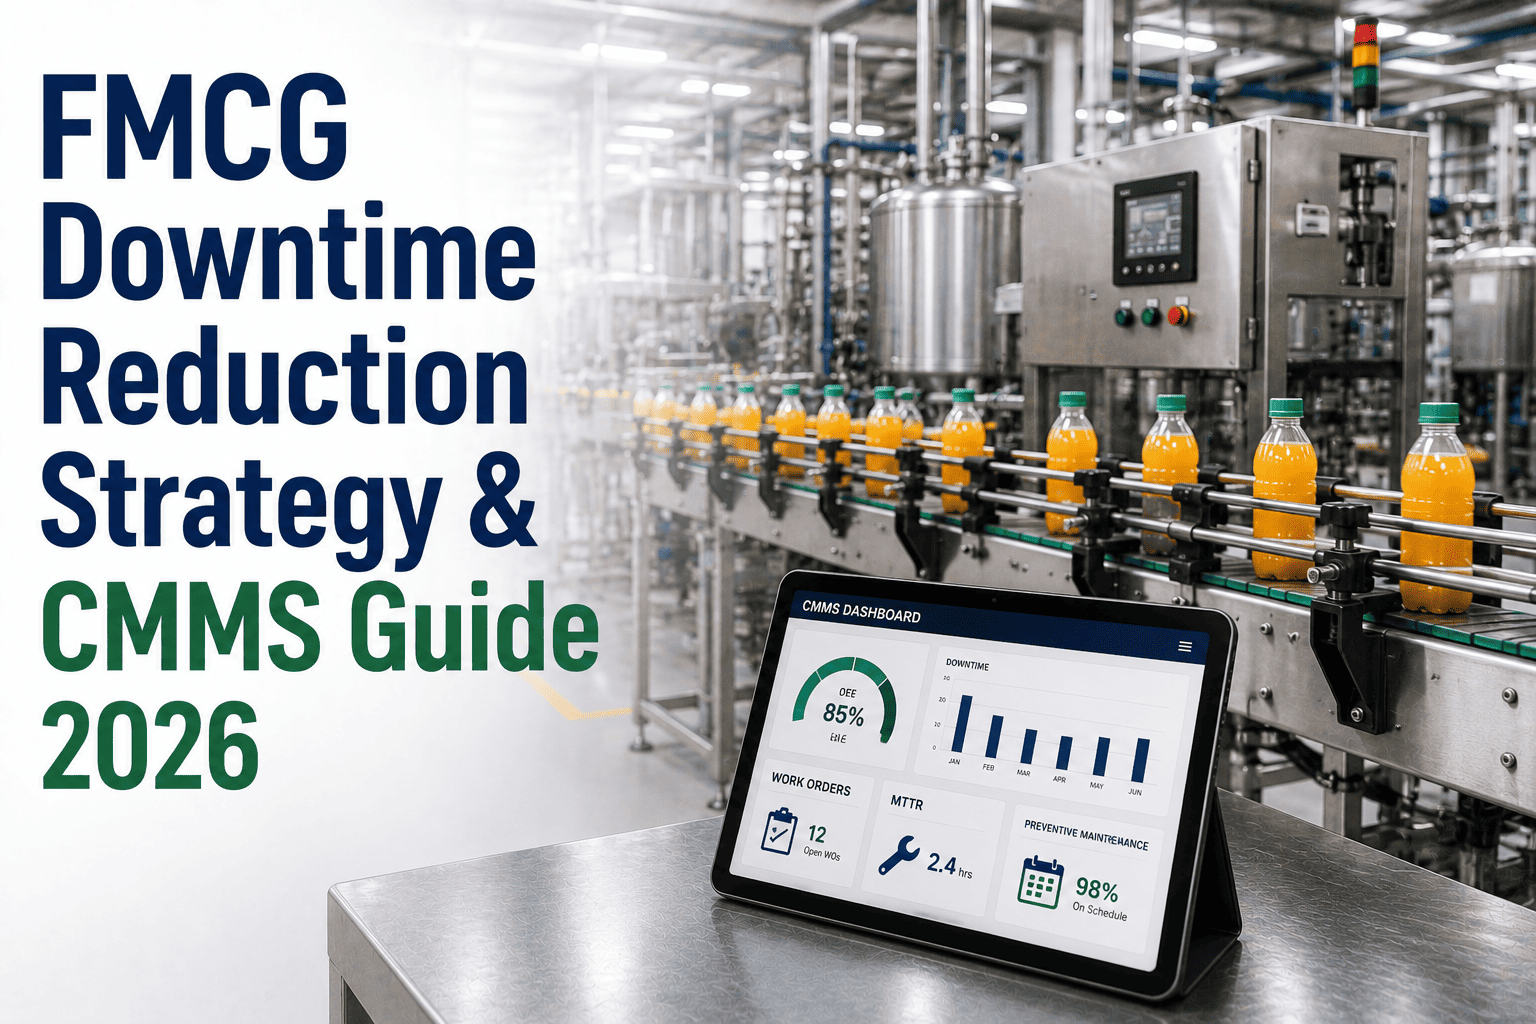
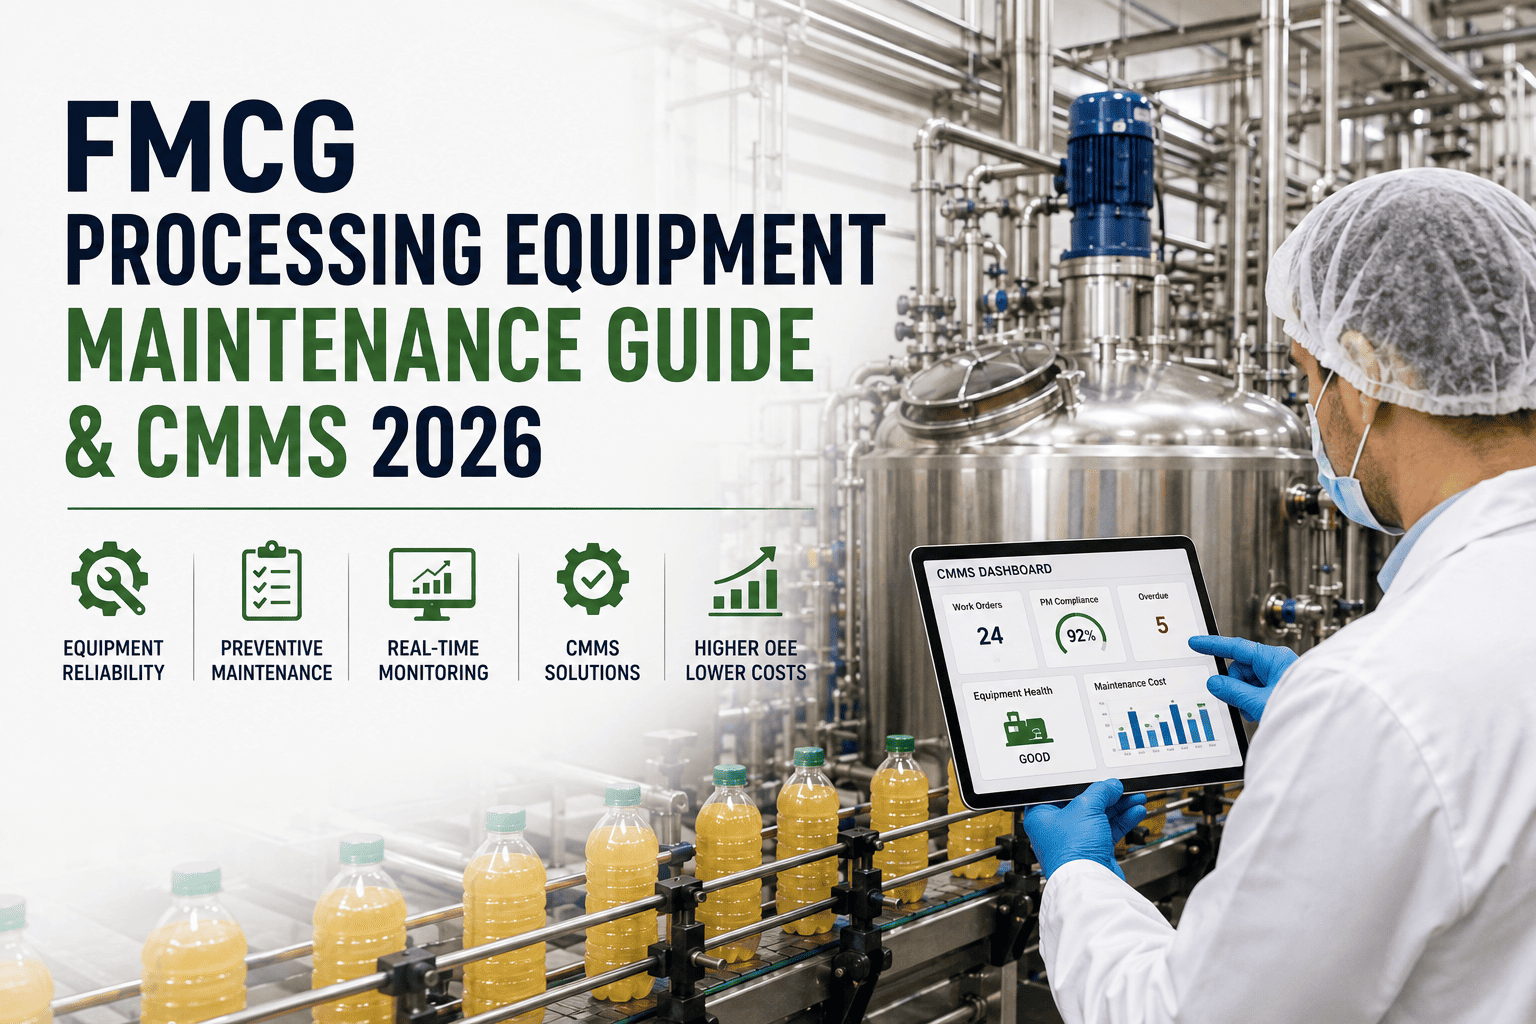
A plant manager opens three different spreadsheets before a Monday review and still can't say which line lost the most hours last week. Meanwhile a shift supervisor two buildings away already knows, because the fault was logged, coded, and ranked the moment it happened. Sign up to see how FMCG maintenance analytics and reporting inside a CMMS closes that gap between shift-floor reality and boardroom decisions.
What This Guide Covers
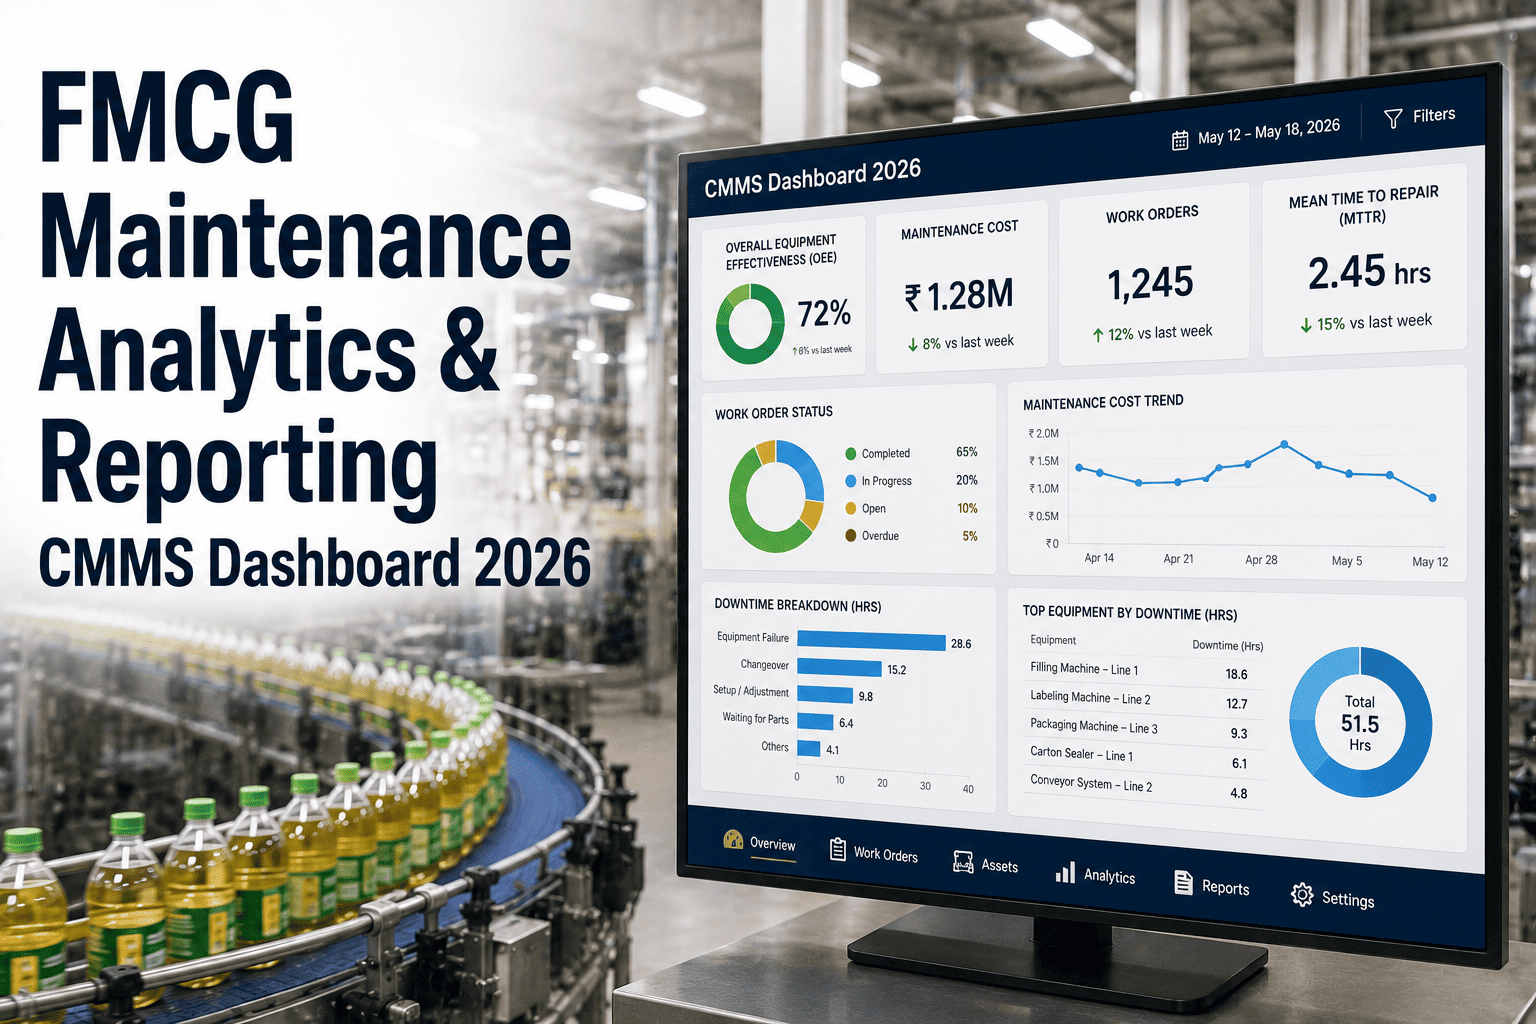
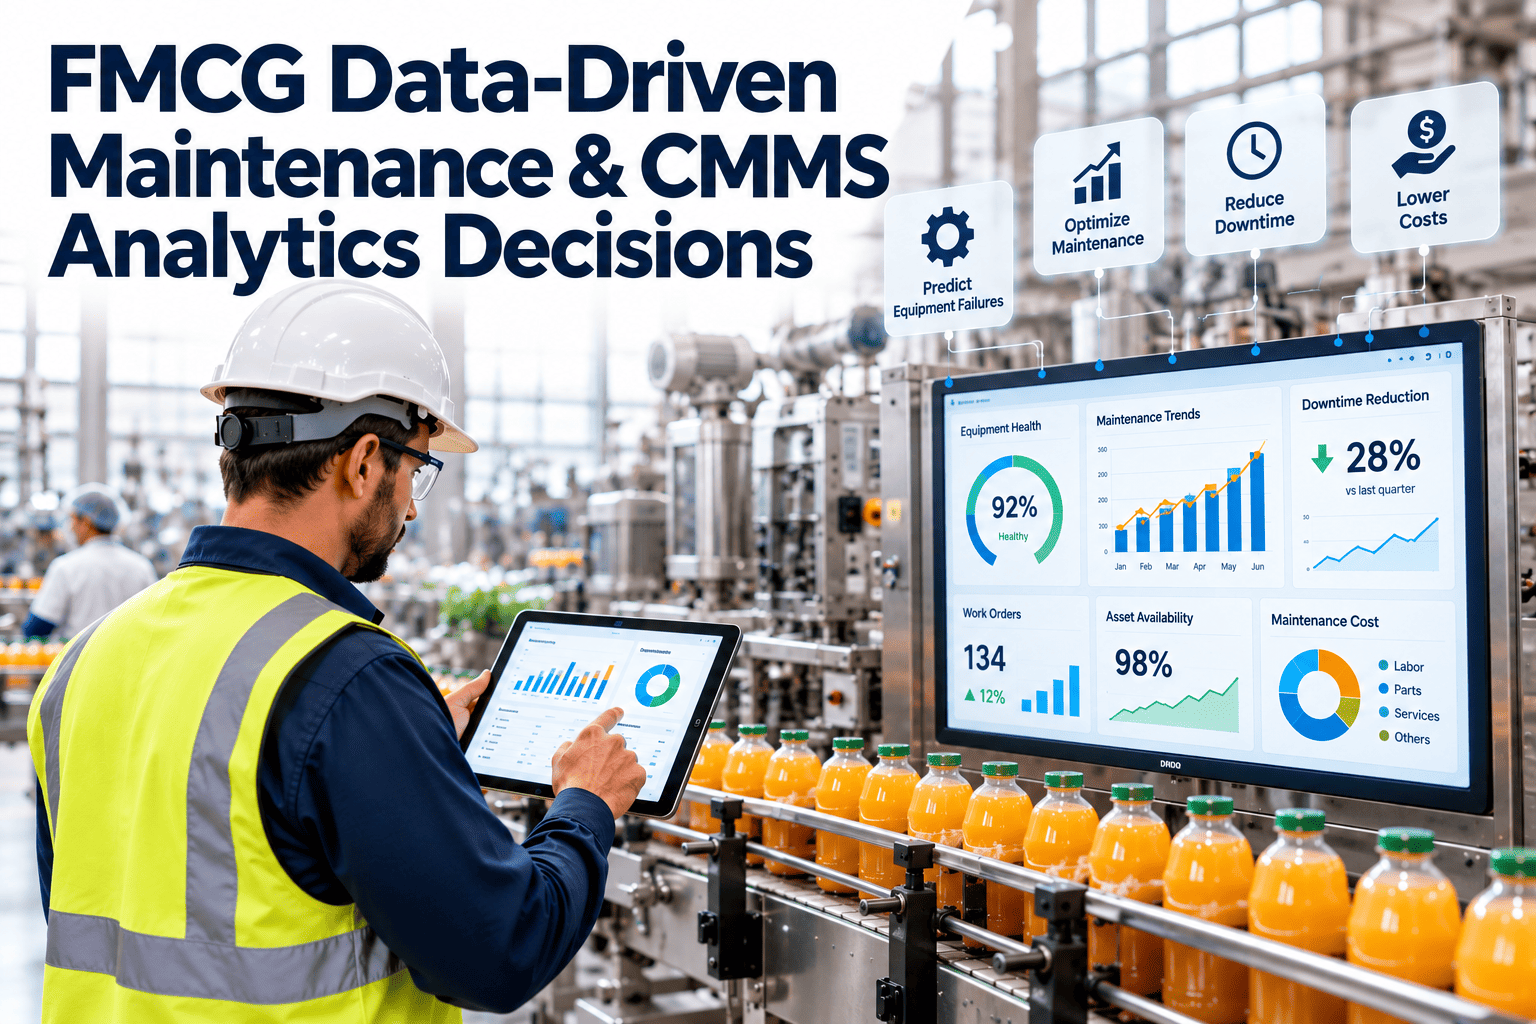
This 2026 guide covers FMCG maintenance analytics and reporting inside a CMMS dashboard: line-level Pareto analysis, downtime cause coding, OEE trend tracking, dashboard design across shift, plant, and corporate levels, and the reporting cadence that turns raw CMMS data into decisions people actually act on.
Three Levels Where FMCG Maintenance Data Should Live
Shift
A live tile shows open work orders, downtime minutes, and the top fault on the line, so the supervisor reacts within the shift instead of finding out next week
Plant
A rolled-up view ranks lines by downtime and OEE loss, giving the plant manager one screen to decide where the next crew and budget go
Corporate
A cross-plant scorecard compares reliability trends site to site, turning scattered reports into one number leadership can benchmark
The Analytics That Actually Change Behavior
| Analytic |
What It Tells The Team |
| Line-level Pareto |
Ranks lines by downtime hours so the worst offender is obvious instead of buried in a monthly summary |
| Downtime cause coding |
Tags every stoppage by root cause, turning vague "machine issue" notes into a pattern that can be fixed at the source |
| OEE trend |
Shows availability, performance, and quality moving over weeks, not just a single snapshot number |
| MTTR and MTBF |
Tracks whether repairs are getting faster and failures are getting rarer, the two numbers reliability programs live or die on |
Four Building Blocks Of A CMMS Analytics Dashboard
1
Standardized Cause Codes
A fixed taxonomy for downtime reasons means every technician logs faults the same way, so the data actually rolls up cleanly
2
Drill-Down From Plant To Asset
Clicking a spike on the plant chart should land directly on the asset and work order behind it, not a request for someone to go dig
3
KPIs Defined Once, Used Everywhere
OEE, MTTR, and MTBF calculated the same way on every line stop arguments about whose numbers are "right"
4
Reports That Send Themselves
Automated reporting on a schedule means the dashboard reaches inboxes before someone has to remember to export it
Turn Scattered Downtime Notes Into One Live Dashboard
OxMaint codes every stoppage, ranks lines by Pareto loss, and tracks OEE trends automatically. Sign up for a free trial to see your own plant's numbers, or book a demo to walk through the dashboard live.
What CMMS Reporting Adds Over Spreadsheets
Pareto Ranking On Demand
Downtime by line, asset, or reason ranks itself in real time instead of waiting for someone to pivot a table
One Version Of OEE
Every shift, line, and plant reads OEE off the same formula, so the number in the report matches the number on the floor
Scheduled Delivery
Daily, weekly, and monthly reports land in the right inbox automatically, on the same cadence every time
Trend, Not Snapshot
Charts move across weeks and months, so a one-off bad shift doesn't get mistaken for a real reliability problem
Cadence Matters As Much As The Chart
A dashboard nobody checks is just a screensaver. Daily huddles use shift-level downtime, weekly reviews use the line Pareto, and monthly leadership reports use the OEE trend. Matching each audience to the right level of detail is what makes the reporting cadence stick.
Frequently Asked Questions
Q
What is line-level Pareto analysis in FMCG maintenance?
It ranks production lines by total downtime hours or lost units, making it obvious which line deserves attention first instead of spreading effort evenly across the plant.
Q
Why does downtime cause coding matter for reporting?
Consistent cause codes turn free-text technician notes into a structured field that can be aggregated, ranked, and trended across shifts and plants.
Q
How often should CMMS reports actually go out?
Match the report to the audience: shift-level downtime daily, line Pareto weekly, and OEE trend monthly, so each level gets the detail it needs without drowning in noise.
Get One Dashboard For Shift, Plant, And Corporate
OxMaint turns Pareto analysis, cause coding, OEE trends, and automated reporting into a single connected view of every line. Sign up for a free trial to build your dashboard, or book a demo to see it mapped to your plant.