The average FMCG production line runs at 60% OEE — meaning four out of every ten minutes of scheduled production time is lost to breakdowns, speed loss, or quality defects. World-class TPM programs consistently push that figure above 85%, recovering capacity that already exists inside the plant without buying new equipment or adding headcount. Start a free trial of Oxmaint to digitize all eight TPM pillars with work orders, OEE dashboards, and autonomous maintenance checklists — or book a 30-minute demo with an FMCG TPM specialist to model the OEE recovery available on your lines.
FMCG Production Guide · Total Productive Maintenance
TPM in FMCG: Eight Pillars, Real Plant Adoption, and the OEE Math That Makes It Unavoidable
TPM is not a maintenance program. It is a production system that treats equipment reliability as the primary competitive lever — and in FMCG, where 1% of quality loss on a $15M line costs $150,000, every pillar pays for itself.
40%
Typical FMCG OEE without structured TPM — vs. 85%+ world-class benchmark (Lean Production)
$169K
Average per-hour cost of unplanned downtime across manufacturing (ABB / Sapio Research, 2026)
71%
Unplanned downtime reduction achieved within 14 months in a documented FMCG TPM rollout
15–30%
Maintenance cost reduction from combined autonomous and planned maintenance pillars (Six Sigma DSI)
What Is Total Productive Maintenance in FMCG?
Total Productive Maintenance (TPM) is a structured production philosophy, developed by the Japan Institute of Plant Maintenance (JIPM) and first industrialized in the 1970s, that distributes equipment ownership from a specialist maintenance team to every operator on the floor. The goal is elimination of the Six Big Losses — equipment failures, setup and adjustment losses, idling and minor stoppages, reduced speed, startup defects, and in-process defects — measured and aggregated into a single metric: Overall Equipment Effectiveness (OEE).
In FMCG manufacturing, TPM is not optional. Lines running 20+ hours daily across hundreds of SKUs cannot absorb the revenue cost of reactive maintenance culture: a beverage filler running at 1,200 bottles per minute loses 20,000 units in a single 17-minute unplanned stop (Oxmaint OEE Benchmarks, 2026). With FMCG net margins at 5–12%, the loss from one avoidable breakdown can exceed the entire monthly maintenance budget for that line. Start a free trial and establish your OEE baseline within 30 days.
A typical FMCG plant runs at 60% OEE. Moving one line to 85% on a $15M annual output recovers $3.75M in capacity — without adding a single machine or operator.
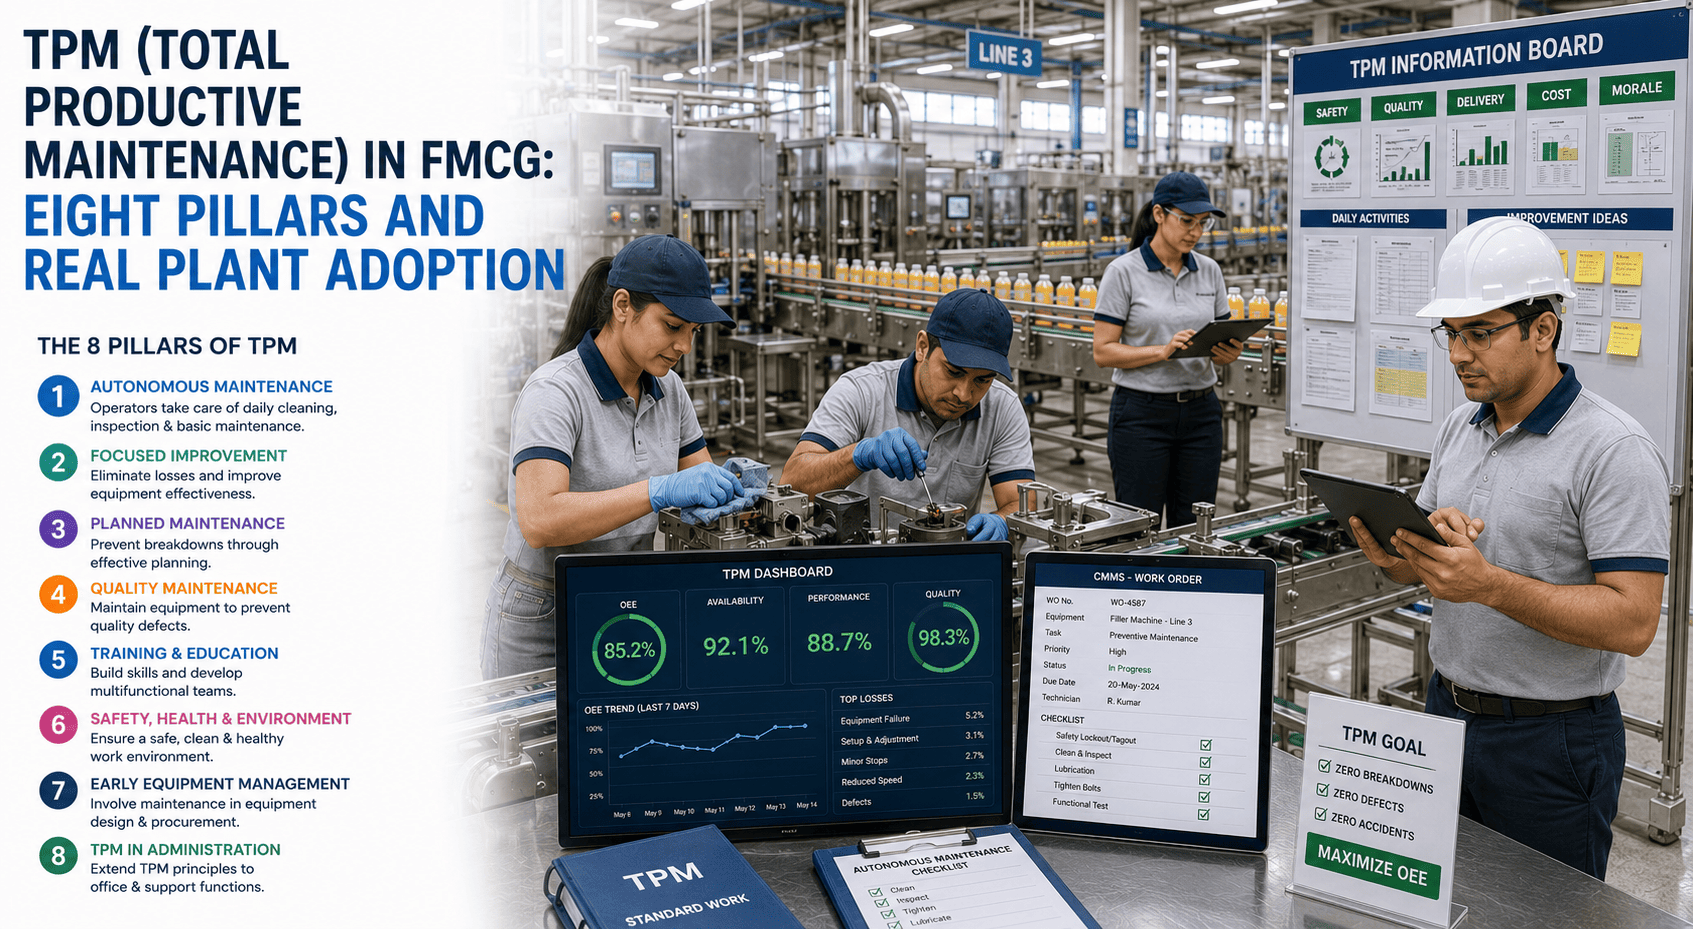
The Eight Pillars of TPM: What Each One Does in an FMCG Plant
Each TPM pillar addresses a specific category of equipment loss. In FMCG, all eight must function together — skipping a single pillar creates gaps that undermine the entire program. The most commonly skipped pillars (Early Equipment Management and Quality Maintenance) are also the ones with the highest long-term ROI.
01
Autonomous Maintenance (Jishu Hozen)
Operators take ownership of routine equipment care — cleaning, lubricating, inspecting, and detecting abnormalities before they escalate to breakdowns. In FMCG, this is the highest-leverage pillar: operators spend more time with equipment than any maintenance technician. Oxmaint delivers digital AM checklists to the operator's mobile, with photo verification and trend logging for each task.
02
Planned Maintenance
Shift from reactive firefighting to condition-based maintenance scheduled around equipment history and failure pattern data. Plants using Oxmaint for planned maintenance see PM completion rates climb from below 50% to above 79% within the first year — converting reactive cost into predictable, budgetable spend.
03
Focused Improvement (Kobetsu Kaizen)
Cross-functional teams target the highest-impact losses on specific equipment using structured root cause analysis — Pareto, 5 Why, fishbone. In FMCG, focused improvement projects on packaging lines and filling machines consistently deliver 5–15% OEE gains per initiative when loss data is tracked systematically.
04
Quality Maintenance (Hinshitsu Hozen)
Establish the equipment conditions that produce zero-defect output, then maintain those conditions through inspection and monitoring. For FMCG, quality maintenance directly addresses the in-process defect loss that silently erodes the quality component of OEE — often without anyone tracking the cost until it accumulates into a significant scrap figure.
05
Early Equipment Management
Apply lessons from current asset failures to design and procure equipment that is easier to maintain, clean, and inspect. FMCG plants expanding capacity or replacing lines that skip this pillar repeat the same failure modes in new equipment — and restart the TPM maturity journey from zero on every capital project.
06
Training and Education
Build operator and technician competence systematically — not through ad-hoc training events. FMCG environments with high turnover and multi-shift operations need structured skill matrices and task-linked training records to sustain TPM discipline across every shift and every new hire.
07
Safety, Health and Environment
Integrate zero-accident and zero-pollution goals into the maintenance program. In FMCG food facilities, SHE is inseparable from food safety — unsafe equipment conditions and environmental control failures create compliance exposure alongside productivity loss.
08
TPM in Administration
Eliminate waste in support functions — procurement delays, maintenance scheduling bottlenecks, parts availability gaps — that indirectly suppress OEE. Administrative waste that holds up a spare part for four hours while a line sits idle is a TPM failure as significant as any equipment breakdown.
Four Adoption Pain Points That Stall FMCG TPM Programs
Most FMCG plants that attempt TPM stall before full pillar maturity. The reasons are consistent across industries and regions — and all four are traceable to the same root cause: no digital system to sustain the discipline between improvement workshops. If your TPM program has lost momentum, book a demo to see how Oxmaint restarts it with immediate data visibility.
01
Autonomous Maintenance Reverts to Clipboard Culture
Paper AM checklists get completed in batches at the end of a shift, signed and filed without the tasks being performed. Without digital verification — timestamped, photo-confirmed, geolocation-anchored — there is no way to distinguish a completed task from a completed form.
02
OEE Is Tracked but Not Acted On
Many plants calculate OEE. Far fewer have a systematic process to connect the weekly OEE figure to a specific work order, a root cause analysis, and a corrective action. Without that link, OEE becomes a reporting number rather than a performance lever.
03
Planned Maintenance Crowds Out AM Discipline
When reactive breakdown volume is high, maintenance technicians are consumed by emergency repairs — leaving no capacity to support operator AM training, verify AM task quality, or complete scheduled PM tasks. The pillars undermine each other without a shared work order system to balance the load.
04
No Pillar-Level Progress Visibility for Leadership
TPM steering committees receive monthly slide decks that show OEE at the plant level but cannot identify which pillar is lagging, which equipment is the primary loss contributor, or which teams are sustaining AM discipline. Leadership cannot act on data they cannot see broken down to the right level.
44% of food and beverage manufacturers experience equipment-related stoppages at least monthly — with 14% reporting stoppages every week. TPM exists specifically to break this pattern. Without the digital infrastructure to sustain all eight pillars, it cannot.
How Oxmaint Supports All Eight TPM Pillars
Oxmaint is the digital backbone that makes all eight TPM pillars sustainable — not as a workshop exercise, but as daily operational discipline. The platform connects operator AM tasks, PM schedules, OEE loss data, work orders, and spare parts in one system, eliminating the coordination gaps that stall TPM programs at most FMCG plants.
AM
Digital Autonomous Maintenance
Mobile AM checklists with photo verification, task-level completion tracking, and escalation when steps are missed — operators perform AM; Oxmaint proves it.
PM
Condition-Based PM Scheduling
PM tasks triggered by runtime hours, cycle counts, or condition thresholds — not calendar dates. PM completion rates climb from below 50% to above 79% within the first year.
OEE
Live OEE Dashboards
Availability, performance, and quality tracked per line, per shift, per asset — with Six Big Losses mapped to specific equipment and time windows for focused improvement targeting.
WO
Integrated Work Order Management
Every breakdown, AM finding, and quality defect generates a work order linked to the asset record — creating the traceability chain that connects OEE loss to corrective action and close-out.
KPI
Pillar-Level TPM Reporting
TPM steering committees see PM completion rate, AM compliance rate, MTBF, MTTR, and OEE trend per line — by pillar, not just by plant. Leadership acts on the right data at the right level.
MRO
Spare Parts and MRO Integration
Critical spare parts linked to assets and PM tasks — stock alerts triggered before a part is needed, eliminating the administrative bottleneck that stalls repair while a line sits idle.
Reactive Maintenance vs. TPM-Mature Operation
| Performance Area |
Reactive / Pre-TPM Plant |
TPM-Mature Plant (Oxmaint) |
| OEE Level |
40–60% — significant hidden capacity loss in every shift |
85–95% — world-class target achievable within 18–24 months of full pillar deployment |
| Maintenance Mix |
78%+ reactive — technicians consumed by emergency repairs, no PM capacity |
Below 30% reactive — PM and AM dominate, emergencies become exceptions not the norm |
| Equipment Ownership |
Maintenance department only — operators report faults, do not prevent them |
Operators own AM — abnormalities caught and corrected before breakdowns occur |
| OEE Loss Visibility |
End-of-shift reports — causes of downtime unclear, repeated losses untracked |
Real-time Six Big Losses mapped to asset, shift, and operator — patterns surface within days |
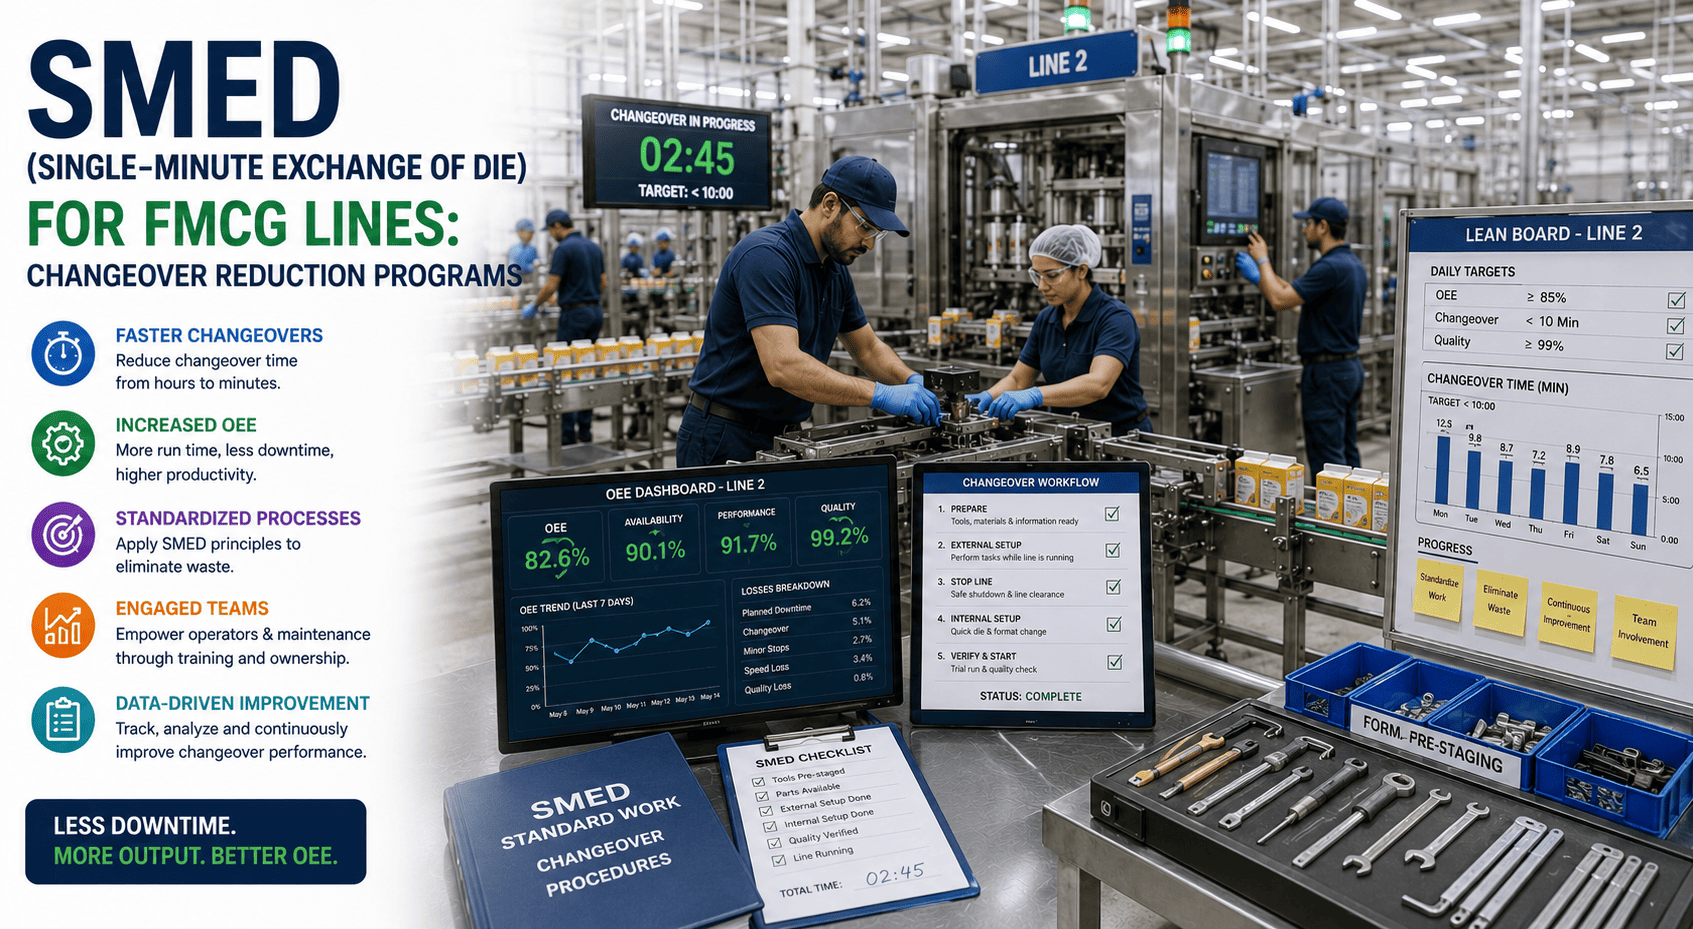
| Changeover Time |
60–90 minutes per SKU switch — unstructured, varies by operator and shift |
28–35 minutes — SMED-based standardized procedures tracked and improved per line |
| Maintenance Cost |
Emergency repair premium: 4.8× planned cost — unpredictable, unbudgetable |
15–30% total maintenance cost reduction (Six Sigma DSI) — predictable CapEx and OpEx |
TPM Rollout: A Phased Adoption Framework for FMCG Plants
FMCG TPM programs that attempt full eight-pillar deployment simultaneously in month one consistently fail. The JIPM-recommended approach — and the one Oxmaint is designed to support — is phased: stabilize the production environment first, then layer pillars in sequence. Full-site pillar maturity typically takes 18 to 24 months, but measurable OEE improvements appear within the first 60–90 days. Operations teams ready to start the process can start a free trial and have a live OEE baseline running before the first steering committee meeting.
Phase 1 · Months 1–3
Stabilize and Baseline
Deploy OEE tracking and work order management. Establish current-state loss data per line. Launch 5S and initial cleaning campaigns as the foundation for Autonomous Maintenance. Most facilities see 5–8 OEE percentage points in this phase alone from eliminating obvious, unmeasured losses.
Phase 2 · Months 3–9
Pillar 1 and 2 Deployment
Implement Autonomous Maintenance (digital checklists, operator skill matrices) and Planned Maintenance (condition-based PM schedules, MTBF tracking). Target: reactive maintenance below 40%, PM completion above 75%, AM compliance verified digitally on every shift.
Phase 3 · Months 9–18
Focused Improvement and Quality
Run structured Kaizen projects on the top three loss contributors identified by OEE data. Deploy Quality Maintenance on highest-defect equipment. Target: OEE above 75% on pilot line, Kaizen project cadence established with measurable before/after loss data for each initiative.
Phase 4 · Months 18–24+
Full Pillar Maturity
Roll out remaining pillars: Early Equipment Management integrated into CapEx planning, TPM in Administration eliminating procurement and scheduling waste, and SHE fully embedded in PM and AM task design. Target: 85%+ OEE on primary lines, JIPM TPM Award eligibility criteria met.
Measured TPM Results: What FMCG Plants Achieve
TPM outcomes are well-documented across FMCG manufacturing environments. These benchmarks are grounded in published research, industry surveys, and documented plant rollouts — not projections. Teams ready to quantify the opportunity on their own lines can book a demo and model the OEE recovery available at their facility.
86%
OEE achieved from 62% baseline
Documented FMCG snack manufacturer: 14-month TPM rollout across four production lines, with changeover time dropping from 90 to 28 minutes simultaneously
71%
Reduction in unplanned downtime
Same 14-month rollout: annual maintenance cost reduction of $70,000, plus 2,400 additional production hours recovered per line per year
$3.75M
Capacity recovered per line
Moving from 60% to 85% OEE on a line generating $15M annually — recovered without new capital expenditure (Oxmaint OEE benchmarks, 2026)
79%+
PM completion rate within year one
Plants using Oxmaint for condition-based PM scheduling — climbing from below 50% pre-deployment, converting reactive spend to planned maintenance at 4.8× lower cost
15–30%
Total maintenance cost reduction
From combined Autonomous Maintenance and Planned Maintenance pillars — documented across multiple manufacturing sectors (Six Sigma DSI benchmarks)
60–90 days
Time to first measurable OEE gain
Initial OEE stabilization from baseline tracking and work order management — before full pillar deployment begins generating the compounding improvements
Frequently Asked Questions
What is the difference between TPM and traditional preventive maintenance in FMCG?
Traditional preventive maintenance is a maintenance department program: technicians perform scheduled tasks on equipment on a calendar basis, separate from production operations. TPM is a plant-wide system that redistributes equipment ownership — operators perform Autonomous Maintenance (cleaning, lubricating, basic inspection), while maintenance technicians focus on higher-skill planned and predictive tasks. The fundamental difference is scope: PM covers one pillar; TPM covers eight, including quality, training, safety, and early equipment management. In FMCG, the distinction matters because operator-performed AM catches abnormalities that a monthly PM visit would miss — and catches them while the line is still running, before the abnormality becomes a breakdown.
Start a free trial to see how Oxmaint separates AM and PM task streams while connecting them in a single OEE dashboard.
How long does it take to see measurable OEE improvement after starting a TPM program?
Most FMCG facilities see initial OEE stabilization within 60–90 days of deploying digital OEE tracking and structured work order management — the first two infrastructure elements of a TPM rollout. The first measurable pillar-driven improvements (from Autonomous Maintenance and Planned Maintenance) typically appear within 3–6 months. Significant OEE gains — 5–10 percentage points — occur within 6–12 months for plants with a structured phased approach. Full eight-pillar maturity and world-class OEE (85%+) typically requires 18–24 months. The key variable is not time — it is whether the program has a digital system to sustain daily pillar discipline between improvement workshops. Plants without one consistently revert to reactive patterns within 6 months of the initial TPM launch event.
Can Oxmaint support TPM across multiple FMCG sites in different countries?
Yes. Oxmaint is designed for multi-site portfolio management: the hierarchy runs Portfolio > Site > Line > Asset > Component, allowing a VP Operations or Director of Manufacturing to see OEE, PM compliance, and AM completion rates across every site in a single dashboard. Site-level managers see their own plant data in detail; group leadership sees the cross-site benchmarking that identifies which sites are leading on each pillar and which need support. Oxmaint supports multiple languages and time zones, and the mobile-first design means operator AM tasks function identically whether the plant is in Germany, the UAE, or Australia. A documented FMCG beverage manufacturer operating 8 facilities across the UK, Germany, and Poland achieved a 45% reduction in unplanned downtime and $15M in annual savings over 18 months using Oxmaint's multi-site platform.
Book a demo to see the multi-site dashboard and cross-site OEE benchmarking in action.
How does Oxmaint handle the Autonomous Maintenance pillar without reverting to paper checklists?
Oxmaint's AM module delivers task checklists to operator mobile devices at the start of each shift, specific to the line and equipment assigned to that operator. Each task requires a completion action — a checkbox with a timestamp, a photo of the completed condition, or a meter reading — before the system records it as done. If a task is skipped or overdue, the system escalates to the team leader automatically. At shift end, the AM compliance report shows which tasks were completed, by whom, at what time, and with what evidence — making it impossible to batch-sign paper forms after the fact. Over time, the system builds a maintenance history per asset that links AM findings to subsequent work orders, making the contribution of AM discipline to equipment reliability measurable for the first time in most FMCG plants.
FMCG · Total Productive Maintenance · OEE · CMMS
Identify Your Hidden Production Capacity in 30 Minutes
Used by ops teams managing 10,000+ assets across multi-site FMCG operations. Measurable OEE results in the first 30 days. No heavy implementation — live in days, not months.
- Digital AM checklists with photo verification — every operator, every shift, every line
- Live OEE dashboards with Six Big Losses mapped to asset and time window
- Pillar-level TPM reporting for steering committees — PM rate, AM compliance, MTBF, MTTR
Limited onboarding slots this quarter. See measurable results in the first 30 days.