A bakery production group in Georgia ran three high-speed packaging lines around the clock. Their maintenance team tracked equipment issues on spreadsheets and replaced parts on fixed schedules. In November 2024, a case sealer bearing failed during a holiday surge—costing 11 hours of lost output and $127,000 in spoiled product, overtime labor, and expedited shipping. Post-failure analysis revealed the bearing had shown rising vibration signatures for 26 days before it seized. An AI probability model would have flagged that bearing at 78% failure likelihood two weeks earlier, triggering a planned replacement during the next sanitation window. After deploying AI-powered downtime probability modeling, the same facility caught six high-risk conditions in the first quarter—scheduling all repairs during planned windows with zero unplanned production stops. Sign up for Oxmaint to bring AI downtime probability modeling to your food manufacturing plant.
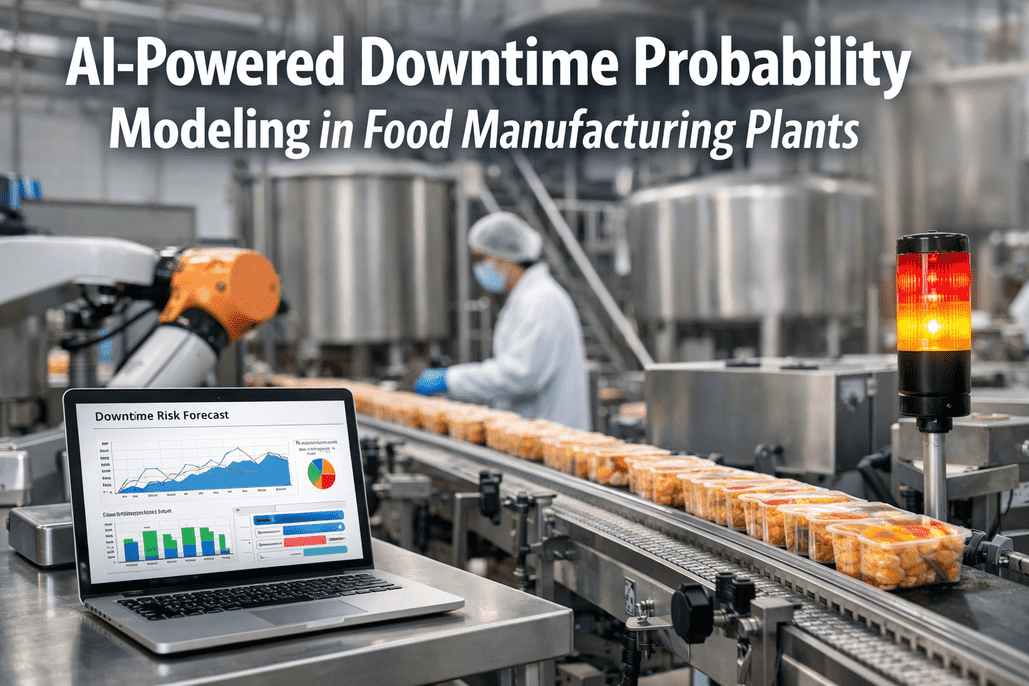
AI-Powered Downtime Probability Modeling in Food Manufacturing Plants
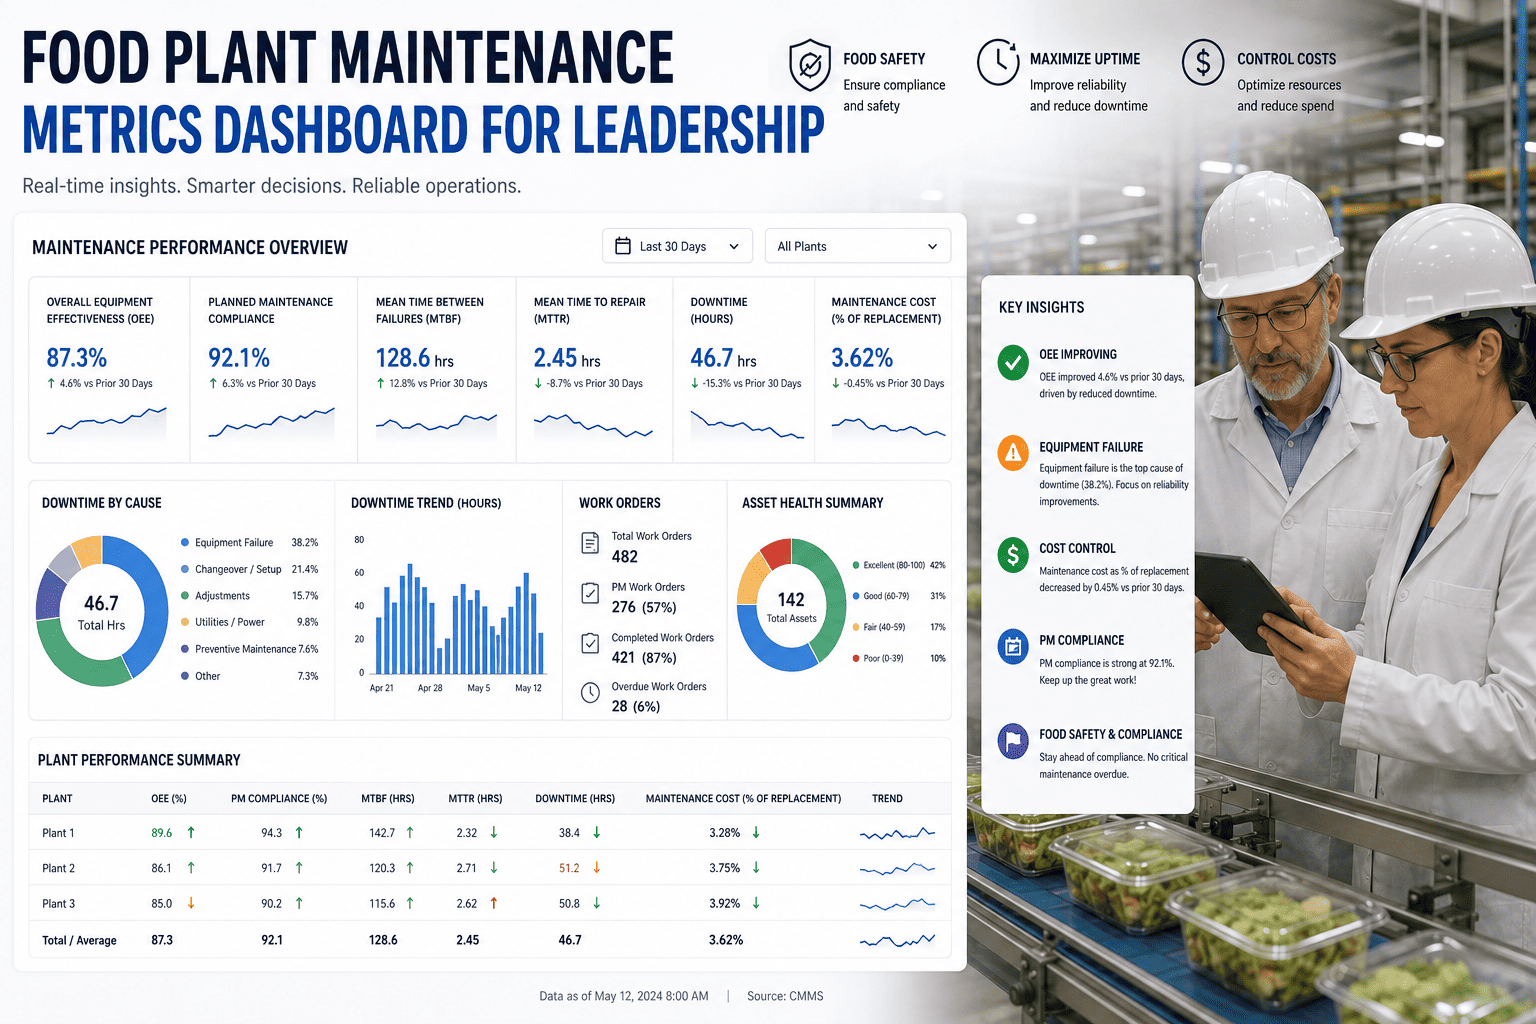
What if your maintenance team could see the future? AI downtime probability models don't predict with crystal balls—they calculate failure likelihood from real sensor data, historical patterns, and operating conditions. The result: every critical asset in your plant gets a continuously updated risk score, so you always know what's most likely to fail next—and when.
Unplanned Downtime Is the Most Expensive Problem in Food Manufacturing
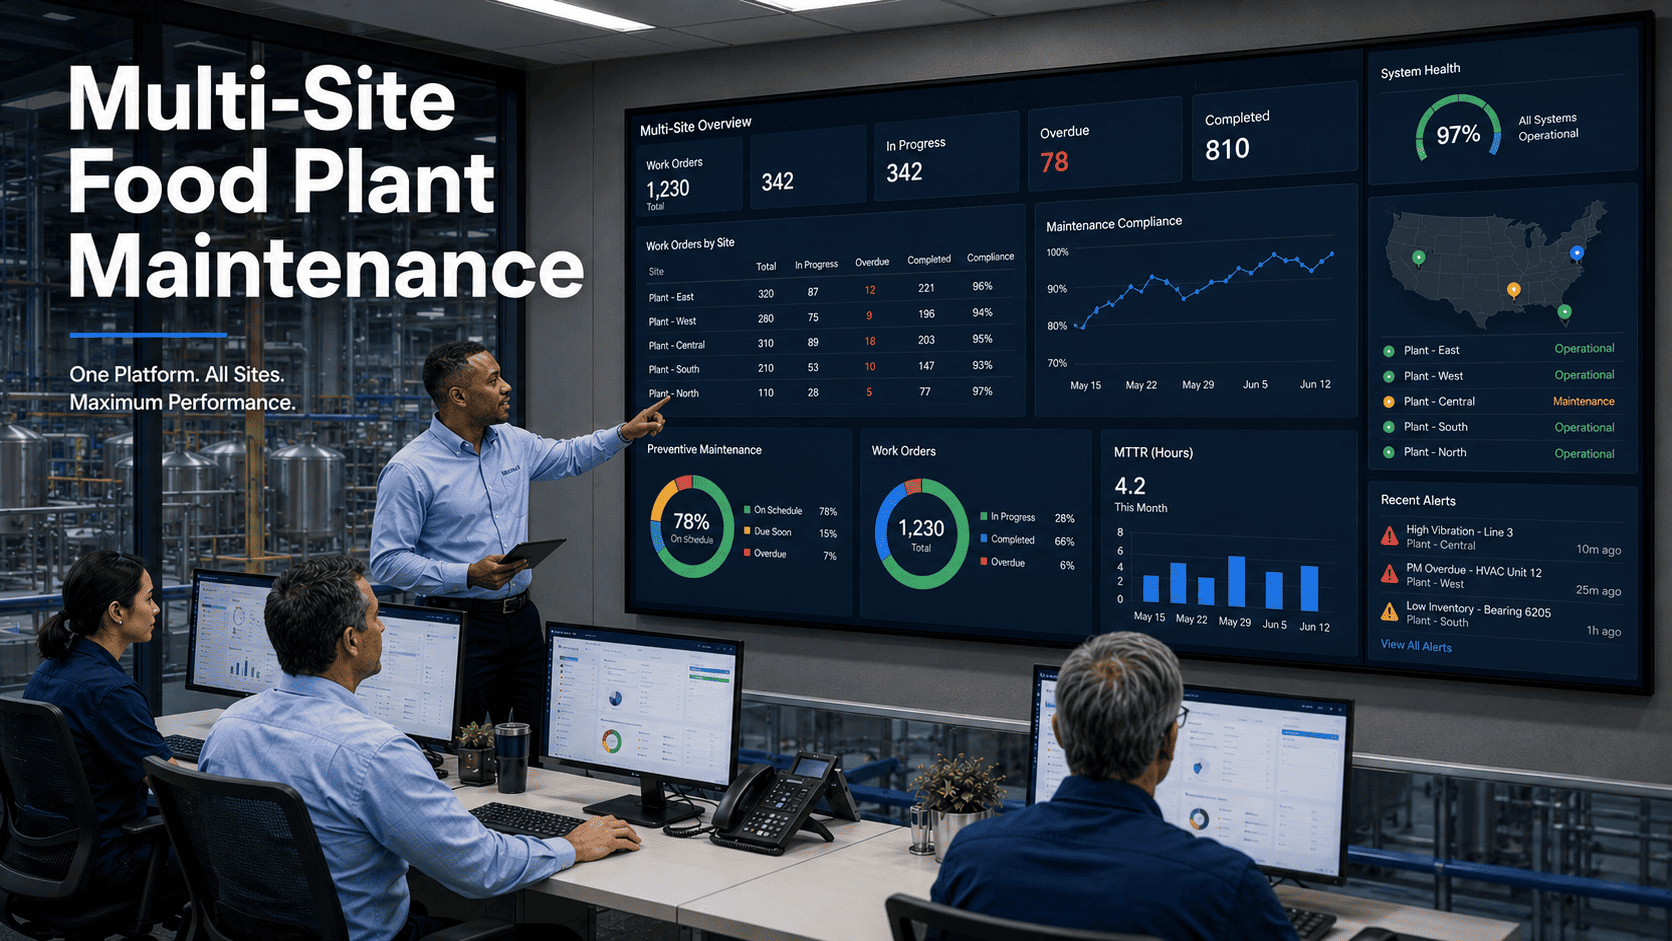
Food plants run 16 to 24 hours a day, every day. When a critical asset fails without warning, the financial damage extends far beyond the repair bill. Here's what the data shows:
From Sensor Data to Failure Probability Scores
AI downtime probability modeling transforms raw equipment data into actionable risk intelligence. Here's the four-stage pipeline that runs continuously for every monitored asset in your plant. Sign up for Oxmaint to deploy this pipeline on your critical food processing equipment.
Continuous Data Collection
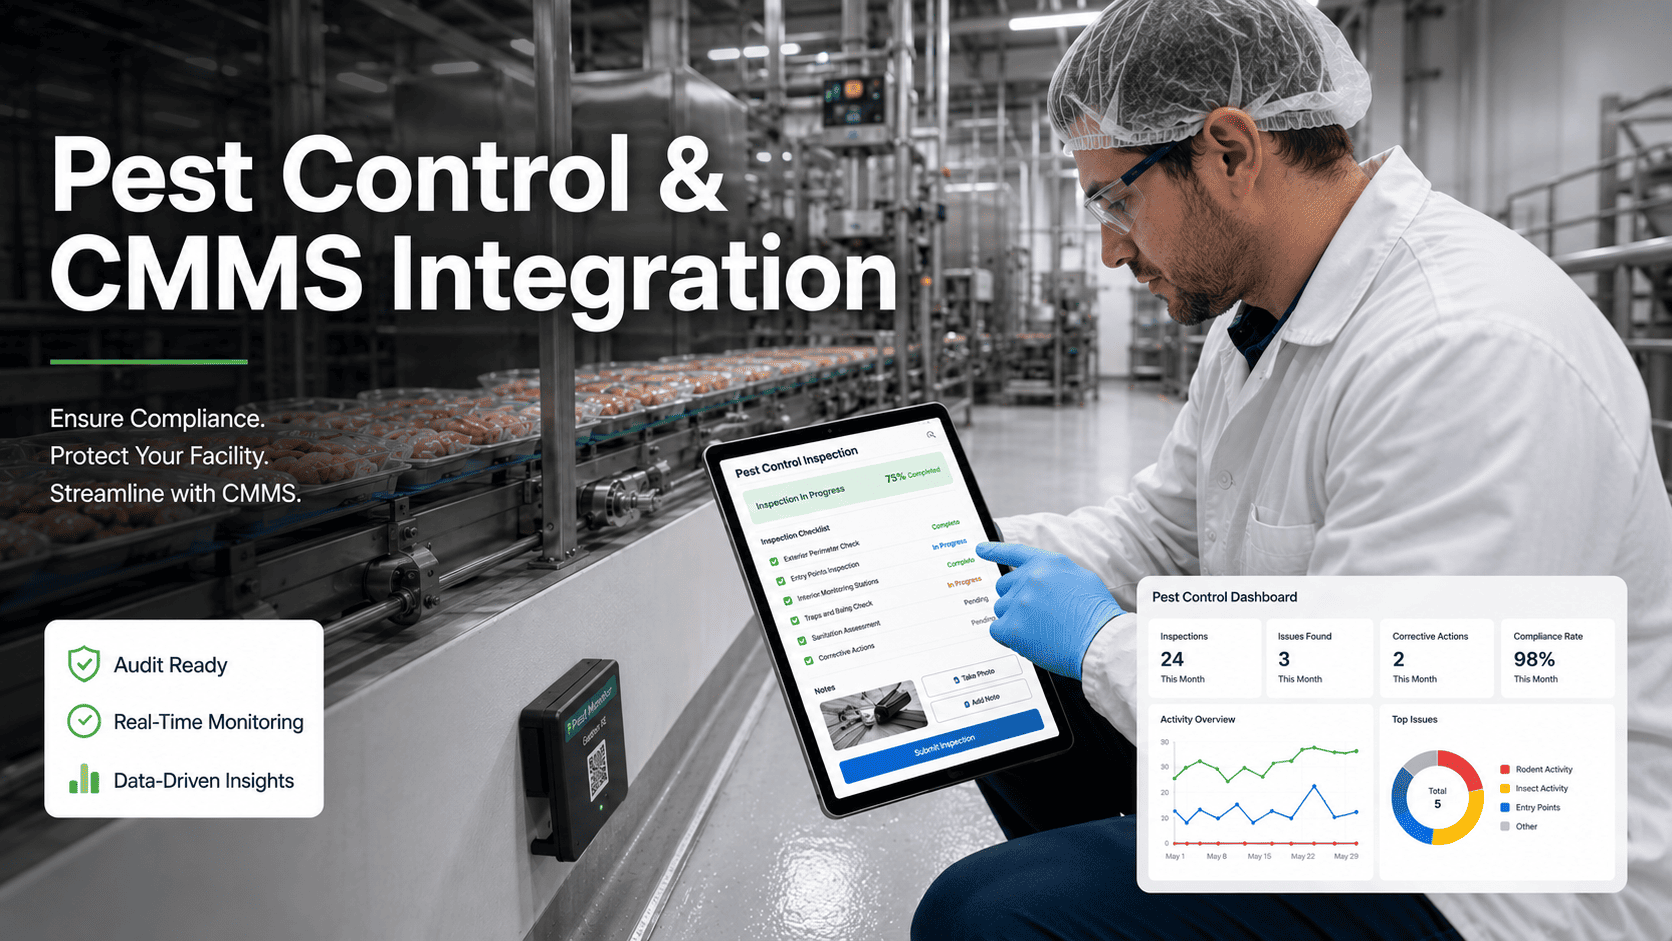
IoT sensors on critical assets capture vibration, temperature, current draw, pressure, and acoustic signals every few seconds. This creates a rich, real-time data stream that reflects the actual operating condition of each piece of equipment—not just whether it's running or stopped.
Baseline Learning & Anomaly Detection
Machine learning algorithms establish what "normal" looks like for each individual asset under its specific operating conditions—accounting for load, ambient temperature, production type, and age. When live readings deviate from learned baselines, the system flags anomalies instantly. Research shows ML models achieve 90% precision in identifying true anomalies versus false alarms.
Probability Calculation & Risk Scoring
This is where probability modeling separates from basic alerts. Instead of a binary "healthy/unhealthy" status, the AI calculates a failure probability percentage and an estimated time-to-failure window for each asset. A compressor might show 23% failure probability within 14 days—not urgent. But when that score rises to 71% within 7 days, it moves to the top of the maintenance priority queue automatically.
Automated Work Order & Scheduling
When an asset crosses its risk threshold, the CMMS automatically generates a work order with the AI's diagnosis, recommended repair action, required parts, and a suggested maintenance window that minimizes production impact. No human has to interpret raw sensor charts or manually create tickets. Book a demo to see how Oxmaint auto-generates work orders from probability scores.
Probability Models vs. Traditional Threshold Alerts
Most condition monitoring systems fire alerts when a single reading crosses a fixed limit. That's better than nothing—but it misses the bigger picture. Here's why probability modeling is a fundamental upgrade:
What AI Downtime Probability Modeling Delivers
These outcomes are drawn from published industry research by McKinsey, Deloitte, the U.S. Department of Energy, Siemens, and verified manufacturing deployments between 2023 and 2025.
AI predictive models cut unplanned downtime by up to half compared to reactive or calendar-based maintenance strategies.
Companies using predictive maintenance report 85% improvement in their ability to accurately forecast when downtime will occur.
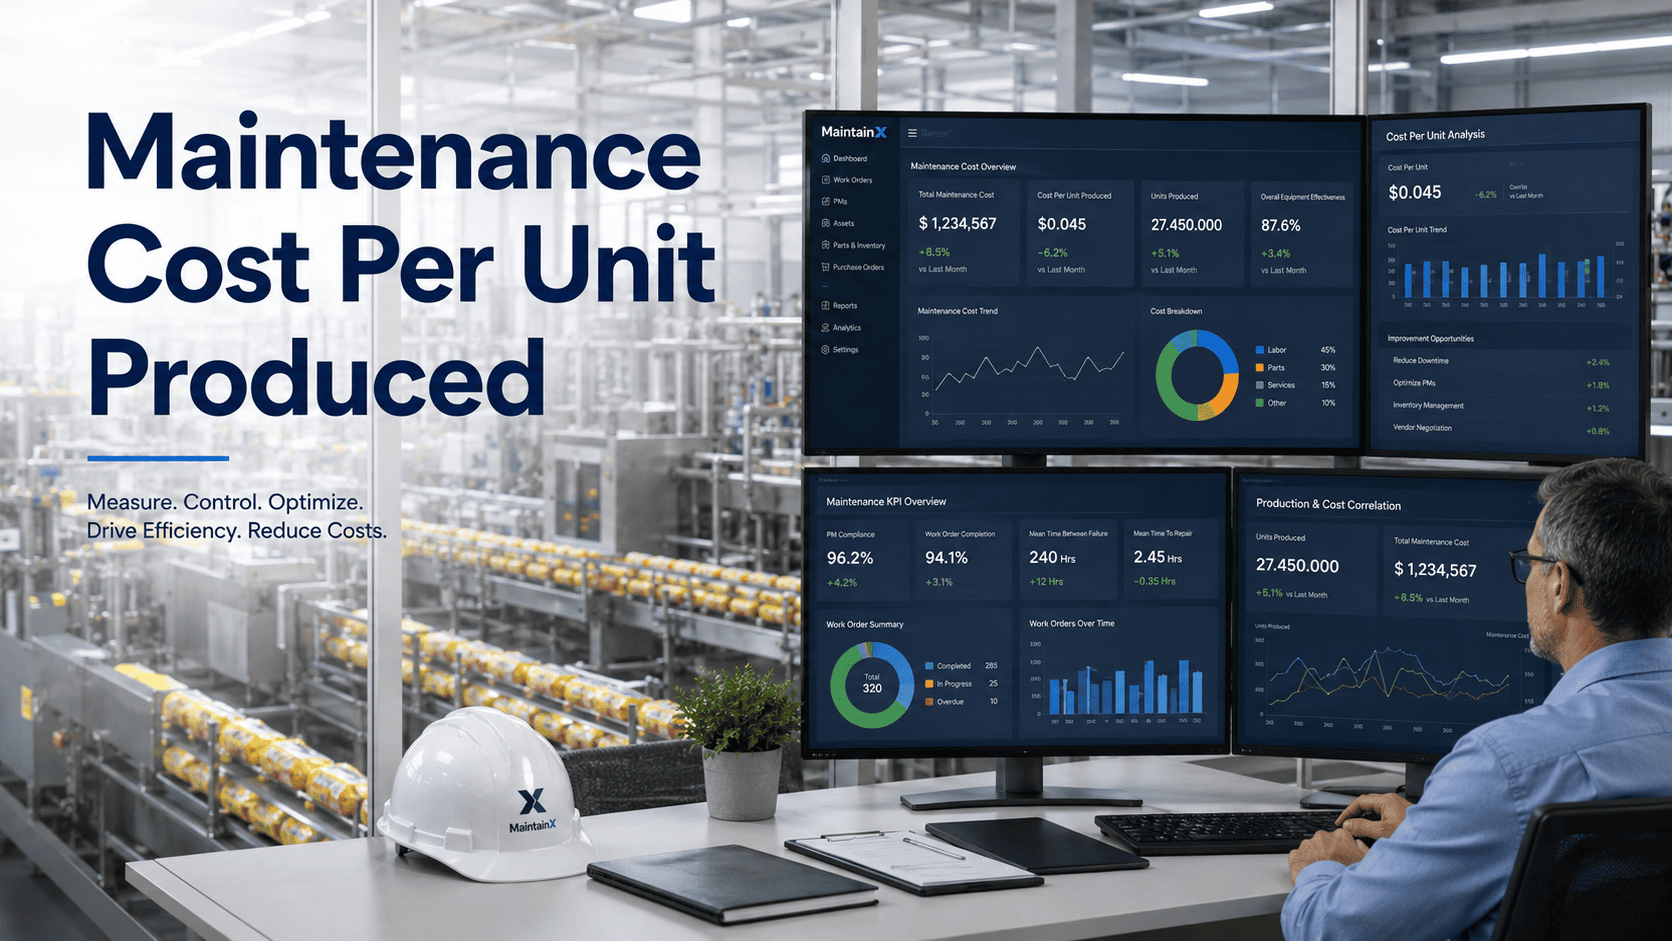
Shifting from reactive to predictive strategies reduces overall maintenance spend by 25% to 40%, according to McKinsey research.
The U.S. Department of Energy reports predictive maintenance yields a tenfold return on investment—the highest ROI lever in manufacturing technology.
By catching degradation early, AI models extend asset operational lifespan by up to 40%, deferring major capital replacement costs.
Modular AI deployments on critical equipment deliver measurable value within 6 to 10 weeks—not months or years.
Critical Assets Where Probability Modeling Pays Off Fastest
Not every asset needs AI monitoring. Probability modeling delivers the fastest ROI on equipment where failure is both costly and detectable through sensor patterns. In food manufacturing, these are the highest-value targets:
Cold chain integrity is non-negotiable. A compressor failure doesn't just stop production—it puts perishable inventory at risk. AI models track vibration harmonics, discharge pressure, and suction temperature to calculate failure probability 14–30 days ahead.
Production line conveyors run continuously and fail from bearing wear, misalignment, and insulation breakdown. Current signature analysis and vibration trending provide highly reliable degradation curves for probability scoring.
Clean-in-place system failures halt not just current production but delay the start of the next production run. Seal wear, impeller degradation, and cavitation are all detectable through vibration and flow rate analysis.
Case sealers, fill nozzles, labelers, and palletizers contain dozens of wear components. AI models correlate cycle counts, servo current, and positional drift to predict which component will reach end-of-life first.
Frequently Asked Questions
Stop Reacting. Start Predicting.
Every hour of unplanned downtime costs your food plant thousands. AI probability modeling turns your equipment data into a continuously updated risk map—so your maintenance team always knows what's coming and has time to prepare. Oxmaint makes it practical, fast, and affordable for plants of any size.