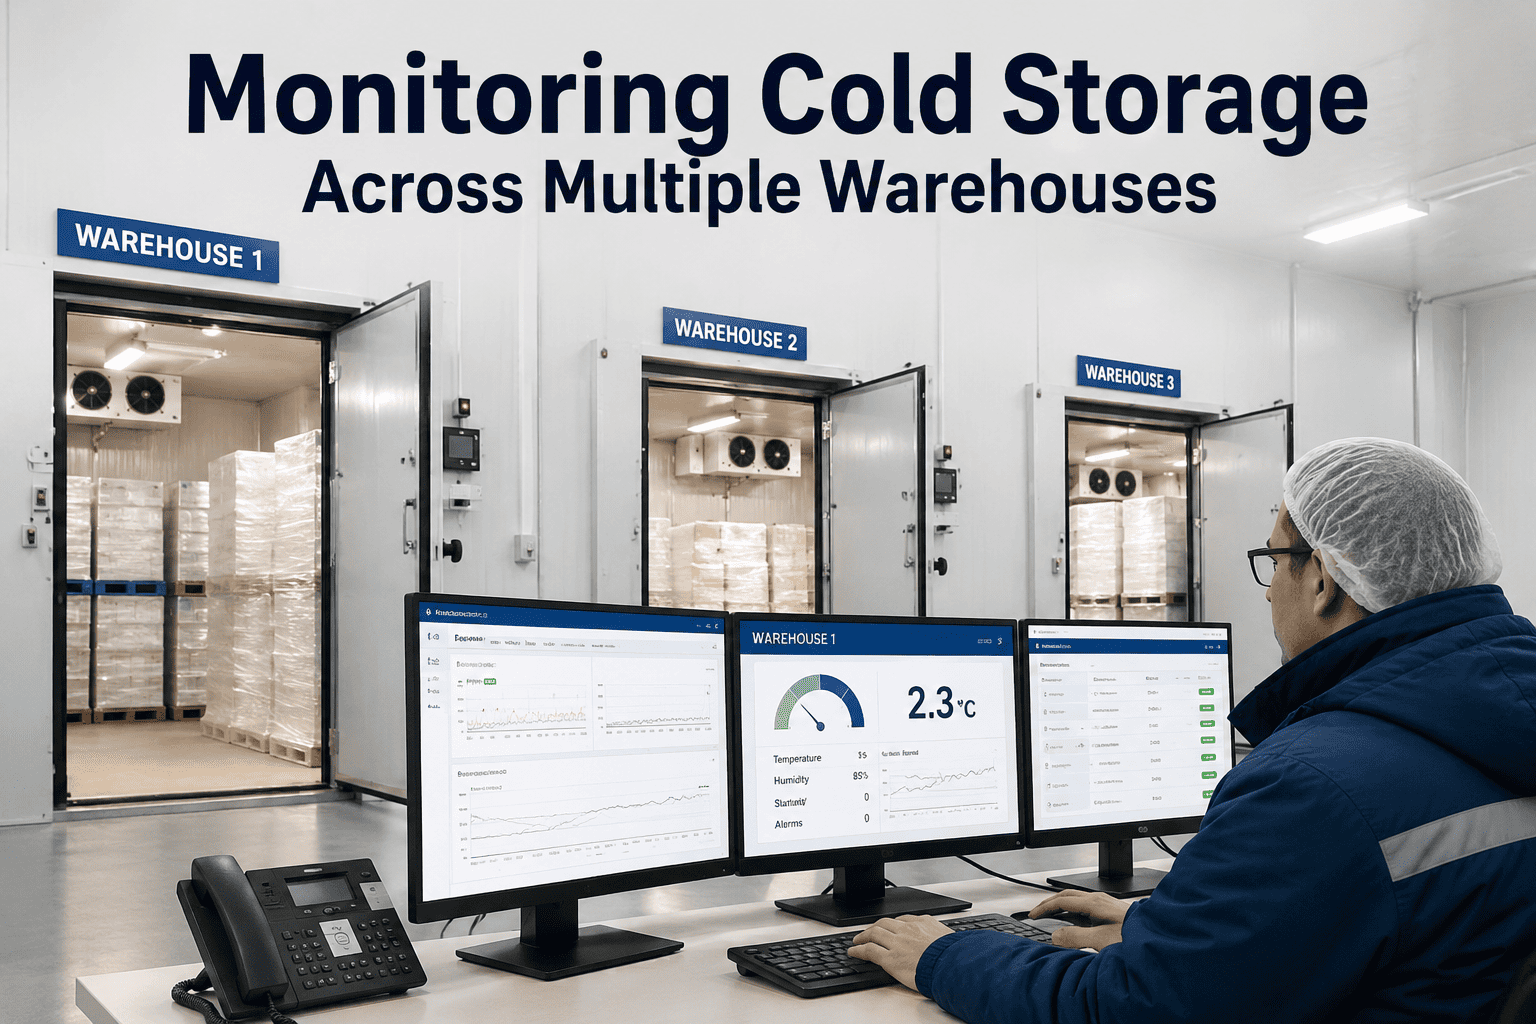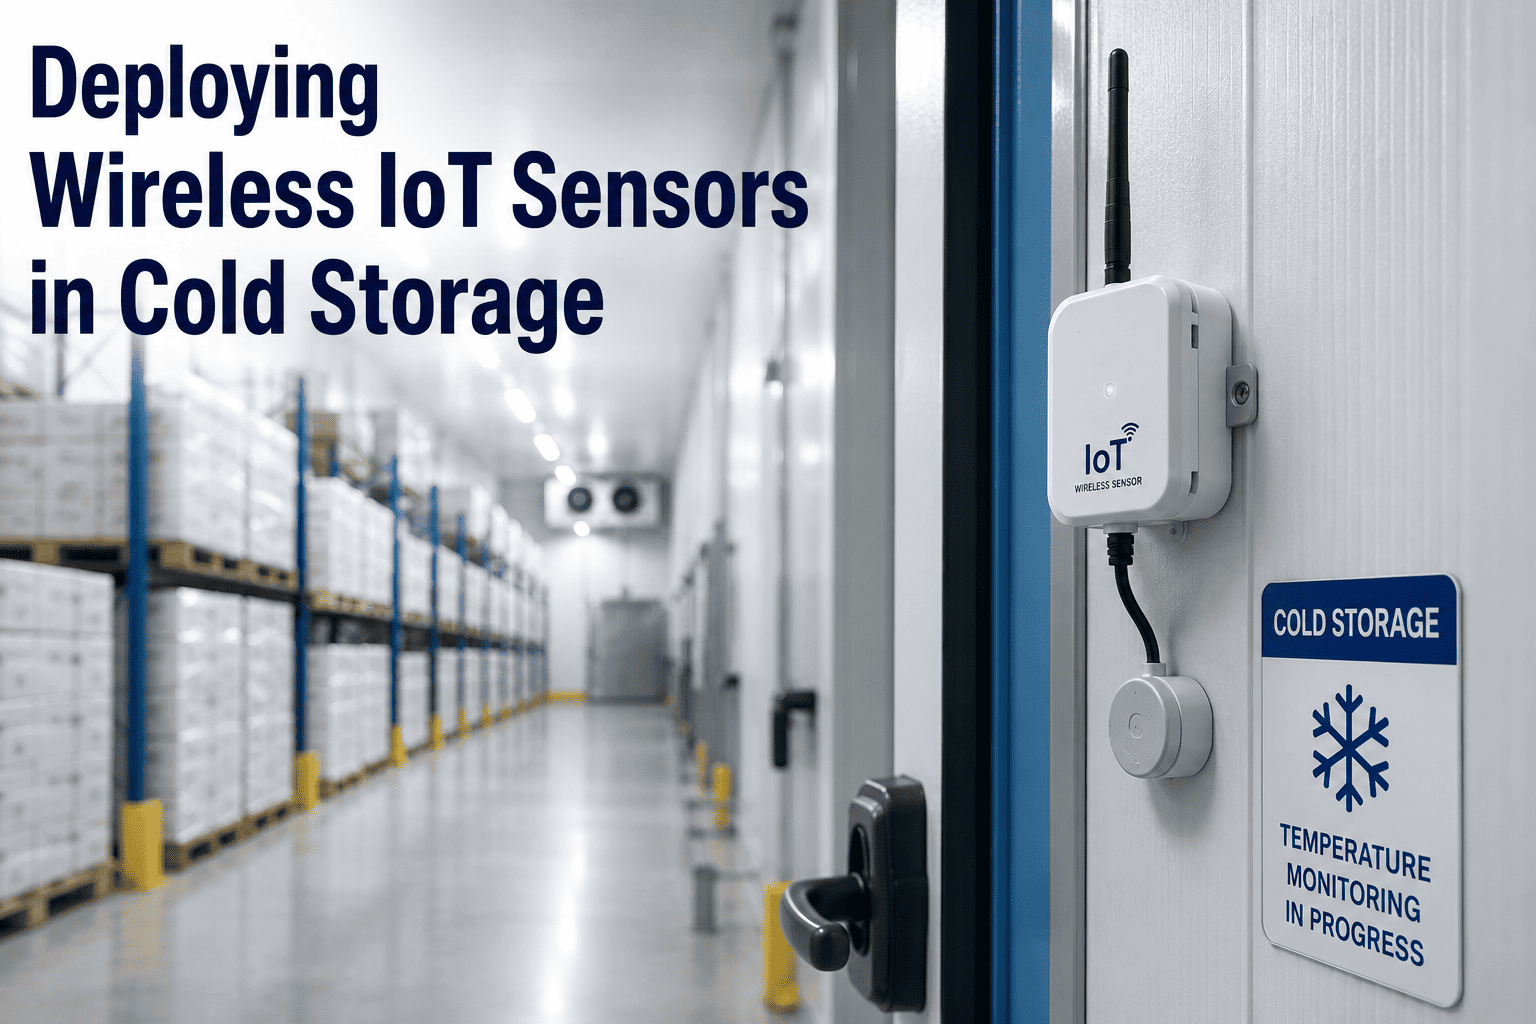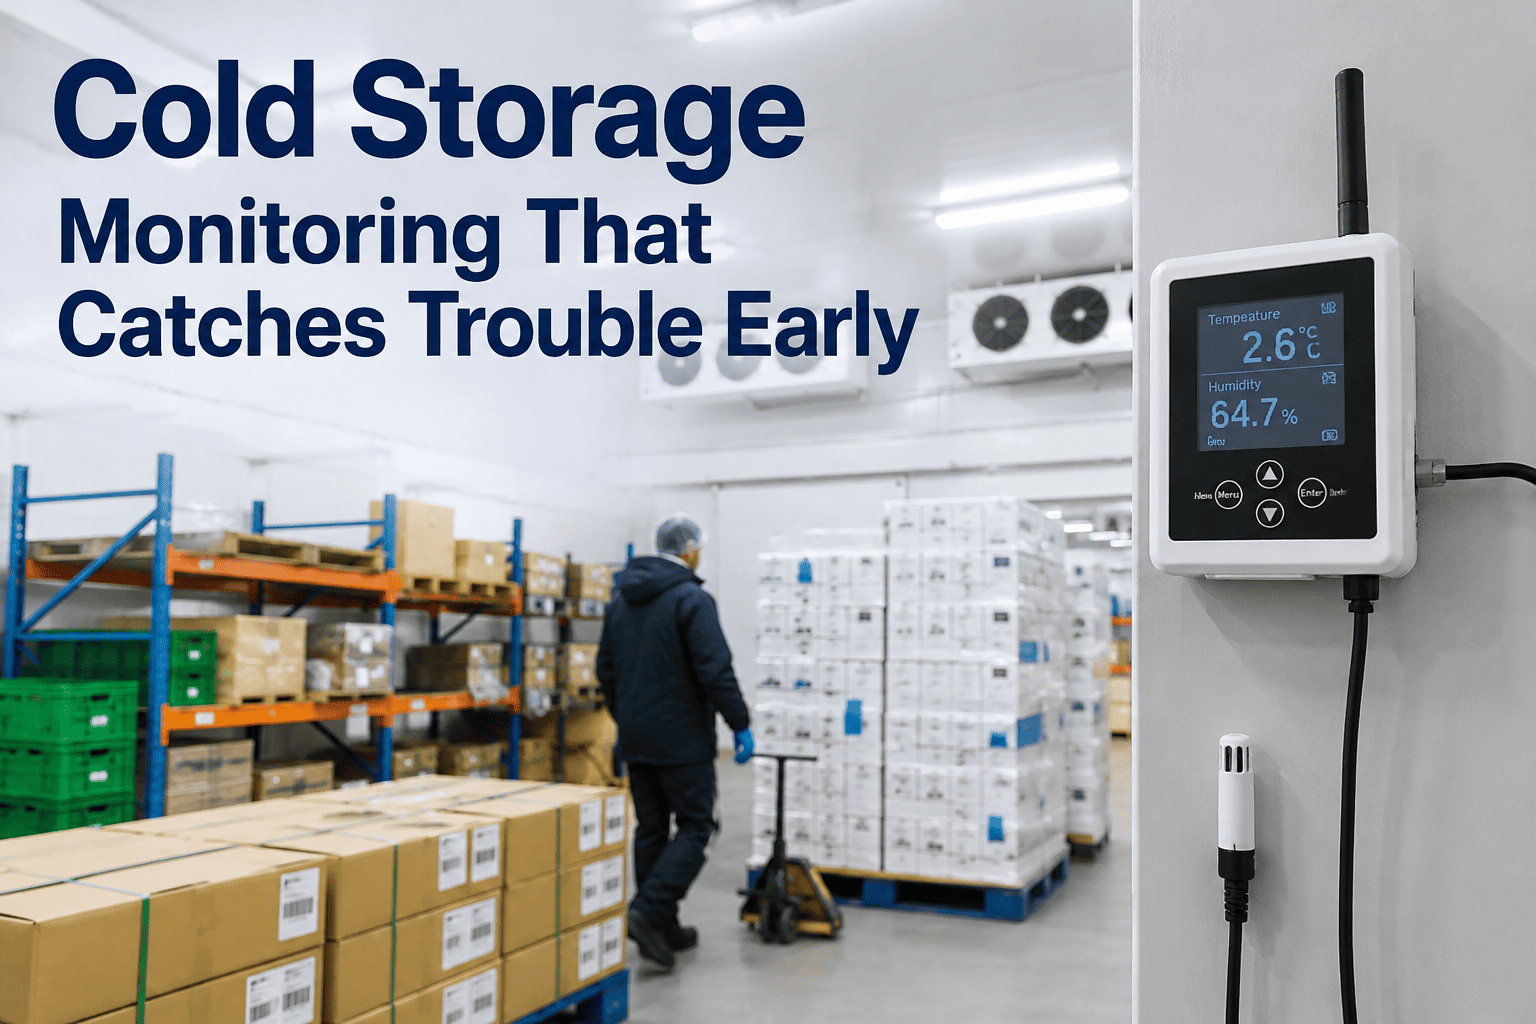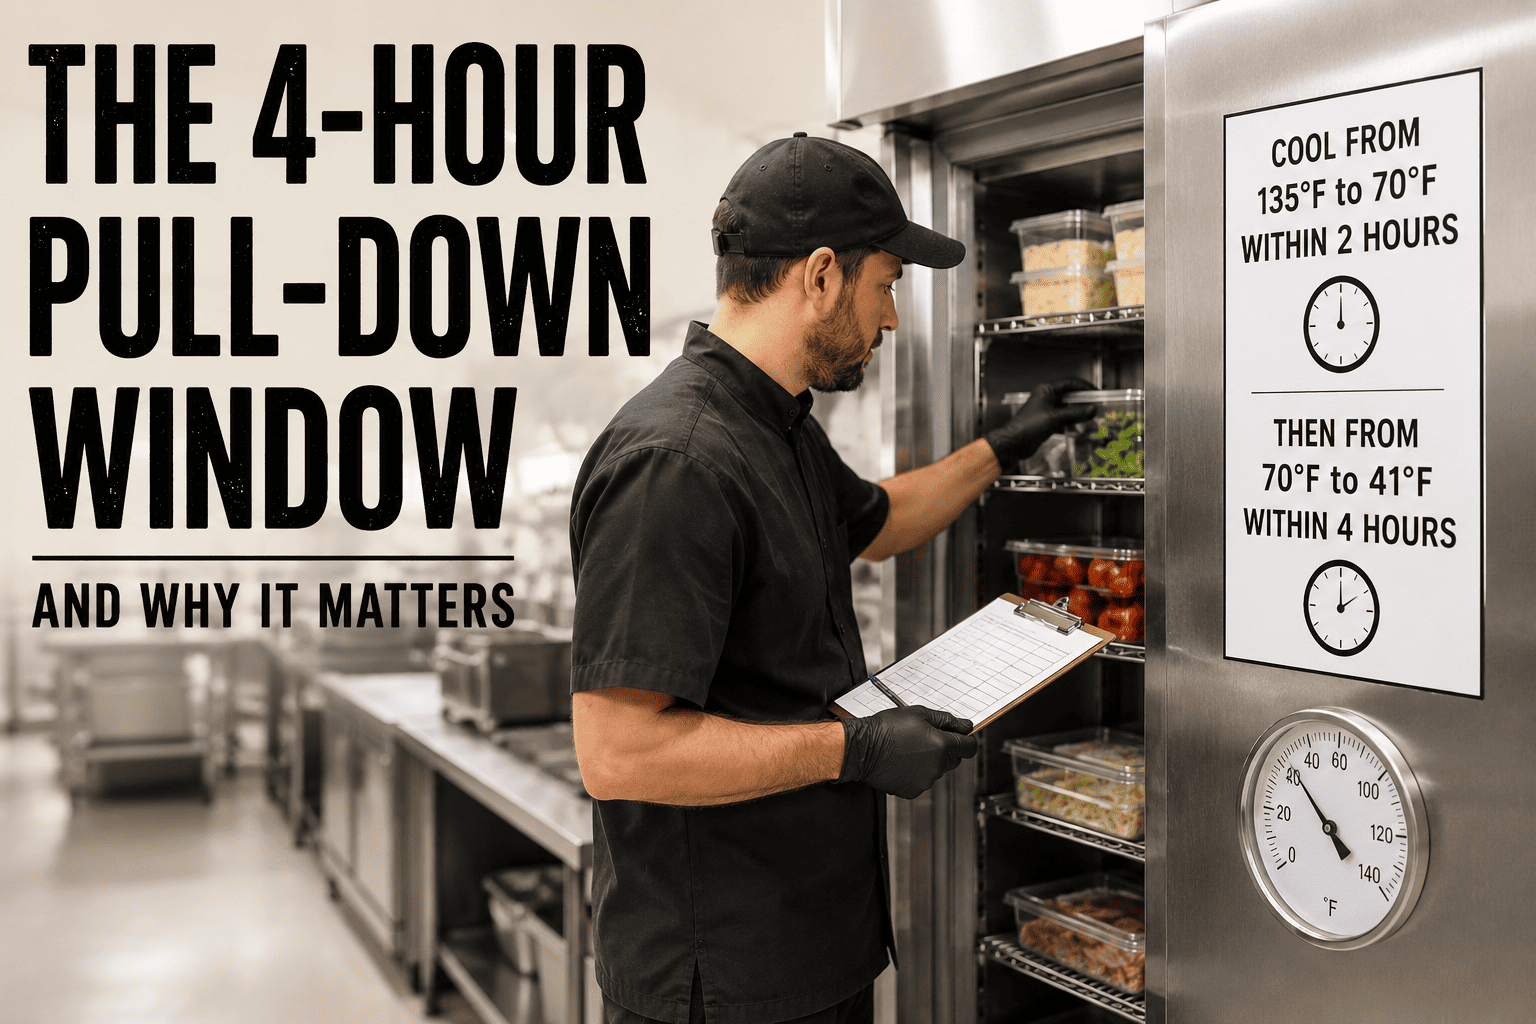
When blast-freezers and refrigerated holding cells drift even a fraction of a degree outside spec, the financial and food-safety exposure compounds by the hour — a single missed 4-hour pull-down window can trigger pathogen multiplication, product loss, audit failures and six-figure recalls. Cold storage operators running CMMS-monitored pull-down programs consistently outperform peers on uptime, audit readiness and energy intensity because they catch capacity decay before it breaches the critical zone. This guide breaks down the mechanics of the 4-hour pull-down window, the monitoring program that protects it, and how teams use Start Free Trial tooling to trend refrigeration capacity in real time.
Can your freezer hit 5°C within 240 minutes — every single load, every shift, every season?
The 4-hour pull-down window is not a target. It is the legal line between saleable product and a documented pathogen multiplication event. Without continuous capacity monitoring, drift goes unnoticed until the first failed audit — or the first recall notice.
60°C → 5°C pull-down
The Science Behind 240 Minutes
Food safety frameworks — HACCP, FDA Food Code 2022, and the FSMA Preventive Controls rule — converge on a single thermal benchmark: product must move from 60°C down to 5°C within 4 hours. That window is not arbitrary; it is derived from the growth curves of Listeria monocytogenes, Salmonella spp., and Clostridium perfringens, which enter their logarithmic multiplication phase once internal temperature lingers between 7°C and 60°C.
How CMMS Trending Catches Capacity Drift Before It Bites
Refrigeration systems do not fail suddenly — they degrade gradually. Compressor valve wear, condenser fouling, refrigerant leakage, and evaporator ice buildup each shave BTU/hr off rated capacity in increments too small for a thermostat alarm to catch but large enough to push a pull-down cycle from 3.5 hours to 4.5 hours over a quarter.
Baseline Capacity Logging
Every pull-down cycle is time-stamped from the moment product crosses the 60°C threshold to the moment internal probes register 5°C. The CMMS stores each cycle against ambient temperature, load mass, and cell ID — building a statistically significant baseline within 30 days of deployment.
Drift Detection Alerts
When the rolling 7-day average pull-down time extends beyond 85% of the baseline — typically 3 hours 24 minutes against a 4-hour ceiling — the CMMS auto-generates a work order. Maintenance is dispatched before the cycle ever breaches compliance, not after.
Capacity Trend Dashboards
Operators see a live trend line of BTU/hr effective capacity per cell, overlaid with maintenance events, defrost cycles, and ambient temperature. A downward slope of 8% over 60 days is the canonical early-warning signature of condenser fouling or refrigerant loss.
Audit-Ready Documentation
Every pull-down cycle, every alert, every corrective work order is archived with timestamps, probe serials, and technician signatures. When a third-party auditor asks for 90 days of HACCP critical-control records, the report exports in under 60 seconds — no spreadsheet archaeology required.
The Operational Program That Protects the Window
Monitoring is necessary but not sufficient. The 4-hour window is protected by a disciplined operational program — preventive maintenance, defrost optimization, and load-staging — all scheduled and tracked through the CMMS. A facility running this program typically sustains 99.2% pull-down compliance versus the 94.1% industry average reported by the Global Cold Chain Alliance.
Compressor & Condenser PM
- Monthly condenser coil cleaning — restores 6–12% heat-rejection capacity
- Quarterly compressor oil analysis — detects bearing wear before efficiency drops
- Semi-annual refrigerant charge verification — catches 5% leakage before COP degrades
- Annual valve plate inspection — prevents capacity loss from reed valve carbon buildup
Defrost Cycle Optimization
- Evaporator frost thickness sensors — trigger defrost at 3mm, not on a fixed timer
- Defrost termination by temperature, not duration — saves 18% energy per cycle
- Weekly drain pan inspection — prevents ice bridges that block airflow
- Hot-gas vs electric defrost audit — right-size the method per cell load profile
Load Staging & Airflow
- Product spacing minimums — 10cm clearance for cold-air circulation around pallets
- Load mass limits per cycle — never exceed 80% of rated cell capacity for 4-hour pull-down
- Door-open time enforcement — dock seals and strip curtains cut infiltration by 70%
- Inlet product temperature screening — reject loads above 65°C before they enter the cell
Month-by-Month: What a Protected Pull-Down Window Looks Like
A CMMS-tracked cold storage facility does not just react to failures — it trends capacity over time so maintenance is predictive, not corrective. Below is a representative 6-month timeline from a regional protein processor running 14 refrigerated cells through an integrated CMMS program.
Baseline Establishment
CMMS logs 420 pull-down cycles across 14 cells. Average cycle time: 3 hr 12 min. Compliance rate: 97.1%. Three cells flagged with drift above the 85% threshold — work orders auto-generated for coil cleaning and refrigerant top-off.
Corrective Action & Recovery
Flagged cells serviced. Cell 7 condenser cleaned — capacity restored from 82% to 96% of rated. Cell 11 received 4.2 kg refrigerant recharge. Average cycle time drops to 3 hr 04 min. Compliance climbs to 99.0%.
Stable Monitoring Phase
No drift alerts triggered. Trend dashboard shows flat capacity curves across all 14 cells. Energy intensity drops 7.4% versus Month 1 because compressors are no longer overworking to compensate for degraded heat rejection.
Seasonal Load Stress Test
Ambient temperature hits 38°C. Two cells show pull-down time extending to 3 hr 41 min — still compliant but trending. CMMS triggers pre-emptive PM on evaporator fans. No cycles breach 4 hours. Compliance holds at 98.8%.
Audit Readiness Confirmed
Third-party HACCP auditor requests 90 days of pull-down records. CMMS exports 1,260 cycle logs, 14 drift alerts, 14 corrective work orders, and technician sign-offs in 48 seconds. Zero non-conformances issued.
Year-over-Year Benchmark
Compliance rate locks at 99.2% — a 5.1-point improvement over the pre-CMMS baseline. Energy cost per kg of product cooled drops 11.3%. Maintenance spend decreases 23% because interventions are predictive, not emergency. Estimated annualized savings: $67,000 across the 14-cell operation.
The Operational Delta
The difference between a clipboard-and-thermometer operation and a CMMS-monitored cold chain is not incremental — it is structural. The table below maps the operational, financial, and compliance deltas observed across 40+ cold storage facilities that adopted integrated CMMS pull-down monitoring.
| Operational Metric | Before CMMS Monitoring | With CMMS Monitoring | Delta |
|---|---|---|---|
| Pull-down compliance rate (within 4 hr) | 94.1% | 99.2% | +5.1 pts |
| Mean time to detect capacity drift | 14–21 days | Under 48 hours | −93% |
| Unplanned compressor downtime | 22 hrs/quarter | 4 hrs/quarter | −82% |
| Energy cost per kg product cooled | $0.038/kg | $0.033/kg | −13.2% |
| Audit record retrieval time | 4–6 hours (manual) | Under 60 seconds | −99.9% |
| Product loss from failed pull-downs | $31K/quarter | $2.4K/quarter | −92% |
| Maintenance cost as % of asset value | 4.8% | 3.1% | −35% |
A 180-asset cold chain operator spending $42K/yr on temperature-related product loss
After deploying CMMS-integrated pull-down monitoring across 24 refrigerated cells, the operator reduced failed pull-down events by 88% in the first quarter, cutting product loss from $42,000 to $4,900 annually. Energy spend dropped $18,600 due to optimized defrost scheduling and early compressor intervention. Total first-year savings: $55,700 — against a CMMS subscription cost of $9,600. Payback achieved in 2.1 months.
Stop guessing whether your freezers can hit 5°C in time
Deploy CMMS-monitored pull-down tracking and see every cycle, every drift alert, and every corrective action in one dashboard — before a single load breaches the 4-hour window.
Pull-Down Window & CMMS Monitoring — Answered
The most common questions cold storage managers ask when evaluating CMMS-based pull-down monitoring for the first time.
What exactly counts as the "4-hour pull-down window" — and when does the clock start?
The clock starts the moment product internal temperature is logged at or below 60°C inside the cooling cell, and it ends when the core temperature reaches 5°C. The 4-hour ceiling is the maximum elapsed time permitted between those two points. It applies per batch, per cell — not as a daily average. A single cycle breaching 4 hours is a documented critical-control deviation under HACCP and must be recorded with corrective action.
How does a CMMS actually monitor pull-down time in real time?
The CMMS integrates with temperature probes, PLC controllers, and SCADA telemetry to log internal product temperature at 30- to 60-second intervals. Each pull-down cycle is automatically time-stamped at the 60°C crossing and the 5°C target. The system calculates elapsed time, compares it against the 4-hour ceiling, and triggers alerts if the cycle is trending toward non-compliance — typically at the 85% elapsed-time mark. You can see this in action by signing up for a Start Free Trial and connecting a probe feed.
Can CMMS monitoring prevent pull-down failures, or does it just document them?
Both — but prevention is where the value compounds. By trending effective BTU/hr capacity over weeks, the CMMS identifies degrading performance (condenser fouling, refrigerant leakage, evaporator ice buildup) and auto-generates preventive work orders before a cycle ever breaches 4 hours. Facilities using predictive CMMS monitoring report 82% fewer unplanned compressor downtime hours and 88% fewer failed pull-down events compared to clipboard-based monitoring.
What size cold storage operation benefits from CMMS pull-down tracking?
Any facility with 3 or more refrigerated cells, or any operation handling HACCP-regulated product — regardless of cell count — benefits. The compliance risk and audit documentation burden scale with volume, not facility size. A single-cell artisan processor facing a third-party audit needs the same time-stamped documentation as a 40-cell distribution hub. To scope a deployment for your operation, Book a Demo and we will map it to your cell count and product mix.
How long does it take to deploy CMMS pull-down monitoring across an existing cold chain?
For a facility with existing temperature probes and PLC controllers, typical deployment is 2 to 4 weeks — including sensor integration, baseline data collection (30 days of cycle logs), dashboard configuration, and staff training. Facilities without existing telemetry add 1 to 2 weeks for probe installation. The CMMS begins generating drift alerts and audit-ready reports from day one of the baseline period.
Your 4-hour window is too important to monitor with a clipboard
Join the cold chain operators who have made pull-down compliance a predictable, auditable, data-driven process — not a daily gamble.
Free 14-day trial · No credit card required