If you're running food manufacturing operations across multiple plants and still piecing together maintenance data from spreadsheets, emails, and plant-level reports — this page is written for you. See how Oxmaint solves multi-plant chaos → The problem isn't your people. It's that your systems were built for one plant, not five.
Executive Strategy · Enterprise Maintenance
The Multi-Plant Chaos Problem
Why Food Enterprises Lose Visibility Across Facilities — and the Cost Nobody Talks About
Large food manufacturers operating 3, 5, or 15 plants face an invisible crisis: every facility runs its own maintenance system, tracks its own KPIs, and reports in its own format. By the time data reaches leadership, it's already outdated — and the decisions made from it are already wrong.
$260K
Average cost per hour of unplanned downtime in food manufacturing
8–15%
Of maintenance budget lost to undetected waste without structured KPI tracking
80%
Reduction in KPI reporting time after centralizing maintenance data
3x
More likely to see significant improvements in decision-making with tracked KPIs
The Problem
Does Any of This Sound Familiar?
We hear the same story from VP-level operations leaders and plant directors across the food industry. The names change. The frustration doesn't.
"Our Ohio plant shows 92% OEE in their report. Our Texas plant shows 88%. But they measure OEE differently. I have no idea which plant is actually performing better."
VP of Operations · Mid-size Snack Manufacturer
"I get five different maintenance reports every Monday morning. Each plant uses a different template. It takes my team half a day just to reconcile the numbers into something I can present to the CFO."
Director of Plant Engineering · Frozen Foods Enterprise
"We had a major recall. The equipment failure that triggered it had been flagged three months earlier at a different facility — but nobody connected the dots because we had no cross-facility visibility."
Chief Operations Officer · Dairy Processing Group
Root Cause Analysis
Anatomy of Multi-Plant Maintenance Chaos
The problem isn't a lack of data — it's a lack of connected data. Here's exactly how visibility breaks down across a typical food enterprise with 4+ facilities.
Plant A
Uses spreadsheets + local CMMS
Tracks downtime in hours. Reports PM completion as a count. No standard asset naming convention.
→
Plant B
Uses a different legacy CMMS
Tracks downtime in shifts. Measures OEE differently from Plant A. Work orders stored locally only.
→
Plant C
Uses paper logs + email updates
No digital maintenance records. PM schedules exist only in the maintenance manager's notebook.
→
HQ
Gets three incompatible reports
Leadership spends 2–3 days reconciling data. By the time decisions are made, the data is 2 weeks old. Problems compound.
The Business Case
What Fragmented Maintenance Actually Costs
Most enterprise leaders underestimate the true cost of poor cross-facility visibility. It goes far beyond missed work orders.
Emergency Repair Premiums
Reactive-mode repairs cost 3–5x more than planned maintenance. Fragmented plants stay in reactive mode longer.
Compliance Penalty Risk
With FSMA Final Rule enforcement tightening, incomplete cross-facility maintenance records increase audit exposure significantly.
Wasted Management Hours
Directors and VPs spend 8–12 hours per week manually compiling reports instead of making decisions.
Missed Optimization Opportunities
Without cross-plant benchmarking, your best-performing plant's practices never reach your underperforming ones.
Transformation
What Centralized Asset Intelligence Changes
This isn't theory. These are the operational shifts that happen when multi-plant food enterprises unify their maintenance data on a single platform.
Each plant defines OEE, MTBF, and downtime differently — making comparisons meaningless
Monthly reporting requires 2–3 days of manual data reconciliation across plants
A failure pattern at Plant A stays invisible to teams at Plant B and C
Compliance records exist in different formats, making audits slow and risky
Best maintenance practices stay trapped inside the plant where they were developed
Capital decisions are based on gut instinct because cross-plant data doesn't exist
Standardized KPI definitions across every plant — OEE means the same thing everywhere
Live cross-facility dashboards update in real time — no manual report compilation needed
Failure patterns detected at one plant trigger alerts enterprise-wide immediately
Digital compliance records auto-generated in one format, audit-ready at any time
Top-performing plant's maintenance workflows are pushed to all facilities instantly
Capital planning backed by real asset performance data across your entire portfolio
The Solution
How Oxmaint Restores Enterprise Visibility
Oxmaint is purpose-built for food enterprises running multiple facilities. It doesn't just collect data — it unifies, standardizes, and surfaces the intelligence that multi-plant operators actually need.
01
Enterprise KPI Standardization
Define OEE, MTBF, MTTR, PM completion, and downtime metrics once at the enterprise level. Every plant automatically reports against the same definitions — so comparisons are finally meaningful.
02
Cross-Facility Live Dashboard
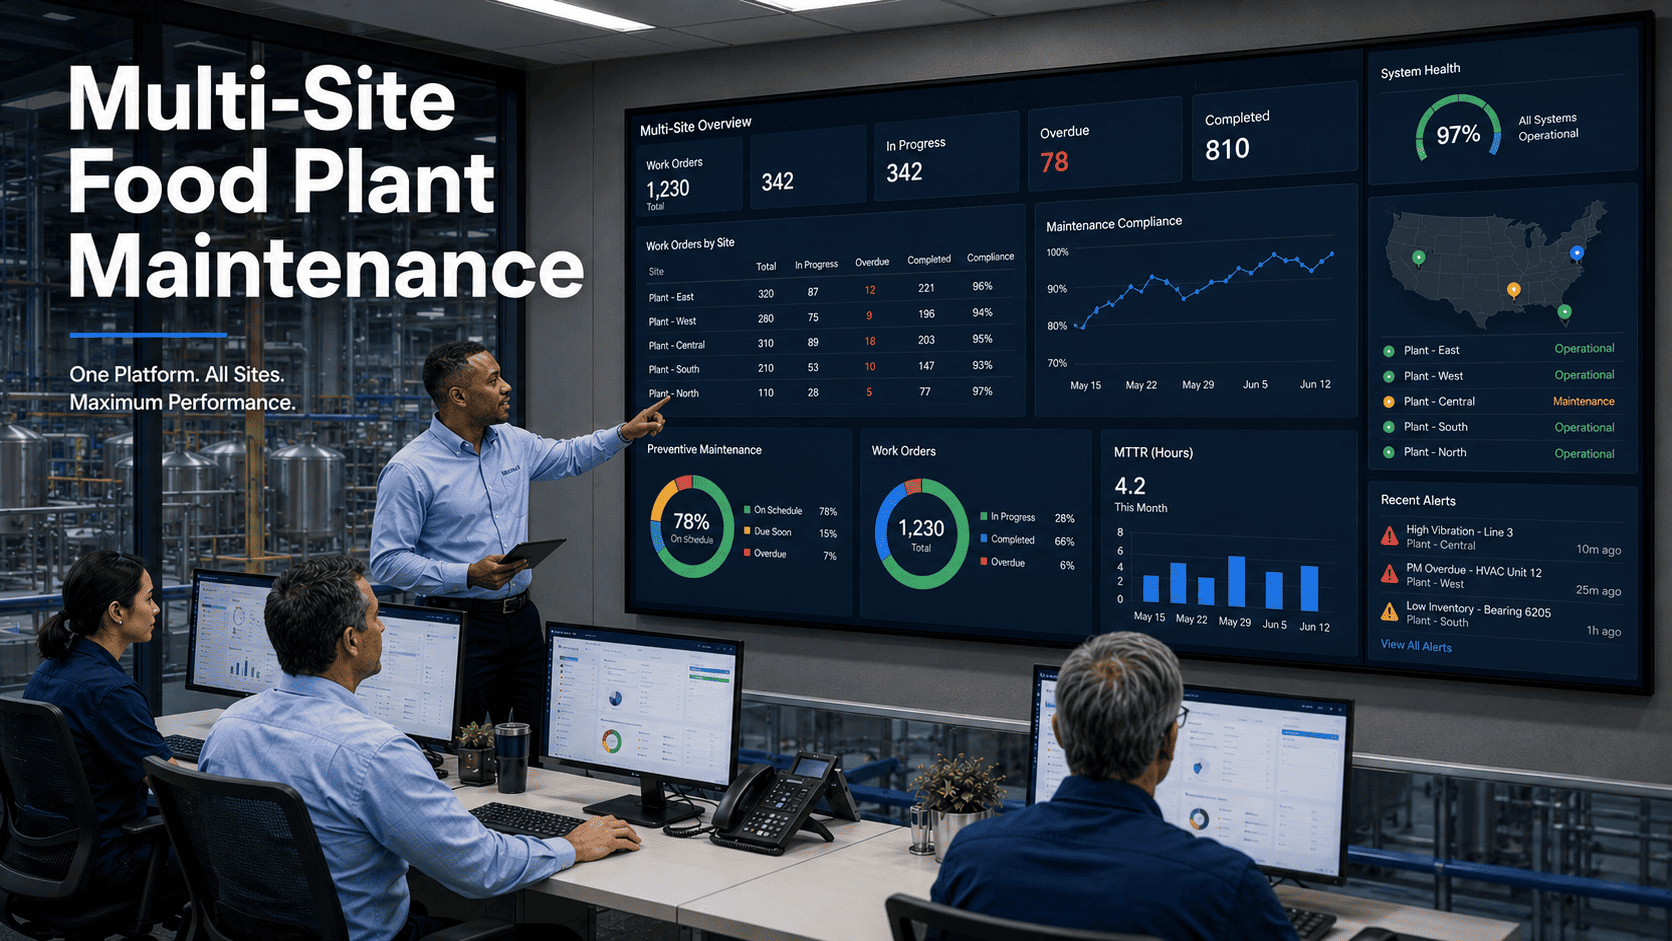
A single operations center view shows every plant's maintenance status in real time. See which facility is underperforming, which assets are at risk, and where your maintenance spend is going — across all sites simultaneously.
03
Centralized Asset Intelligence
Every asset across every plant — mixers, conveyors, ovens, fillers, packaging lines — tracked in one asset registry. Equipment history, failure patterns, and maintenance costs are visible enterprise-wide, not siloed by location.
04
Cross-Plant Failure Pattern Detection
When a recurring failure pattern is identified at one facility, Oxmaint flags the same asset type at every other plant proactively. You stop problems before they spread across your enterprise.
05
Enterprise Compliance Records
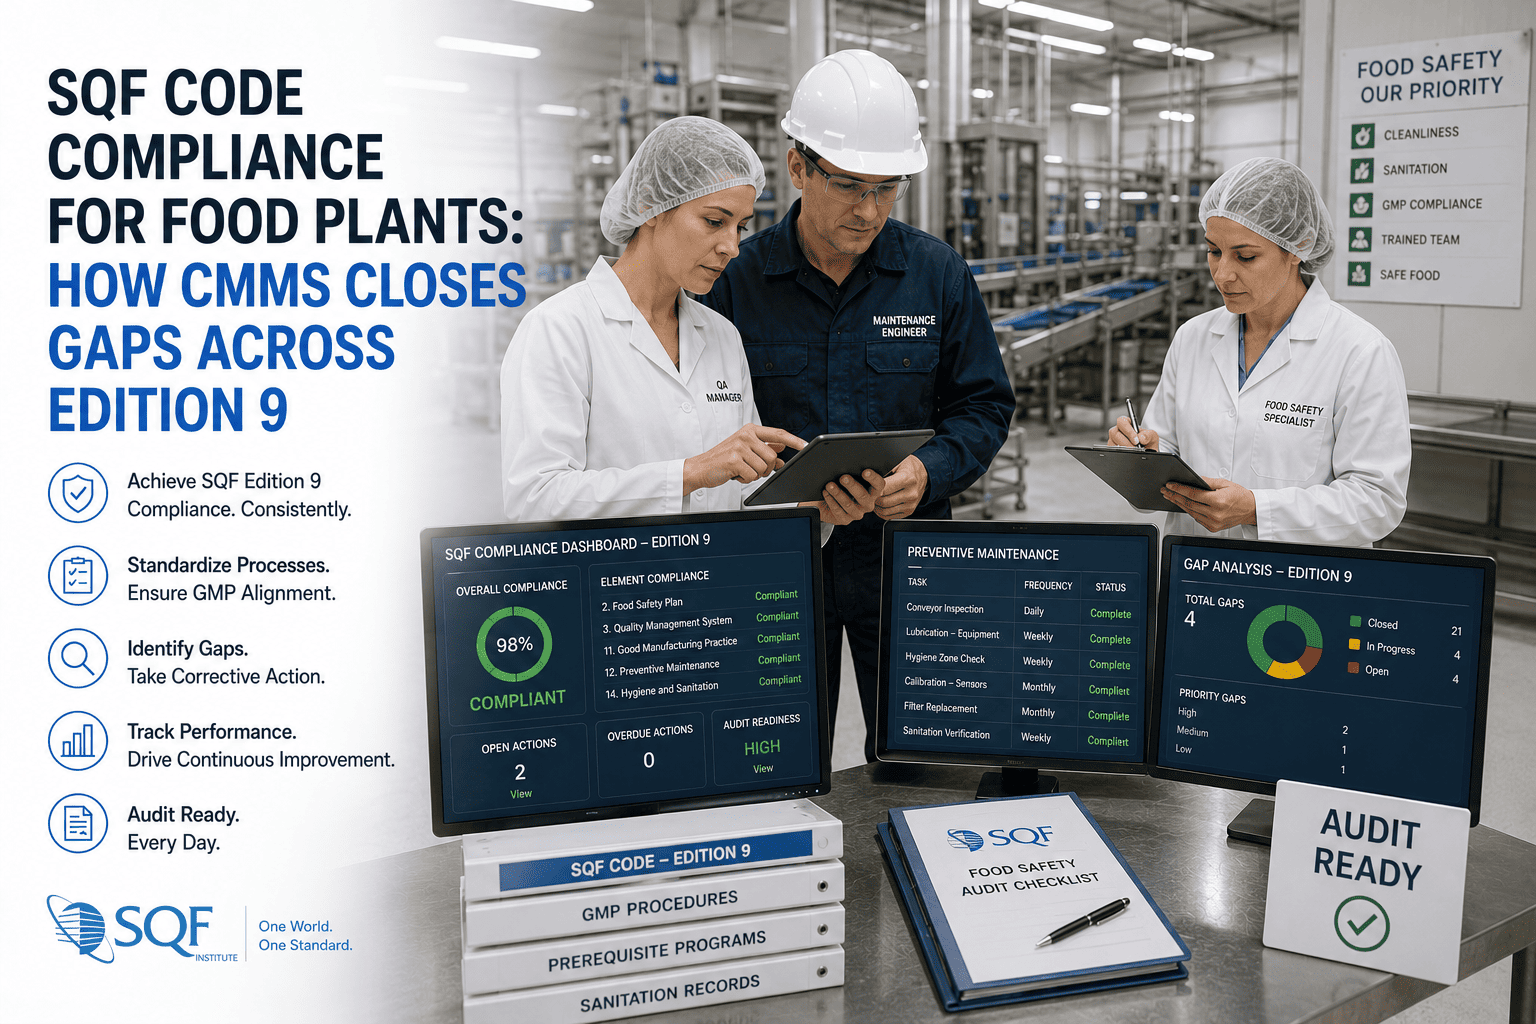
All maintenance logs, inspection records, temperature data, and work orders are stored in a unified, audit-ready format across every site. FSMA and SQF audits become a reporting exercise, not a fire drill.
06
Best Practice Propagation
When your top plant develops a maintenance strategy that drives up OEE, you can push that workflow to every other facility from headquarters — no email chains, no plant visits required.
What Enterprises Report After Unifying on Oxmaint
80%
Reduction in cross-plant reporting time
45%
OEE improvement across facilities
70%
Fewer unplanned downtime events
2 wks
Average time from signup to live enterprise dashboard
Who This Is For
Built for Enterprise Operators, Not Single-Site Managers
If any of these roles describe your situation, the multi-plant visibility problem is directly impacting your ability to do your job.
VP of Operations
You need cross-plant performance comparison without a two-day reporting process. You need to see which plants are dragging down the enterprise — and why.
Director of Plant Engineering
You need standardized maintenance workflows that apply consistently across all facilities, not five different approaches that evolved independently.
Chief Operations Officer
You need enterprise-level asset intelligence to make capital allocation decisions confidently — not spreadsheets that contradict each other.
Reliability & Maintenance Manager
You need to see failure patterns across plants, not just at your site. The next equipment failure might be happening at a plant you can't see right now.
Getting Started
From Multi-Plant Chaos to Enterprise Clarity in 30 Days
Most enterprise platforms take 6–18 months to implement. Oxmaint is designed differently — phased value from week one.
Week 1
Enterprise Asset Registry Setup
All assets across all plants are imported into a single registry with standardized naming conventions. Every facility speaks the same language from day one.
Week 2
KPI Standardization & Baseline Measurement
Enterprise-level KPI definitions are locked in. Baseline measurements are established per plant — so you know exactly where every facility stands before improvements begin.
Week 3
Live Dashboard Activation
The enterprise operations dashboard goes live. Leadership sees real-time cross-plant performance for the first time — no manual compilation, no waiting until Monday morning.
Week 4+
Predictive Alerts & Workflow Deployment
AI-driven failure predictions activate. Best-practice maintenance workflows from top-performing plants are pushed enterprise-wide. The platform begins delivering compounding value.
Ready to Regain Control?
Your plants are already generating the data you need. You just can't see it yet.
Oxmaint connects your facilities into a single intelligence layer — without replacing your existing equipment or disrupting operations.
Common Questions
What Enterprise Teams Ask Before Getting Started
Real questions from operations leaders evaluating centralized maintenance intelligence for the first time.
Do all our plants need to use the same equipment or software to connect to Oxmaint?
No. Oxmaint is designed to connect facilities regardless of their existing systems. Whether a plant uses a legacy CMMS, spreadsheets, or paper records, Oxmaint acts as the unifying layer on top — pulling data in and standardizing it for enterprise-level reporting. You don't need to replace anything at the plant level to get started.
How long before we see a meaningful cross-plant dashboard?
Most enterprises have a live cross-facility dashboard within 10–14 days of onboarding. The process starts with asset registry import — which we support with templates and a dedicated implementation team — and progresses to live KPI tracking within the first two weeks. You'll have real data before your next monthly operations review.
What if each of our plants currently defines maintenance KPIs differently?
This is the most common challenge we solve. Oxmaint includes an enterprise KPI standardization module where you define OEE, MTBF, MTTR, and other key metrics at the corporate level. All plants then automatically report against those definitions. Historical data can be recalculated against the standard definition so you get apples-to-apples comparison across all sites.
How does this help with FSMA compliance across multiple plants?
Oxmaint automatically generates digital maintenance and inspection records for every facility in a unified, audit-ready format. When an FDA or SQF auditor requests documentation, you can pull complete, cross-facility compliance records in minutes — not days. Every maintenance action is timestamped, attributed to a specific technician, and tied to a specific asset and location.
Can we pilot with just two or three plants before rolling out enterprise-wide?
Yes, and we recommend it. Most enterprise clients start with their highest-volume or most-complex facilities first. Once the value is proven — typically within 60–90 days — expanding to additional plants is fast because the enterprise framework is already in place. Your pilot plants effectively do the setup work for the entire rollout.
What does pricing look like for a multi-plant enterprise?
Oxmaint offers enterprise pricing that scales by the number of facilities and assets — not by user seat count, which typically penalizes growth. We work with operations teams of all sizes, from 3-plant regional processors to 20+ facility national brands. Book a demo and we'll walk you through a pricing model built around your specific plant configuration.
Multi-Plant Maintenance Intelligence
Stop Managing Plants in the Dark
Oxmaint gives food enterprises the cross-facility visibility, standardized KPIs, and centralized asset intelligence they need to actually run a multi-plant operation — not just react to it.
Enterprise-ready in 2 weeks
·
No equipment replacement needed
·
Standardized KPIs across all plants
·
Audit-ready compliance records