Sustainability has shifted from corporate social responsibility talking points to core operational strategy. One-third of shoppers prioritize environmental impact in purchasing decisions. Regulatory frameworks are tightening. Supply chain partners demand transparency. But the most compelling driver is financial: food manufacturers tracking energy, water, and waste metrics consistently identify cost savings that dwarf their sustainability investment. Book a demo to see how real-time utility monitoring transforms sustainability from aspiration to operational advantage.
Energy Efficiency
62.1%
of manufacturers report measurable energy improvements
Food manufacturing consumes 6% of total industrial energy use. Heat pumps reduce consumption by 75%. Heat recovery systems capture waste energy from refrigeration and baking processes. Membrane technology saves 90% of energy in water removal operations.
Water Conservation
85-95%
water recovery in modern reclamation systems
A single meat processing plant can reclaim 500,000 gallons daily. Water accounts for 20% of production costs in beverage manufacturing. Behavioral changes alone achieve 25% usage reduction. Recycling and monitoring technologies push savings to 60%.
Waste Reduction
48.3%
of manufacturers achieving waste output improvements
Food waste equals 145 billion meals annually in the US. Upcycling converts by-products into value-added ingredients. Anaerobic digesters transform organic waste into energy. 40% of manufacturing surplus redirected to animal feed, 30% to composting.
Energy Monitoring: The Foundation of Sustainability Programs
You cannot improve what you do not measure. Energy efficiency receives the highest allocation of sustainability budgets for one reason: it delivers immediate, quantifiable ROI. Food manufacturers reducing energy consumption by even 5-10% save tens of millions of dollars annually while simultaneously reducing their carbon footprint.
Process Heating & Cooling
67%
Ovens, boilers, refrigeration, freezers, pasteurization, sterilization
Mixers, conveyors, pumps, compressors, agitators, packaging machinery
Facility lighting, climate control, ventilation, air handling systems
Steam distribution, electricity generation, transmission inefficiencies
PROVEN STRATEGY
Heat Recovery Systems: Capturing Waste Energy
Baking to Water Preheating
Exhaust heat from industrial ovens (60°C) → Preheat incoming water → Reduce boiler load by 40%
Refrigeration to HVAC
Waste heat from refrigeration condensers → Preheat cold air makeup → Cut HVAC costs by 30%
Steam Vapor Recompression
Low-pressure residual steam → Compress to higher pressure → Reuse in evaporation processes
A single heat recovery implementation can reduce energy consumption by 20-45% in specific process areas, delivering payback periods under 18 months.
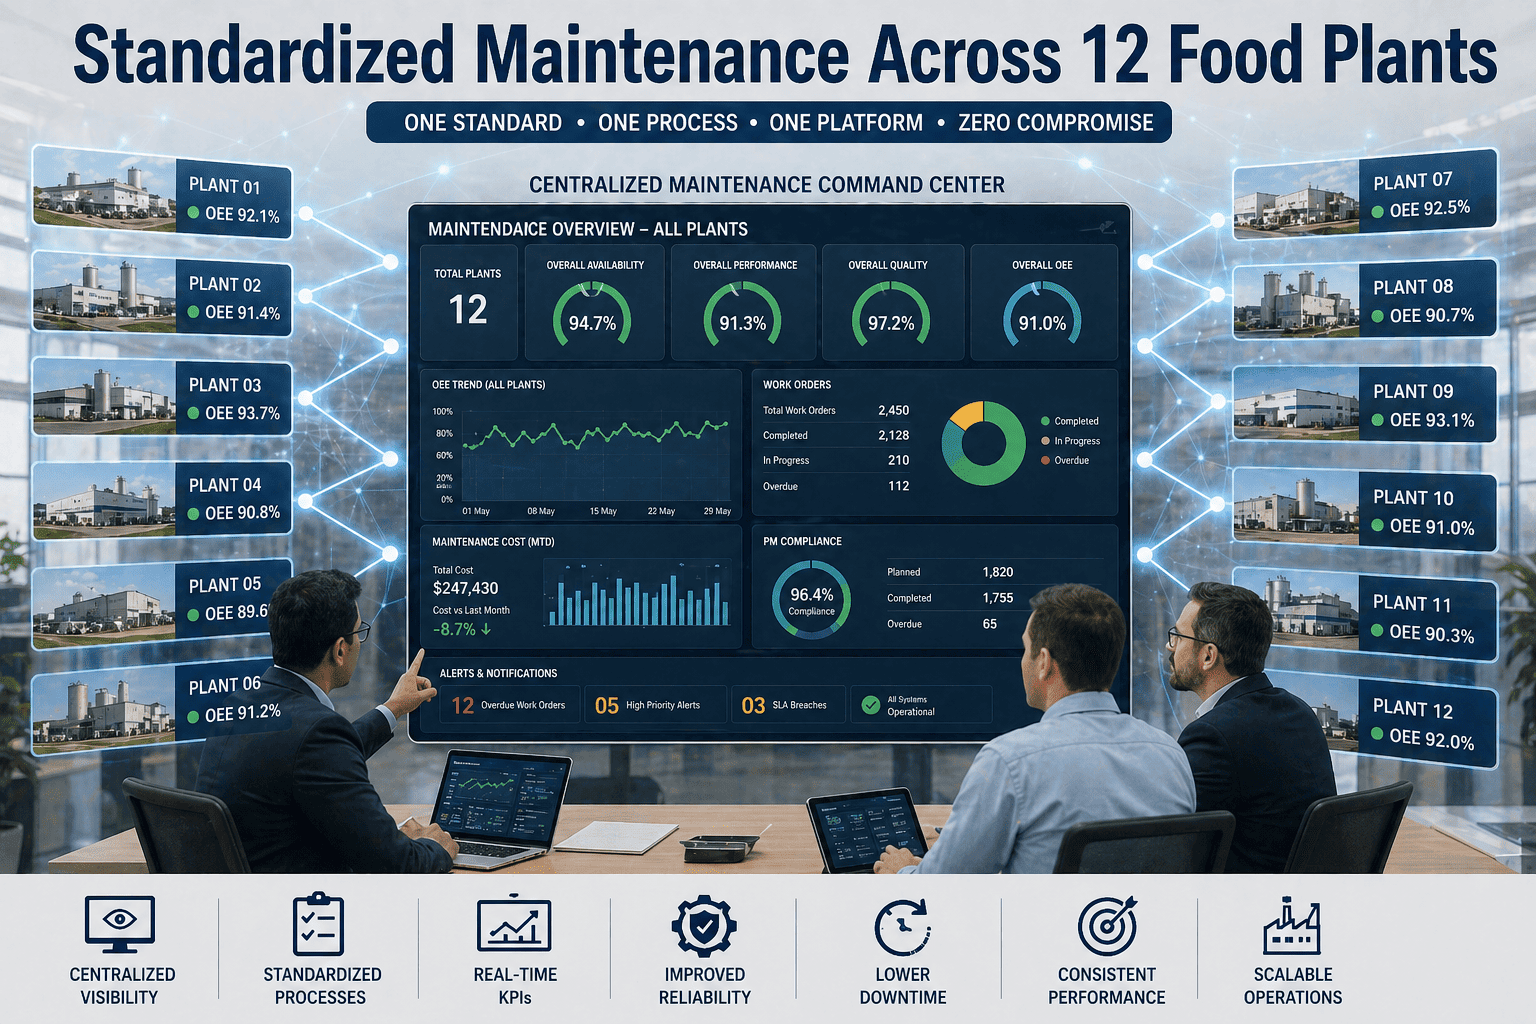
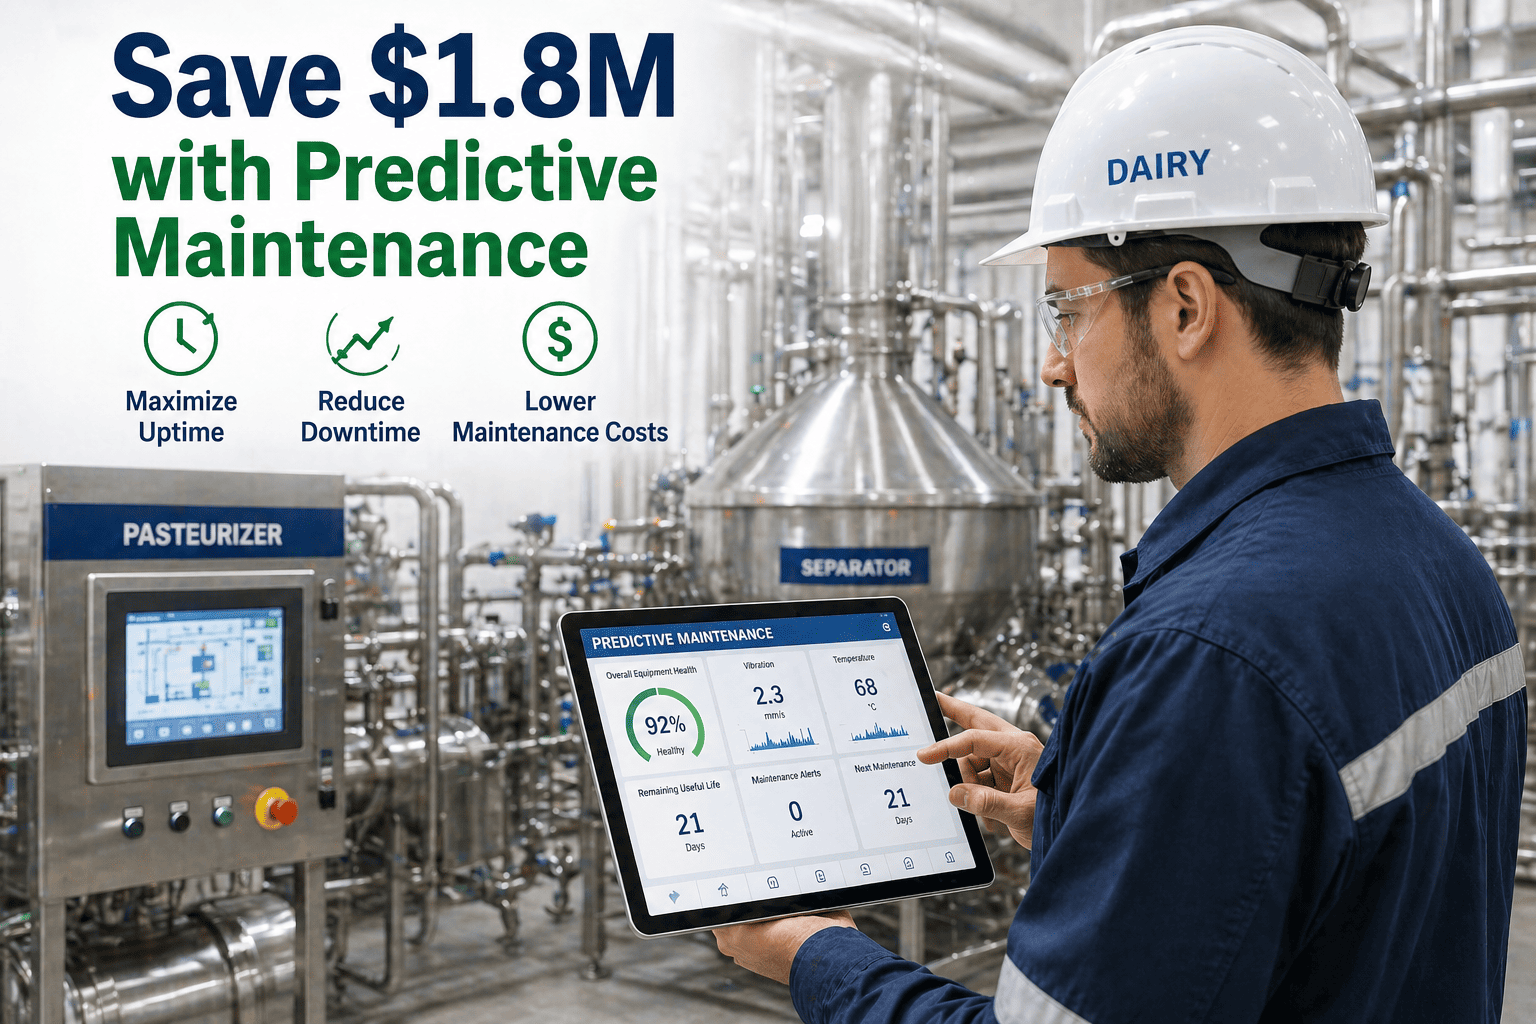
Real-Time Utility Monitoring: Visibility Drives Action
Legacy facilities track energy consumption monthly through utility bills. Modern operations monitor usage in real-time, down to individual equipment level. This granularity reveals inefficiencies invisible in aggregate data—equipment running during idle hours, compressed air leaks, cooling systems cycling unnecessarily.
Equipment-Level Visibility
Track energy consumption by production line, individual assets, or utility type. Identify which equipment consumes disproportionate energy relative to output. Detect anomalies indicating maintenance needs before they become failures.
Peak Demand Management
Utility Management Systems show real-time demand curves. Schedule high-consumption processes during off-peak hours. Avoid demand charges by preventing simultaneous operation of energy-intensive equipment. Reduce peak loads by 15-25%.
Behavioral Change Through Data
Dashboards visible to operations teams create accountability. Tracking reveals patterns like doors left open, lights left on, equipment idling unnecessarily. Behavioral improvements alone deliver 10-15% energy savings with zero capital investment.
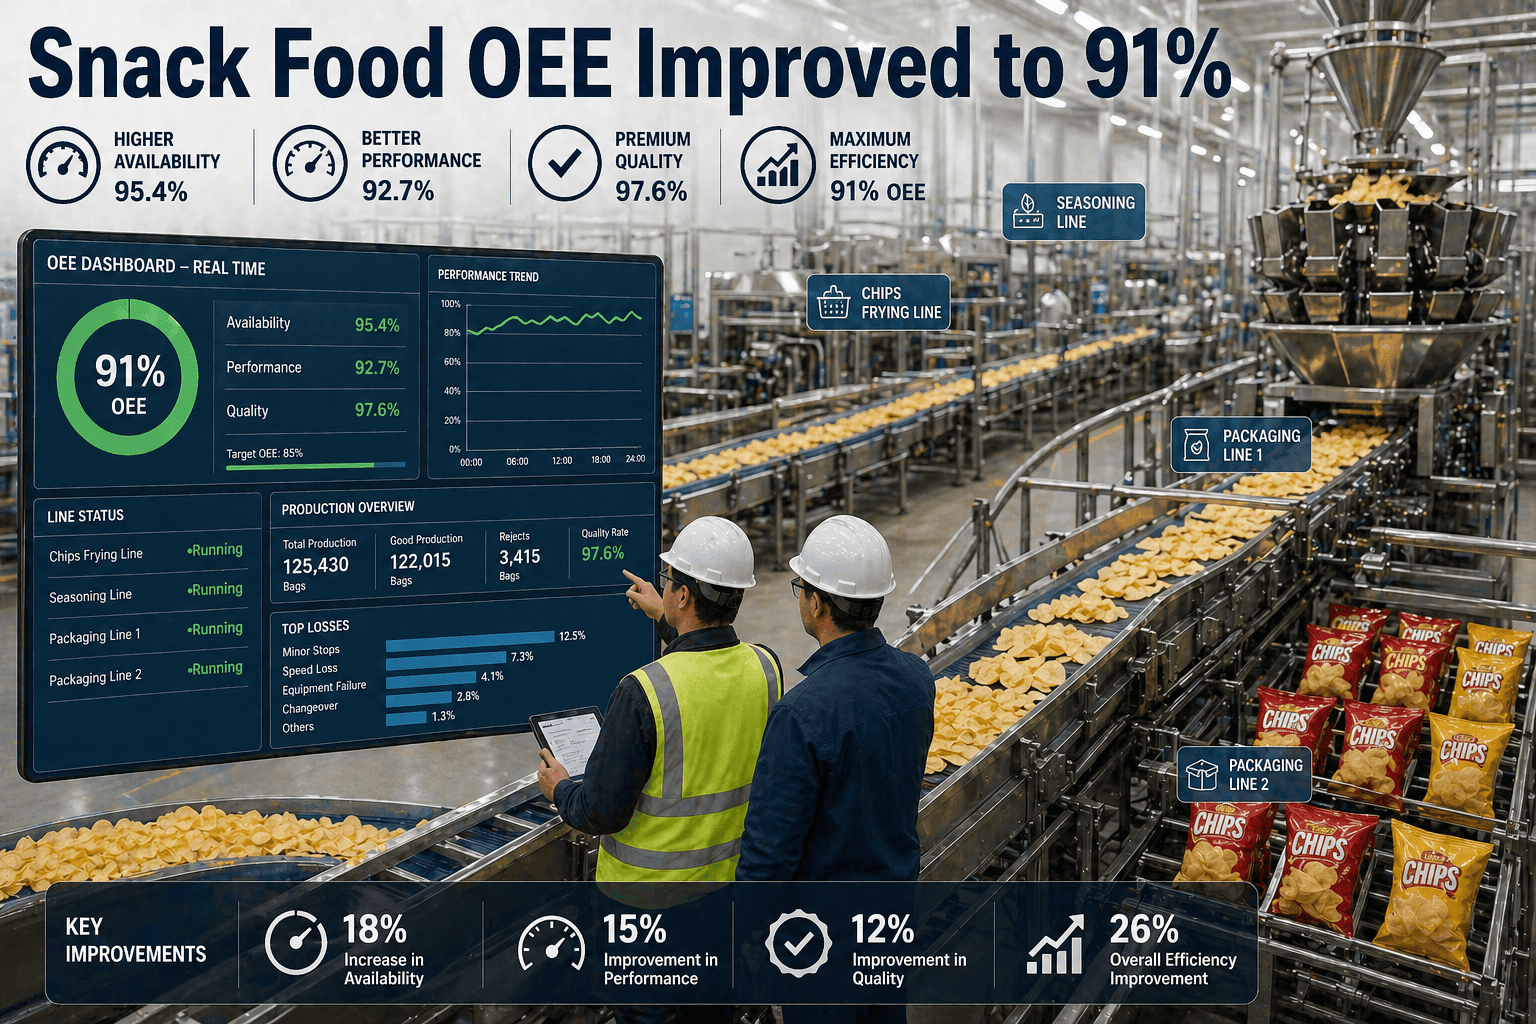
Performance KPIs
Measure energy intensity per production unit. Compare efficiency across shifts, lines, or facilities. Set reduction targets based on baseline data. Track progress monthly with automated reporting that proves sustainability impact to stakeholders.
30%
Operational cost reduction achievable through digital water solutions, improved energy management, and chemical optimization according to the Water Environment Federation
Water Management: From Consumption to Conservation
Water use in food manufacturing is massive—a single cup of orange juice requires 185 liters from farm to finished product. Beverage facilities can spend 20% of total production costs on water. The opportunity for improvement is equally massive, with technologies now enabling 85-95% recovery rates.
01
Monitor and Meter Everything
Install flow meters at critical consumption points. Track usage by production line, cleaning operation, and utility system. Identify high-consumption areas. Australian manufacturers achieved 60% water reduction through monitoring alone—no technology changes, just visibility driving different decisions.
Impact: 25-60% reduction through behavioral change and process optimization
02
Reclamation and Reuse Systems
Membrane filtration removes particulates. Reverse osmosis eliminates dissolved solids. UV treatment ensures microbiological safety. Process condensate, wash water, and RO reject water redirect to cooling towers, fluid coolers, or non-potable applications. One facility reclaims 500,000 gallons daily.
Impact: 85-95% water recovery from targeted process streams
03
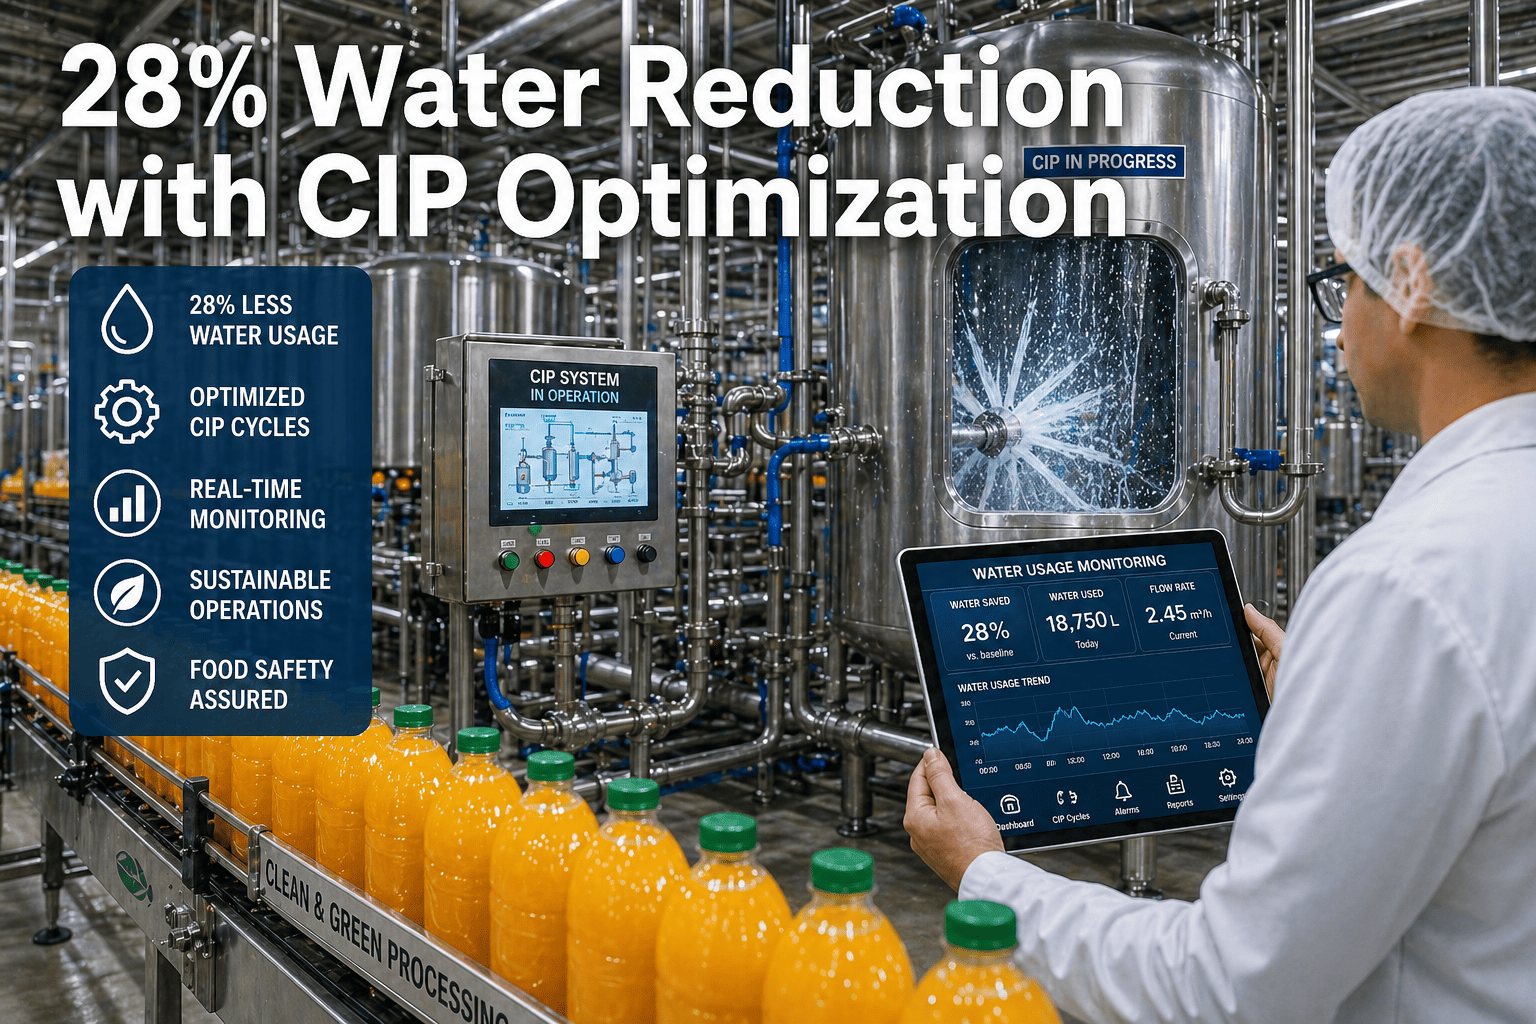
CIP Optimization
Clean-in-place systems consume massive water volumes. Rotating wash spheres improve distribution, cutting water usage by 30%. Real-time monitoring software detects waste, tracks resource consumption, and optimizes wash cycles. Replace water-based lubrication with dry PTFE systems where applicable.
Impact: 30% reduction in cleaning water, energy, and chemical usage
04
Wastewater Treatment Innovation
Anaerobic digesters convert organic waste into biogas for energy generation. Membrane bioreactors produce high-quality effluent suitable for reuse. Bio-based remediation removes 90% of pollutants including heavy metals. Advanced treatment enables discharge compliance and water reuse simultaneously.
Impact: 20-30% operational cost reduction plus energy generation from waste
Waste-to-Value: Turning By-Products Into Revenue
The US food system wastes resources equivalent to 145 billion meals annually. For manufacturers, this represents lost input costs—raw materials, water, energy, labor—plus disposal expenses. Forward-thinking facilities are reversing this equation, converting unavoidable by-products into valuable outputs.
By-Product Identification
Fruit peels, vegetable trimmings, spent grain, whey, pulp, soybean residue, processing water with organic content
→
Value Assessment
Analyze nutritional content, chemical composition, volume consistency, collection feasibility, market demand
→
Conversion Strategy
Animal feed, upcycled food ingredients, compost, anaerobic digestion to biogas, industrial feedstock for biofuels or bioplastics
→
Economic Value
Disposal cost elimination, revenue from by-product sales, energy generation offsetting utility costs, brand value from sustainability
40%
Manufacturing surplus redirected to animal feed
30%
Organic waste sent to composting operations
8-10%
Global greenhouse gas emissions from food systems
Sustainable Packaging: Material Innovation Meets Cost Reduction
Thirty percent of food manufacturers are investing in eco-friendly packaging—not just for brand positioning, but because sustainable materials increasingly outperform traditional plastics on both environmental and economic metrics.
✕
Petroleum-based plastics
✕
300-1000 year decomposition
✓
Cornstarch, sugarcane, bamboo base materials
✓
Biodegradable in 90-180 days
✓
Post-consumer recycled content integration
✓
Lightweight design reduces transport emissions
✓
Consumer preference premium pricing
Track Sustainability Metrics That Matter to Your Bottom Line
Oxmaint's energy and utility monitoring gives food manufacturers real-time visibility into consumption patterns, waste generation, and resource efficiency. Set baseline metrics, track improvement over time, and generate sustainability reports that prove ROI to executives and environmental impact to stakeholders.
Regulatory Landscape: Compliance as Competitive Advantage
European Union's Corporate Sustainability Reporting Directive. Science Based Targets initiative FLAG requirements covering land-use emissions. FDA's evolving traceability standards. Sustainability reporting is shifting from voluntary to mandatory. Manufacturers building robust tracking systems now are positioning for regulatory requirements likely to become standard within 3-5 years.
EU CSRD
Corporate Sustainability Reporting Directive
Detailed environmental impact reporting including emissions, resource use, and supply chain transparency
Action Required: Establish data collection infrastructure for energy, water, waste, and emissions tracking across operations
SBTi FLAG
Forest, Land, and Agriculture Guidance
Measurement and reduction of land-based emissions including deforestation, soil degradation, and agricultural impact
Action Required: Map supply chain land use, calculate FLAG emissions, set science-based reduction targets
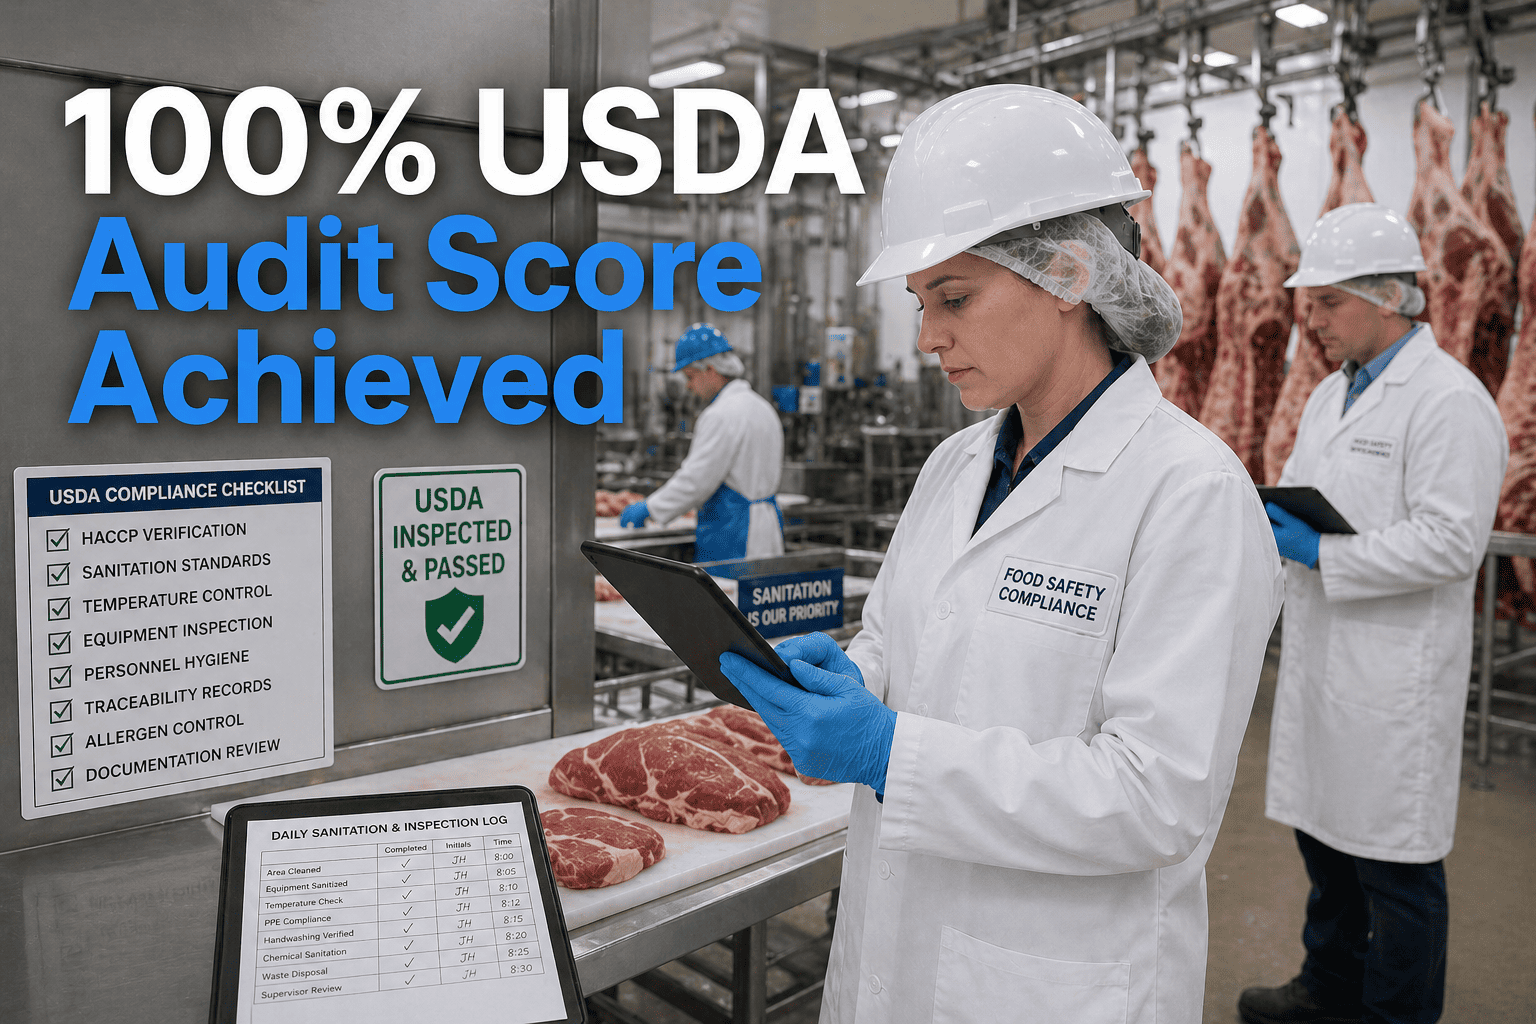
FSMA 204
Food Traceability Rule
Enhanced traceability for high-risk foods with comprehensive recordkeeping from supplier to distribution
Action Required: Digital systems tracking raw material origin, processing steps, resource inputs per batch
Technology Integration: Sustainability Meets Smart Manufacturing
Modern sustainability programs don't exist in isolation—they integrate with production management, quality systems, and maintenance operations. Real-time data from utility monitoring, waste tracking, and resource consumption flows into enterprise systems that optimize operations while simultaneously documenting environmental performance.
Data Collection Layer
Energy Meters
Water Flow Sensors
Waste Scales
Temperature Monitors
Equipment Runtime Trackers
↓
Integration & Analytics
IoT Platform
CMMS Integration
ERP Connection
MES Data Sync
Analytics Engine
↓
Actionable Outcomes
Sustainability Reports
Cost Reduction Alerts
Compliance Documentation
Performance Dashboards
Improvement Recommendations
Mid-Size Beverage Facility
Heat recovery + water reclamation systems
$180,000 capital investment
$95,000 annual energy savings + $45,000 water cost reduction
15-month payback period
Large Meat Processing Plant
Real-time monitoring + behavioral programs
$35,000 metering and software
$62,000 annual reduction from waste elimination
7-month payback period
Bakery Operation
Waste-to-energy anaerobic digester
$425,000 equipment and installation
$85,000 disposal cost elimination + $95,000 energy generation
28-month payback period
Implementation Roadmap: From Measurement to Results
Successful sustainability programs follow a consistent pattern: measure current state, identify high-impact opportunities, implement targeted improvements, verify results, and scale what works. This isn't a one-time project—it's an operational discipline built on continuous visibility and improvement.
Phase 1
Baseline Measurement
Install energy meters on major equipment and production lines
Implement water flow monitoring at consumption points
Track waste generation by type and source
Collect 90 days of baseline data
Timeline: 60-90 days
Phase 2
Opportunity Identification
Analyze consumption patterns for anomalies and inefficiencies
Calculate energy intensity per production unit
Identify equipment with disproportionate resource use
Prioritize improvements by ROI potential
Timeline: 30-45 days
Phase 3
Quick Wins Implementation
Deploy behavioral change programs with visible dashboards
Fix identified leaks, optimize schedules, eliminate waste
Implement low-cost process adjustments
Measure and document improvement
Timeline: 30-60 days
Phase 4
Capital Projects
Deploy heat recovery systems in high-temperature processes
Install water reclamation and reuse infrastructure
Upgrade to energy-efficient equipment where justified
Implement waste-to-value conversion systems
Timeline: 6-12 months
SUSTAINABILITY MEETS PROFITABILITY
Turn Environmental Goals Into Operational Improvements
Oxmaint transforms sustainability from compliance burden to competitive advantage. Real-time energy monitoring, water usage tracking, and waste reduction analytics give you the visibility to identify savings opportunities, prove ROI on green initiatives, and generate sustainability reports that satisfy stakeholders from executives to auditors.
No credit card required
Setup in 1 week
Immediate ROI tracking