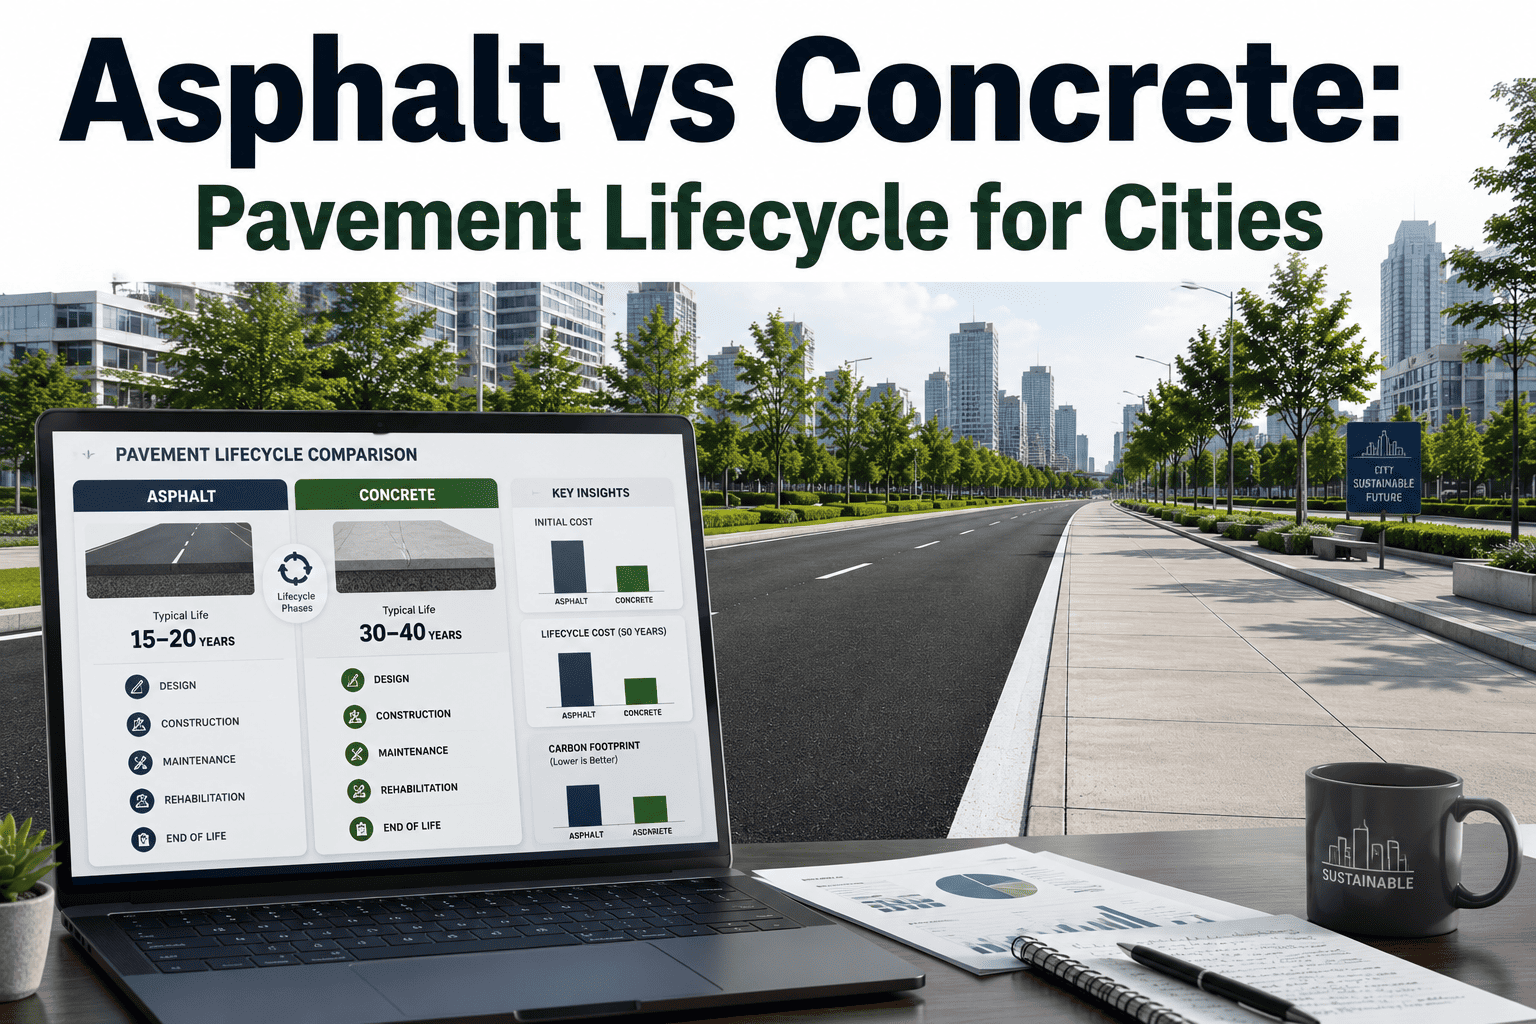
For a municipality, the pavement material chosen today quietly writes the maintenance budget for the next two decades. Asphalt and concrete each carry distinct lifecycle profiles — different upfront costs, different failure modes, and very different break-even horizons — and the gap between a good call and a bad one is rarely visible until year twelve, when the cheaper option begins demanding mill-and-overlay cycles the more durable one defers. This guide breaks the asphalt vs concrete pavement decision into lifecycle economics, traffic and climate suitability, and total cost of ownership so public works directors can defend their material choice with data instead of instinct. Ready to model the numbers for your own network? Start Free Trial and run the comparison in minutes.
Asphalt or concrete — the call that locks in 20 years of cost.
A 12-inch concrete slab can carry 40% more axle loading before structural failure, yet asphalt still wins 70% of U.S. road miles on first-cost. The right answer is rarely the cheapest bid — it is the lifecycle equation your network actually lives.
- Resurface every 12–15 yrs
- Lower initial outlay
- Rutting under heavy truck traffic
- 40 yr TCO ≈ $5.1M
- Structural life 30–40 yrs
- 56% higher first cost
- Resists rutting & soft-soil creep
- 40 yr TCO ≈ $5.9M — but less disruption
Why first-cost bidding loses money by year 15.
Federal Highway Administration data shows the average U.S. municipal arterial is resurfaced 2.6 times in a 40-year window. Most agencies bid the lowest initial price, then pay the difference — with interest — in reactive maintenance.
PWF = present-worth factor at the agency discount rate (typically 3–4% for municipalities). User-delay cost alone can equal 30% of TCO on congested corridors.
A medium-sized city (≈240 lane-miles of arterial) that defaults to asphalt because it is "cheaper" typically commits to $3.1M in mill-and-overlay work between years 12 and 18 — money a concrete-aligned corridor would not need for another decade. When that overlay is deferred by even three years, rutting and fatigue cracking accelerate, pushing the next intervention from a $90K/lane-mile overlay to a $260K/lane-mile reconstruction. The lifecycle equation is unforgiving because pavement deterioration is non-linear: once 15–20% of the network drops below PCI 55, repair costs compound at roughly 2.4× the rate of a network held above PCI 70.
Asphalt vs concrete: the parameters that decide a bid.
Twelve factors drive municipal pavement selection. The table below benchmarks each against FHWA, AASHTO 93 design inputs, and typical bid tabs from 2022–2024 state DOT lettings.
| Parameter | Asphalt (Flexible) | Concrete (Rigid) | Decision Weight |
|---|---|---|---|
| Initial cost / lane-mile | $2.8M–$3.6M | $4.5M–$5.8M | High at bid stage |
| Design structural life | 15–20 yrs (to first major rehab) | 30–40 yrs | Decisive for lifecycle |
| Major rehab interval | 12–15 yrs | 20–25 yrs | Drives TCO swing |
| Truck-load capacity (ESALs) | Susceptible to rutting >1M ESALs | Handles 2M+ ESALs without permanent deformation | High for freight routes |
| Climate suitability | Performs in cold; softens >120°F | Stable in heat; vulnerable to freeze-thaw scaling without air entrainment | Regional |
| Cure / open-to-traffic time | 2–6 hours | 7–14 days | High for urban detours |
| Night-repair feasibility | Excellent | Limited — requires full slab replacement | High for arterials |
| Recyclability at end-of-life | 99% RAP reclaimable | Crush as aggregate base only | Sustainability goal |
| Noise (CPX, dB(A)) | Quieter by 3–5 dB(A) | Higher; grooving adds tone | Residential corridors |
| Fuel economy (heavy vehicles) | Baseline | 1.5–2.5% better rolling resistance | Long freight hauls |
Five pavement beliefs that bust municipal budgets.
Field experience and FHWA Long-Term Pavement Performance data contradict the most common assumptions engineers hear in council chambers.
Asphalt is always the cheaper road over 40 years.
On truck-heavy arterials above 8,000 AADT, concrete's lower rehab frequency closes the TCO gap by year 22 and pulls ahead by year 30 — before user-delay costs are counted.
Concrete lasts forever with no maintenance.
Unsealed joints, load transfer failure, and ASR can drop a concrete pavement from PCI 85 to PCI 55 in under 8 years. Scheduled joint resealing every 5–7 yrs is non-optional.
Climate doesn't materially change the asphalt vs concrete calculus.
In regions with >40 freeze-thaw cycles per year, improperly air-entrained concrete loses 15–20% of its service life; in climates above 110°F peak, asphalt rutting risk doubles.
A four-question filter that ends the asphalt vs concrete debate.
Before opening bid tabs, run the corridor through this filter. Each question maps to a documented failure mode in FHWA LTPP data.
Is the corridor above 8,000 AADT with >8% heavy trucks?
If yes, ESAL accumulation will trigger asphalt rutting inside 10 years. Concrete's load-transfer dowels preserve serviceability past 25 years on the same volume — the standard recommendation for freight corridors and bus rapid-transit lanes.
How many freeze-thaw cycles and what peak temperature does the site see?
Above 40 freeze-thaw cycles, specify air-entrained concrete (6–8% air voids) or accept asphalt with polymer-modified binder. Peak pavement temps above 132°F demand PG 76-22 binder to suppress rutting — a $4/yd² premium that protects the overlay cycle.
What is the resilient modulus and drainage class of the subgrade?
Soft, poorly-draining subgrades (MR < 6,000 psi) favor flexible asphalt because it accommodates differential settlement. Stiff, well-drained subgrades unlock concrete's structural advantage — and the 30-year design life that pays for the higher bid.
Can the agency finance a 56% higher first cost for a 30-year payoff?
If capital is constrained, asphalt staged with a 12-year overlay remains defensible. If the agency can carry the first-cost premium, concrete defers $1.9M/lane-mile in future overlays and reduces lane-closure events by 60% over the analysis period.
A 6.2-mile arterial rebuild in a 90,000-population city
A midwestern public works department evaluated asphalt vs concrete for a 6.2-mile, 4-lane arterial carrying 11,400 AADT at 9% truck traffic. Asphalt bid at $14.1M; concrete at $22.3M. Lifecycle modeling at 3.5% discount showed asphalt requiring three overlays ($8.7M PV) and one mill-and-inlay reconstruction ($3.2M PV) by year 40, versus a single joint reseal and diamond grind for concrete ($2.1M PV). Including user-delay costs of $1.4M (asphalt) vs $0.6M (concrete), 40-year TCO closed to $27.4M asphalt vs $25.0M concrete — and concrete delivered 22 fewer full-closure days. The council approved concrete; by year 9, the PCI gap had already widened 14 points in concrete's favor.
Where the money actually moves over 40 years.
Per-lane-mile figures below reflect 2024 national averages adjusted to a 3.5% municipal discount rate. User-delay estimates follow FHWA Work Zone Road User Costs methodology.
| Cost Layer (40 yr, per lane-mile) | Asphalt | Concrete | Delta |
|---|---|---|---|
| Initial construction | $3.2M | $5.0M | +$1.8M |
| Preventive maintenance (PV) | $0.6M | $0.9M | +$0.3M |
| Major rehab cycles (PV) | $2.4M | $0.7M | −$1.7M |
| User-delay cost (PV) | $1.4M | $0.6M | −$0.8M |
| Salvage value (PV) | −$0.3M | −$0.4M | −$0.1M |
| 40-yr TCO (PV) | $7.3M | $6.8M | −$0.5M |
On this arterial profile the concrete premium is recovered by year 24, primarily through deferred overlays and reduced lane-closure exposure. Reverse any one variable — drop AADT below 6,000, shorten the analysis to 25 years, or raise the discount rate to 5.5% — and asphalt wins the TCO line by $0.3M–$0.7M. The framework's value is making those sensitivities explicit before the bid is let.
Run the asphalt vs concrete lifecycle model on your own network.
Upload corridor AADT, subgrade data, and bid tabs — OxMaint returns a 40-year TCO comparison with PCI projections and rehab triggers in under 10 minutes.
Pavement lifecycle questions, answered.
When does asphalt genuinely beat concrete on lifecycle cost?
On low-volume local streets (under 3,000 AADT), short analysis horizons (under 20 years), soft or variable subgrades, and corridors requiring frequent utility cuts. Asphalt's faster cure time, lower first cost, and 99% recyclability as RAP make it the lifecycle winner whenever the structural-life advantage of concrete cannot be fully amortized within the analysis period.
How does climate change the asphalt vs concrete decision?
Regions exceeding 40 annual freeze-thaw cycles risk concrete scaling unless air entrainment (6–8% voids) is specified and verified. Desert climates with pavement temperatures above 132°F push asphalt into rutting failure unless PG 76-22 or polymer-modified binder is used — adding roughly $4/yd² but protecting the 12-year overlay cycle. Both failure modes are predictable; ignoring them is what destroys lifecycle math.
What discount rate should a municipality use for pavement LCC analysis?
FHWA recommends 3–4% for public infrastructure, reflecting the long horizon and low risk profile of pavement assets. At 3.5%, future overlays are discounted heavily enough that concrete's deferred rehab schedule often wins TCO; at 5.5% or above, asphalt's lower first cost dominates and concrete struggles to break even inside 30 years.
Can a city mix asphalt and concrete on the same corridor?
Yes — and many agencies do, using concrete at intersections and bus stops where slow, channelized heavy vehicles rut asphalt, then asphalt for the midblock runs where speed and noise matter. The transition detailing matters: a 15-foot concrete approach slab with load-transfer dowels prevents the reflective cracking that otherwise appears within 3 years. Want the joint-design checklist? Book a Demo and we will walk your team through it.
How does OxMaint help with the asphalt vs concrete decision?
The platform ingests your PCI survey, traffic counts, subgrade borings, and recent bid tabs, then runs a 40-year deterministic LCC model comparing both materials under your local discount rate, climate band, and truck-volume scenario. Outputs include year-by-year PCI projection, rehab trigger dates, and a sensitivity table showing where the TCO crossover occurs. Start Free Trial to model your first corridor at no cost.
Stop guessing. Model the 40-year call before the bid.
Join the public works teams using OxMaint to defend material decisions with lifecycle economics instead of lowest-bid instinct.
Free 14-day trial · No credit card